
Open-Source Internship opportunity by OpenGenus for programmers. Apply now.
Reading time: 25 minutes
Statistics and Probability are a powerful tools to use in real life in general. Basic concepts in Statistics give a solid foundation to understand things around us better.
From a high-level view, statistics is the use of mathematics to perform technical analysis of data. A basic visualisation such as a line chart will give some high-level information but with statistics we get to operate on the data in a much more in an intelligent way.
We will explore 5 fundamental statistics concepts that you need to know and how they can be applied most effectively in general things in everyday life.
These 5 concepts are just the tip of the iceberg. Dive deeper into the domain of Data Science and enchance your practical skills with an in-depth curriculum. These will help you in upskilling and stay competitive.
Statistical Features
Statistical features is the most commonly used statistics concept. It is the first basic technique you would apply when exploring a dataset and includes things like bias, variance, mean, median, percentiles, and many others. It’s all fairly easy to understand and implement in code. Check out the following illustration:
The line in the middle is the median value of the data. Median is the most frequently occuring data in the dataset. Mean is the average value.
Median is used over the mean since it is more robust to outlier values. The first quartile is essentially the 25th percentile; i.e 25% of the points in the data fall below that value. The third quartile is the 75th percentile; i.e 75% of the points in the data fall below that value. The min and max values represent the upper and lower ends of our data range.
Example: For instance, you have received a test result and you want to have a quick idea of your performance as ranks are not published these days. If you have access to test results of your fellow classmates, the process is easy. Calcutate the basic statistics measurements like median, mean, quartile and others. If your result is the median, you performed like most other classmates but if you are on the higher percentile, then you are one of the best.
A box plot perfectly illustrates what we can do with basic statistical features:
- When the box plot is short it implies that much of your data points are similar, since there are many values in a small range
- When the box plot is tall it implies that much of your data points are quite different, since the values are spread over a wide range
- If the median value is closer to the bottom then we know that most of the data has lower values. If the median value is closer to the top then we know that most of the data has higher values. Basically, if the median line is not in the middle of the box then it is an indication of skewed data.
- Are the whiskers very long? That means your data has a high standard deviation and variance i.e the values are spread out and highly varying. If you have long whiskers on one side of the box but not the other, then your data may be highly varying only in one direction.
Bayesian Statistics
To understand why we need Bayesian Statistics, you need to understand why Frequency Statistics fails.
Frequency Statistics is the type of statistics that most people think about when they hear the word “probability”. It involves applying math to analyze the probability of some event occurring, where specifically the only data we compute on is prior data.
Let’s look at an example. Suppose I gave you a dice and asked you what were the chances of you rolling a 6. Well most people would just say that it’s 1 in 6. Indeed if we were to do a frequency analysis we would look at some data where someone rolled a dice 10,000 times and compute the frequency of each number rolled; it would roughly come out to 1 in 6!
But what if someone were to tell you that the specific die that was given to you was loaded to always land on 6? Since frequency analysis only takes into account prior data, that evidence that was given to you about the dice being loaded is not being taken into account.
Bayesian Statistics does take into account this evidence that is previously occured event.
We can illustrate this by taking a look at Bayes' theorem:
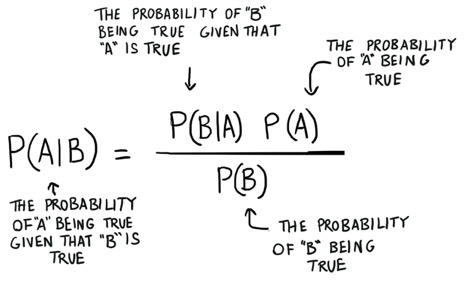
The probability P(H) in our equation is basically our frequency analysis; given our prior data what is the probability of our event occurring. The P(E|H) in our equation is called the likelihood and is essentially the probability that our evidence is correct, given the information from our frequency analysis. For example, if you wanted to roll the die 10,000 times, and the first 1000 rolls you got all 6 you’d start to get pretty confident that that dice is loaded. The P(E) is the probability that the actual evidence is true.
If our frequency analysis is very good then it will have some weight in saying that yes our guess of 6 is true. At the same time we take into account our evidence of the loaded die, if it’s true or not based on both its own prior and the frequency analysis. As you can see from the layout of the equation Bayesian statistics takes everything into account. Use it whenever you feel that your prior data will not be a good representation of your future data and results.
Example: You can use Bayesian Statistics to observe the performance of your friends in a game and then, come up with a strategy to outrun everyone.
Probability Distributions
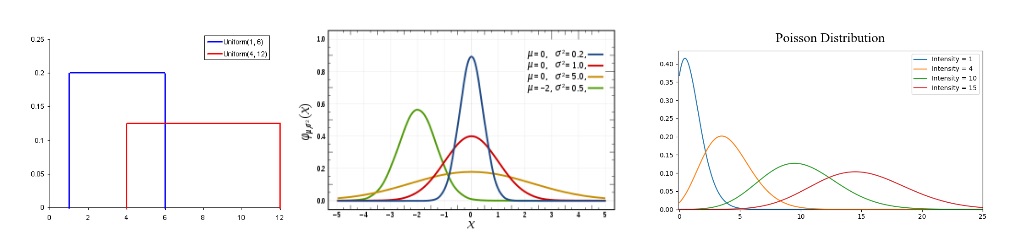
Probability can be defined as the chance that some event will occur. This is commonly quantified in the range of 0 to 1 where 0 means we are certain this will not occur and 1 means we are certain it will occur. A probability distribution is then a function which represents the probabilities of all possible values in the experiment. Check out this beautiful illustration:
-
Uniform Distribution is the most basic probability distribution. It has a single value which only occurs in a certain range while anything outside that range is just 0. It’s very much an “on or off” distribution.
-
Normal Distribution or Gaussian Distribution is defined by its mean and standard deviation. The mean value shifts the distribution spatially and the standard deviation controls the spread. The import distinction from other distributions (e.g poisson) is that the standard deviation is the same in all directions. Thus with a Gaussian distribution we know the average value of our dataset as well as the spread of the data i.e is it spread over a wide range or is it highly concentrated around a few values.
-
Poisson Distribution is similar to the Normal but with an added factor of skewness. With a low value for the skewness, a poisson distribution will have relatively uniform spread in all directions just like the Normal. When the skewness value is high in magnitude then the spread of our data will be different in different directions; in one direction it will be very spread and in the other it will be highly concentrated.
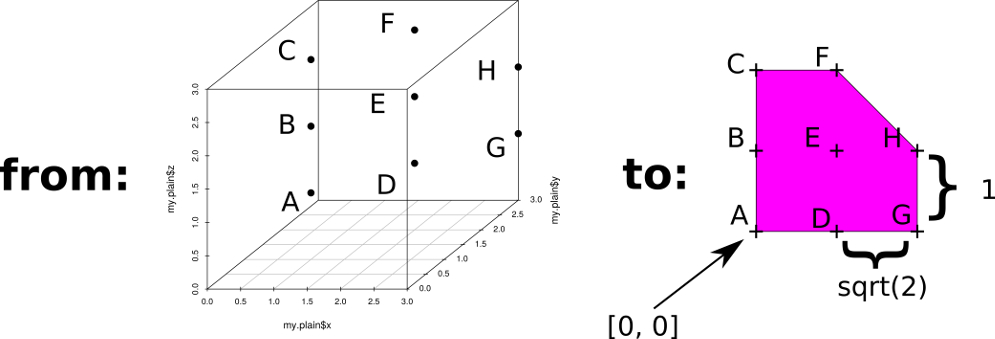
Dimensionality Reduction
Dimensionality reduction refers to the process to reducing the variety of features in consideration. In other sense, we are reducing the size of data or information. Consider the fact that our Universe has 18 dimensions but we observe 3 dimensions in real life.
There are several techniques to perform Dimension Reduction such as:
- Pruning
- Principal Component Analysis
Over and Under Sampling
Over and Under Sampling are techniques used for classification problems to combat the lack of a particular kind of data.
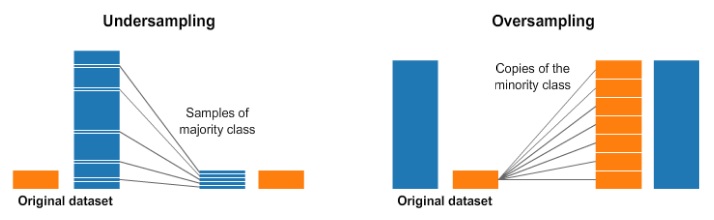
Undersampling means we will select only some of the data from the majority class, only using as many examples as the minority class has. This selection should be done to maintain the probability distribution of the class.
Oversampling means that we will create copies of our minority class in order to have the same number of examples as the majority class has. The copies will be made such that the distribution of the minority class is maintained.