
Open-Source Internship opportunity by OpenGenus for programmers. Apply now.
Reading time: 60 minutes
A 2 dimensional image is one of the most important data that we work on. An image can store information about anything from body organs to earth topology. Applying deep learning concepts on images has proved to be one of the important work which has resulted in early detection of diseases resulting in saving millions of lifes to monitoring activities on the entire Earth.
In this article, we will take a look at the deep learning techniques that can be applied on 2 dimensional images to extract useful information and develop ground breaking applications from face recognition to medical imaging.
1. What is 2-Dimentional image ?
One type of picture you can come across in real life is the two-dimensional one. The two dimensions depicted are length and width and the objects on the picture are flat.
In Computational representation, a two dimensional image can have upto 4 dimension in a array:
- One dimension for the colour depth (value is 3 for RGB)
- One dimension for image length
- One dimension for image width
- One dimension for transparency (optional)
2. How to handle these data ?
There are many libraries in Python to handle 2 dimensional images:
3. How these model work ?
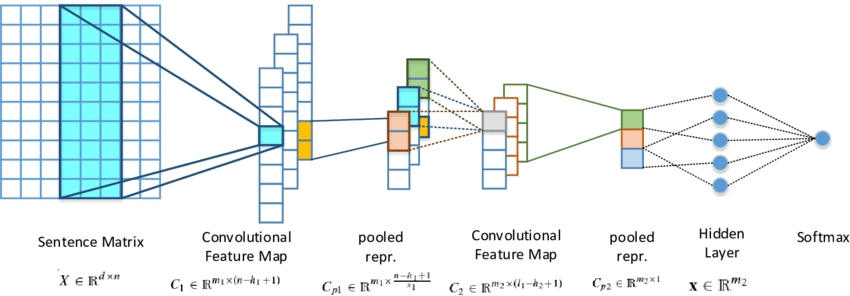
Convolutional Neural Network is a neural network consists of convolutional layer, pooling layer (max pooling or average pooling but max pooling is preferable), fully connected layer and at last a softmax pooling
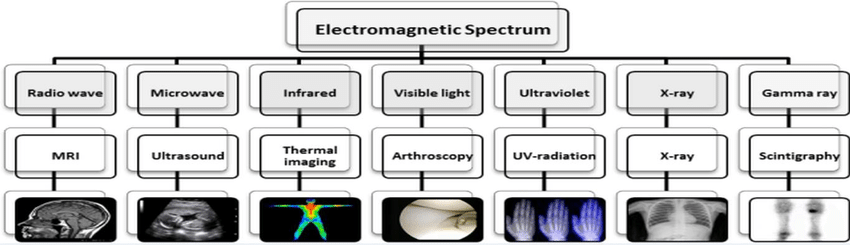
4. Area of application
- Medical problems
- MRI dataset
- CT Scan
- Xray Scans etc.
- InfraRed Images
- Thermal images
- Satellite images
4.1 Medical Problems
4.1.1 MRI/CT-Scan/X-rays dataset
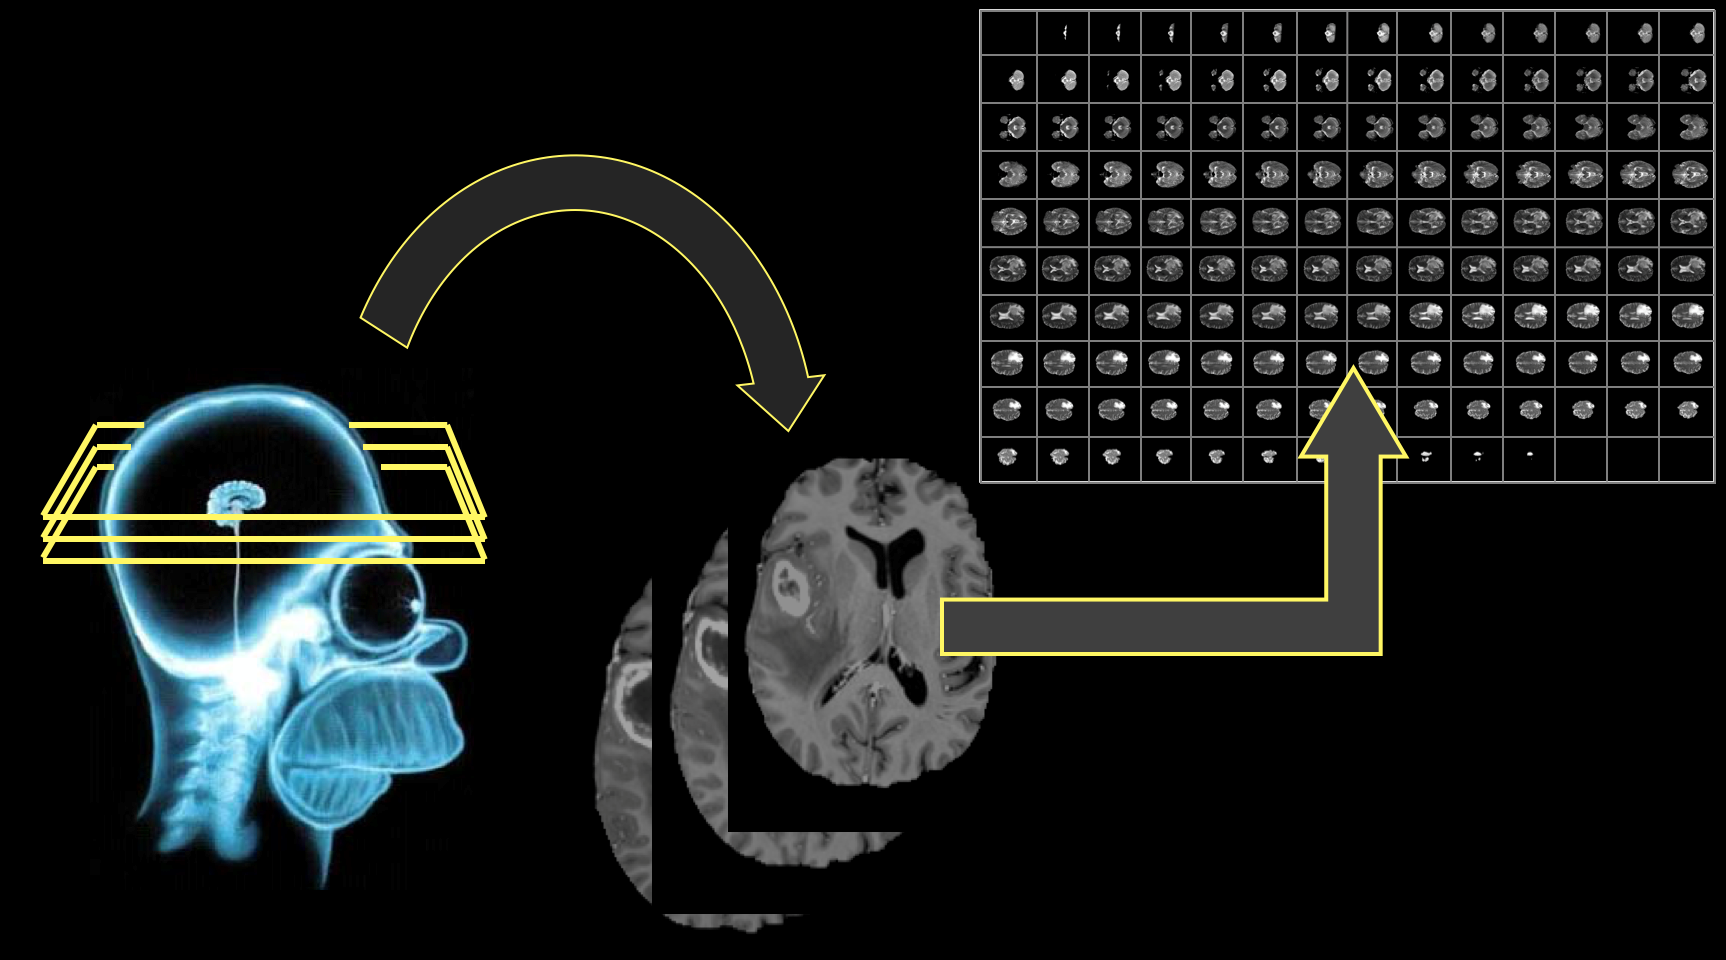
MRI Background
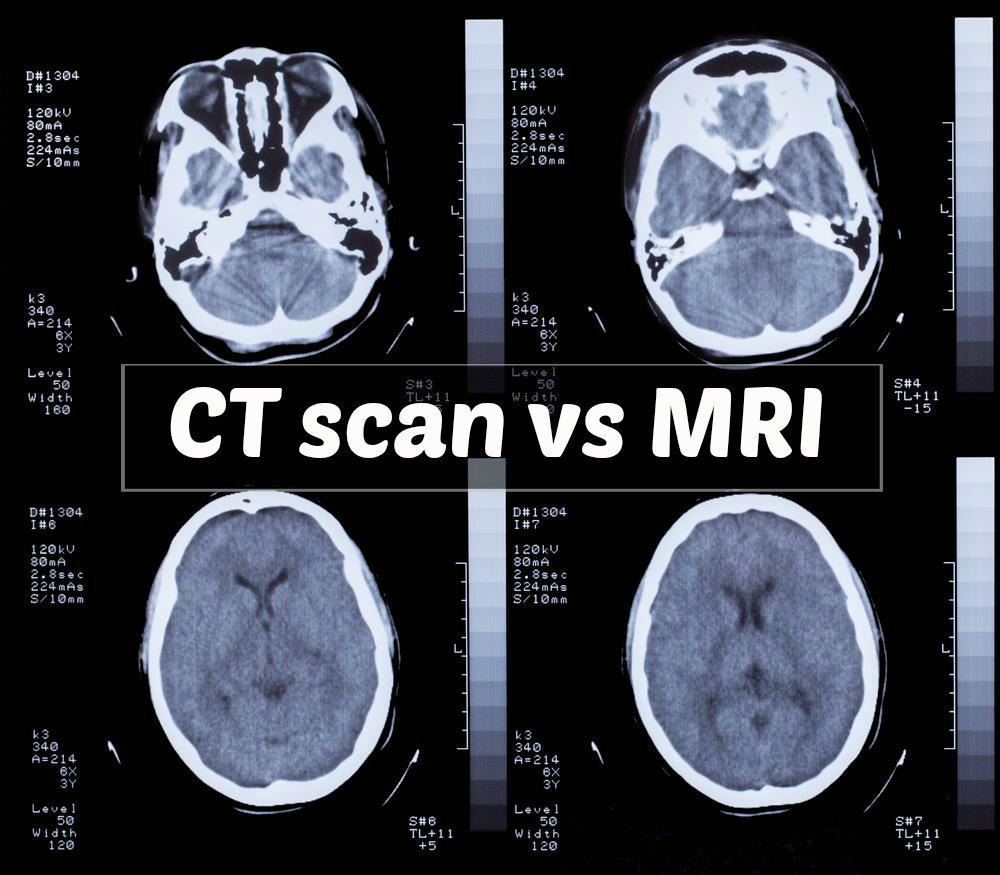
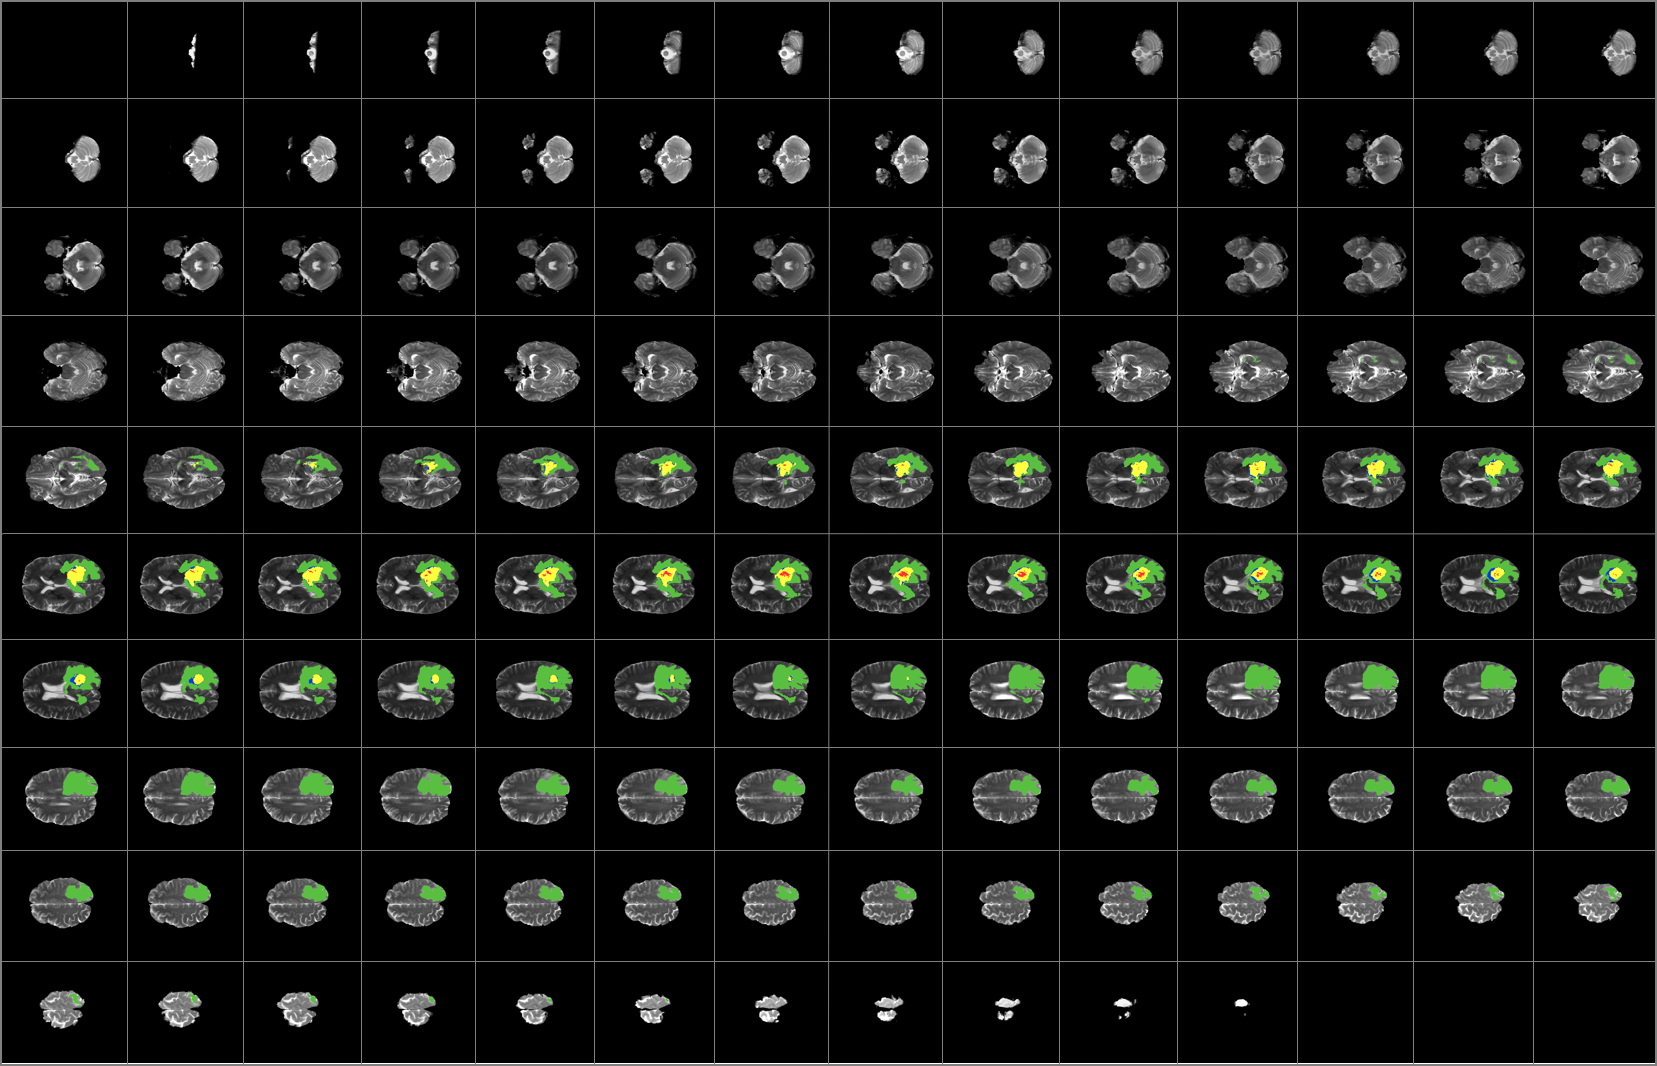
Magnetic Resonance Imaging (MRI) is the most common diagnostic tool brain tumors due primarily to it's noninvasive nature and ability to image diverse tissue types and physiological processes. MRI uses a magnetic gradient and radio frequency pulses to take repetitive axial slices of the brain and construct a 3-dimensional representation. Each brain scan 155 slices, with each pixel representing a 1mm3 voxel.

CT-Scan Background
A computerized tomography scan (CT or CAT scan) uses computers and rotating X-ray machines to create cross-sectional images of the body. These images provide more detailed information than normal X-ray images. They can show the soft tissues, blood vessels, and bones in various parts of the body. (Read more...)
MRI/ CT-Scan/ X-rays pre-processing
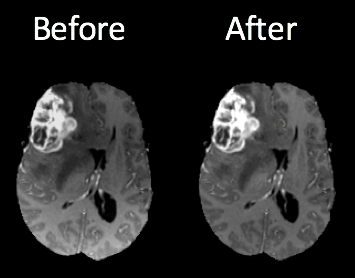
One of the challenges in working with MRI/CT-Scan/X-rays data is dealing with the artifacts produced either by inhomogeneity in the magnetic field or small movements made by the patient during scan time. Oftentimes a bias will be present across the resulting scans, which can effect the segmentation results particularly in the setting of computer-based models.
Dataset
Medical images follow Digital Imaging and Communications (DICOM) as a standard solution for storing and exchanging medical image-data. The first version of this standard was released in 1985. Since then there are several changes made. This standard uses a file format and a communications protocol.
-
File Format — All patient medical images are saved in the DICOM file format. This format has PHI (protected health information) about the patient such as — name, sex, age in addition to other image related data such as equipment used to capture the image and some context to the medical treatment. Medical Imaging Equipments create DICOM files. Doctors use DICOM Viewers, computer software applications that can display DICOM images, read and to diagnose the findings in the images.
-
Communications Protocol — The DICOM communication protocol is used to search for imaging studies in the archive and restore imaging studies to the workstation in order to display it. All medical imaging applications that are connected to the hospital network use the DICOM protocol to exchange information, mainly DICOM images but also patient and procedure information. There are also more advanced network commands that are used to control and follow the treatment, schedule procedures, report statuses and share the workload between doctors and imaging devices.
Data file extensions
- .dcm - handeled by pydicom library
- .nii
- .mnc
- .img and .hdr
Python library that handle these data
- A very popular python package used for analyzing DICOM images is pydicom.
You can easily install pydicom via command prompt
pip install pydicom
- Another library is MedPy.
pip install nibabel pydicom medpy
-
You can find such data from kaggel competion
-
Video tutorial on such data can be found here
4.1.2 InfraRed Image dataset
Infrared Background
In infrared photography, the film or image sensor used is sensitive to infrared light. The part of the spectrum used is referred to as near-infrared to distinguish it from far-infrared, which is the domain of thermal imaging. Wavelengths used for photography range from about 700 nm to about 900 nm. Film is usually sensitive to visible light too, so an infrared-passing filter is used; this lets infrared (IR) light pass through to the camera, but blocks all or most of the visible light spectrum
Libraries for python
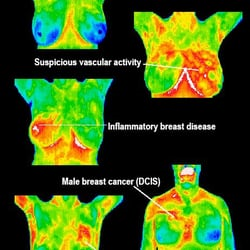
4.2 Thermal Images
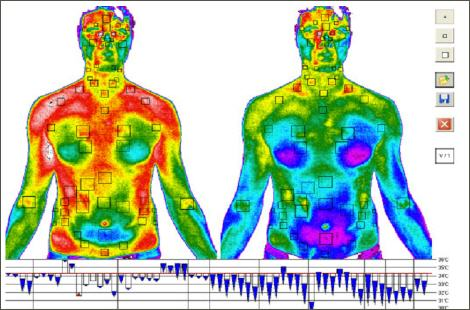
Thermal imaging is a non-destructive, non-contact and rapid system. It reports temperature through measuring infrared radiation emanated by an object/material surface. Automated thermal imaging system involves thermal camera equipped with infrared detectors, signal processing unit and image acquisition system supported by computer. It is elaborated in wide domains applications. Extensive focus is directed to the thermal imaging in the medical domain especially breast cancer detection. This chapter provided the main concept and the different applications of thermal imaging. It explores and analyses several works in the light of studding the thermograph. It is an effective screening tool for breast cancer prediction. Studies justify that thermography can be considered a complementary tool to detect breast diseases. The current chapter reviews many usages and limitations of thermography in biomedical field. Extensive recommendations for future directions are summarized to provide a structured vision of breast thermography.
Thermal imaging background
All materials/ objects that are at temperature above -273 degrees C (0 degrees Kelvin) emanate infrared energy. The emitted infrared (IR) energy from the measured object is converted into an electrical signal by imaging sensor. This imaging sensor is in the camera which connected to computer for displaying on a monitor the converted signal as a color or monochrome thermal image. The IR is a form of electromagnetic radiation that has wavelength band of 0.78 to 1000µm, which are longer than the wavelength of visible light and shorter than the radio waves. Several characteristics of the infrared radiation are similar to visible light, such as: the IR radiation can be refracted, focused, reflected and transmitted. The absorptivity, emissivity, transmissivity, and reflectivity of infrared radiation vary for different objects/ materials. Good absorber objects for the infrared radiation are also good emitters.
Equipment that produces thermal image (Camera)
Thermal imaging refers to improve objects visibility even in a dark environment by recognizing the objects' infrared radiation as well as creating an image based on that information. Since, all objects emit heat (infrared energy) as a function of their temperature. This emitted infrared energy is known as the object‘s heat signature (Gaussorgues,& Chomet, 2012). Generally, the emitted radiation is directly proportional to the object temperature (i.e. the hotter an object is, the more radiation it emits). Therefore, a heat sensor is required to detect tiny differences in temperature. This thermal sensor is essentially a thermal infrared (IR) camera (thermal camera) that collects the infrared radiation on the surface of the objects under investigation and produces an electronic image based on the temperature differences information. Additionally, thermal camera can detect different objects in the same view based on the object's different temperature, which make them appear as distinct objects in a thermal image.
4.3 Satellite Images
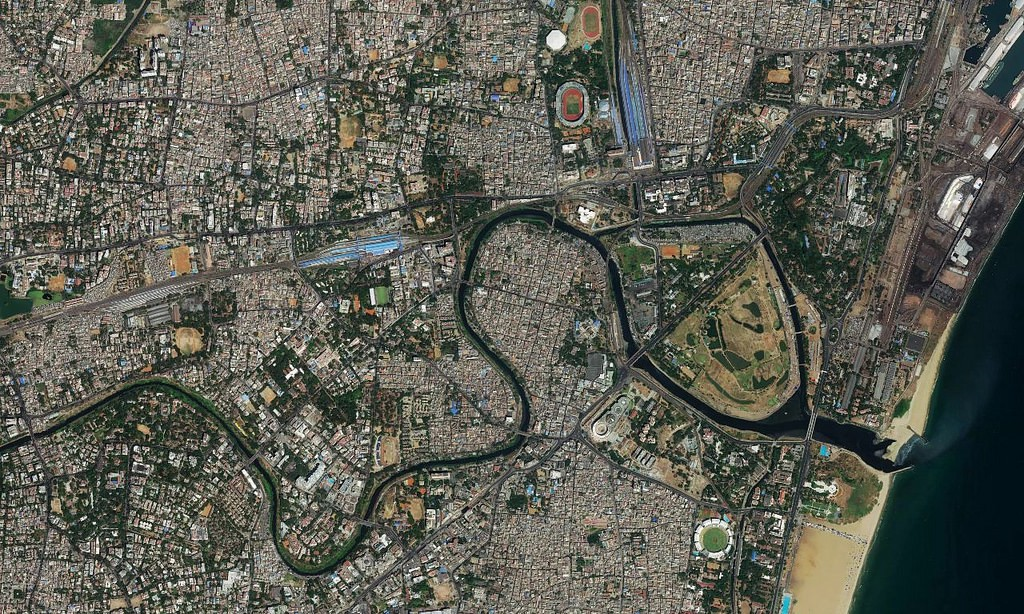
- Satellite imagery are images of Earth or other planets collected by imaging satellites operated by governments and businesses around the world. Satellite imaging companies sell images by licensing them to governments and businesses such as Apple Maps and Google Maps.
- Satellite images are one of the most powerful and important tools used by the meteorologist. They are essentially the eyes in the sky. These images reassure forecasters to the behavior of the atmosphere as they give a clear, concise, and accurate representation of how events are unfolding. Forecasting the weather and conducting research would be extremely difficult without satellites. Data taken at stations around the country is limited in its representations of atmospheric motion. It is still possible to get a good analysis from the data, but because the stations are separated by hundreds of miles significant features can be missed. Satellite images aid in showing what can not be measured or seen. In addition the satellite images are viewed as truth. There is no chance for error. Satellite images provide data that can be interpreted "first-hand".
Libraries of python
-
pip install geoio
Difference between Raster and Vector Images
The difference between Raster Images and Vector Images are:
-
Raster graphics are composed of pixels where as vector graphics are composed of paths
-
A raster graphic, such as a gif or jpeg, is an array of pixels of various colors, which together form an image whereas A vector graphic, such as .svg, .eps file or Adobe Illustrator file, is composed of paths, or lines, that are either straight or curved.
-
Raster graphics become "blocky," since each pixel increases in size as the image is made larger. This is why logos and other designs are typically created in vector format -- the quality will look the same on a business card as it will on a billboard where as The data file for a vector image contains the points where the paths start and end, how much the paths curve, and the colors that either border or fill the paths. Because vector graphics are not made of pixels, the images can be scaled to be very large without losing quality.
5. Geometric, Photometric and Morphological transformations
5.1 Geometric transformation
The functions in this section perform various geometrical transformations of 2D images. They do not change the image content but deform the pixel grid and map this deformed grid to the destination image. In fact, to avoid sampling artifacts, the mapping is done in the reverse order, from destination to the source. That is, for each pixel (x, y) of the destination image, the functions compute coordinates of the corresponding “donor” pixel in the source image and copy the pixel value:
{dst} (x,y)= {src} (f_x(x,y), f_y(x,y))
Library for Such operation
OpenCv can be used for such operations. Common operations available in OpenCV are:
- getAffineTransform
- getPerspectiveTransform
- getRectSubPix
- getRotationMatrix2D
- invertAffineTransform
- LinearPolar
- LogPolar
- remap
- resize
- warpAffine
- warpPerspective
- initUndistortRectifyMap
- getDefaultNewCameraMatrix
- undistortPoints
- undistort