
Open-Source Internship opportunity by OpenGenus for programmers. Apply now.
Reading time: 30 minutes | Coding time: 10 minutes
In Machine Learning and Pattern Recognition, K nearest neighbors (K-NN) is an algorithm which is used for classification and regression and is based on the idea of considering the nearest K data points for calculations.
-
For K-NN classification , the output is the class label. On a new data input it is classified to the class most common among its k nearest neighbors ( K is a integer value). If k = 1, then the data input is simply assigned to the class of that single nearest neighbor.
-
For K-NN regression, the output is the average of the k nearest neighbors.
K-NN is a lazy algorithm as there is no explicit training phase which makes the training stage faster.
Algorithm
- Select a value of K. (K is an integer denoting the number of neighbors to compare)
- Select a distance function for comparison. The functions that can be selected are:
- Euclidian
- Manhattan
- Minkowski
- Hamming (Categorical Variables)
- For a test data point calculate the distance with all the training points by using any of the above mentioned functions.
- Classify the new data point by a majority vote of its K closest (smallest distance) neighbors .
- Compare the label value the true test value.
- Repeat the process for all test data and calculate the error.
- Repeat this with different value of K until the optimal value of K is found which has the least error.
Complexity
The worst case time complexity taken for the above mentioned algorithm is O(N log N) due to the sorting operation for each iteration.
Example of using KNN algorithm
In this demonstration, we will have 100 points belonging to 2 sets. Apart from that, we will have 3 points for which we have to calculate the set it belongs to. We will approach this problem using KNN.
Let's first import important libraries in Python.
import matplotlib.pyplot as plt
from matplotlib import style
style.use('ggplot')
import numpy as np
import random
The 100 data points are generated in random over fixed values
- x1,y1 denote the red data points.
- x2,y2 denote the blue data points.
- xt,yt are the test data points and are unlabeled so they are colored in green.
x1=[]
y1=[]
x2=[]
y2=[]
xt=[33,38,36]
yt=[25,18,32]
for i in range(100):
    x1.append(random.randint(40,70))
    y1.append(random.randint(25,45))
    x2.append(random.randint(0,30))
    y2.append(random.randint(0,20))

plt.scatter(x1,y1,color='r')
plt.scatter(x2,y2,color='c')
plt.scatter(xt,yt,color='g',marker='x')
plt.show()
There are two sets colored red and cyan.
This is the initial data (note the 3 cross green-colored points):
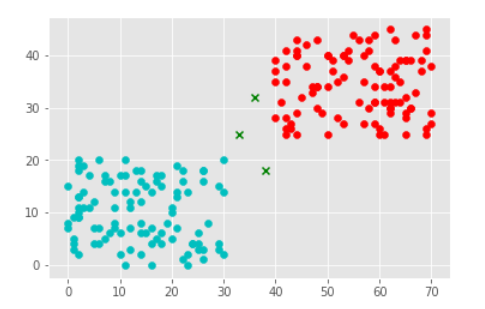
Our objective is to find the class for those crossed green colored data points.
The idea is the for each crossed point, we will find the k nearest neighbors and depending on the class of the majority of the neighbors, we will assign the label. The challenge is to chose the perfect value of K.
For the distance function we will use Euclidian distance formula.
def euclid_distance(a,b):
    return np.linalg.norm(a-b)
Color picker for a given test point.
def pick_K(x1,y1,x2,y2,xt,yt,k):
    red=[]
    blue=[]
    for i in range(100):
        #Finds the Euclidian Distance of test point with each red and blue points.
        red.append(euclid_distance(np.array([xt,yt]),np.array([x1[i],y1[i]])))
        blue.append(euclid_distance(np.array([xt,yt]),np.array([x2[i],y2[i]])))
    red.sort() # Sorts the array in ascending order
    blue.sort()
    red_cal=np.mean(red[:k]) #slices the first K nos and find it's mean
    blue_cal=np.mean(blue[:k])
    if (red_cal<blue_cal): #Compare the distances with red and blue points
        return "r"  #Returns the closest color
    else:
        return "c"
Let's take a look at our results with the values:-
- K = 1
- K = 3
- K = 100 (All the Data Points)
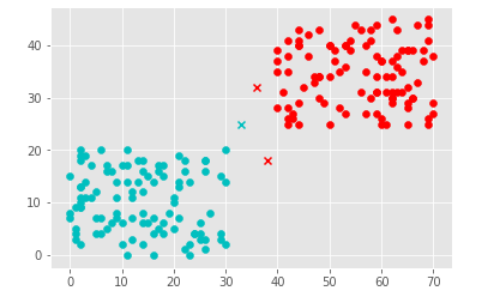
K = 1
k=1
plt.scatter(x1,y1,color='r')
plt.scatter(x2,y2,color='c')
plt.scatter(xt[0],yt[0],color=pick_K(x1,y1,x2,y2,xt[0],yt[0],k),marker='x')
plt.scatter(xt[1],yt[1],color=pick_K(x1,y1,x2,y2,xt[1],yt[1],k),marker='x')
plt.scatter(xt[2],yt[2],color=pick_K(x1,y1,x2,y2,xt[2],yt[2],k),marker='x')
plt.show()
Following is the output (note two points go to red class and one point go to cyan class):
K = 3
The code remains same only the K value is changed to 3.
Following is the output (note two points go to red class and one point go to cyan class):
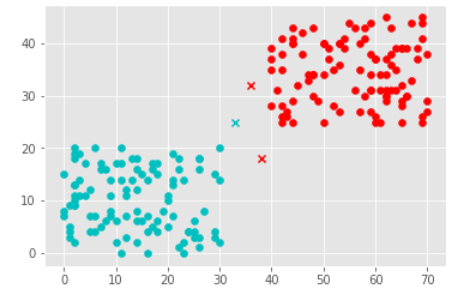
This is same as K=1.
K = 100
The code remains same only the K value is changed to 100(All the Data Points).
Following is the output (note all three points go to red class):
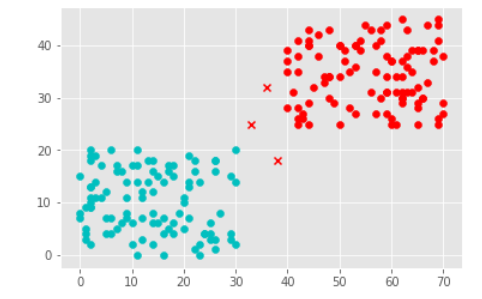
Note that the results remained same for K=1 and K=3 but changed completely for K=100. The correct value for K will depend on the problem at hand and its applications.
Applications
- Recommender Systems: If you know a user likes a particular item, then you can recommend similar items for them. To find similar items, you compare the set of users who like each item. if a similar set of users like two different items, then the items themselves are probably similar!
- Feature extraction in Computer Vision.
- In Political Science, Voting System like a person will vote or not!
- Outlier detection.
- Searching for semantically similar documents.