How is Clustering used in Data Science?
In this article, we will see how clustering is used in Data Science.
Table of contents
- What is clustering?
- Uses of clustering
What is clustering?
Clustering is a technique used to identify groups of similar samples in a dataset with two or more variable quantities. The grouping is done such that there is a high similarity between members of the same cluster and lesser similarities between members of two different clusters. This is also known as clustering analysis and comes under the unsupervised machine learning techniques. It uses criteria such as distances between data points, density of data points or other statistical distributions to group them into various clusters. Given below is an example of clustering.
Uses of clustering
Broadly, clustering methods are divided into two: Hard (where data points strictly belong to one group) and soft (where data points may belong to one or more groups) clustering. But, there are various approaches to clustering that exist like partitioning clustering, hierarchical clustering, density-based clustering and many more. While working with large, unstructured datasets, clustering makes it easier for us to understand data and manipulate them. Even when we are working with structured and labeled dataset, sometimes our dataset might not offer us the depth we need. Here, clustering helps to answer some key questions about the dataset we are working with.
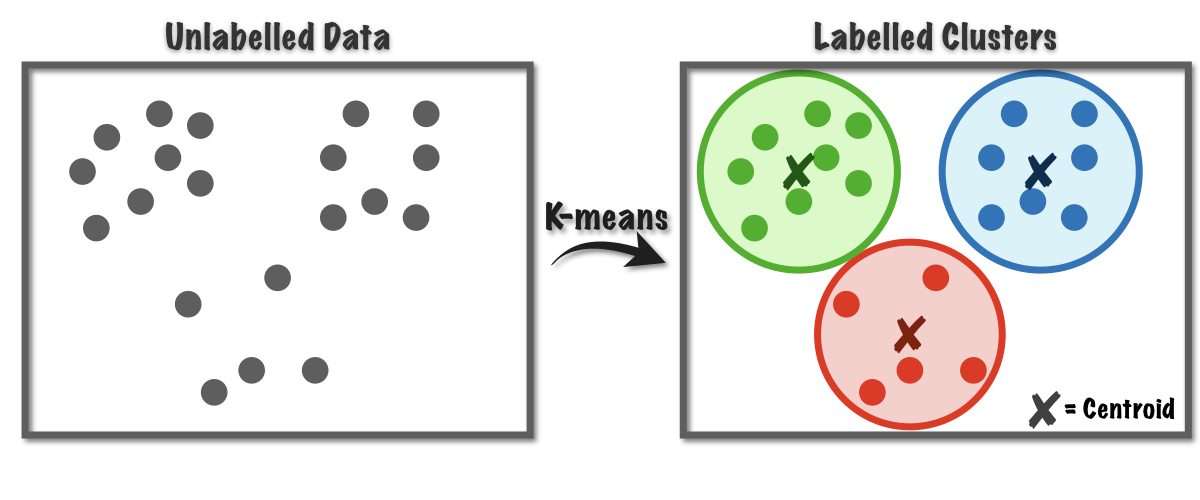
K-Means Clustering is one of the most popular clustering algorithms used while working with unlabeled data. Here, the algorithm groups data into K clusters where the value K is pre-defined. This comes under partitioning clustering. In real world, this is used for customer and market segmentation. It is used to segment customers based on their interests and purchase history so that appropriate groups can be targeted for campaigns of specific products.
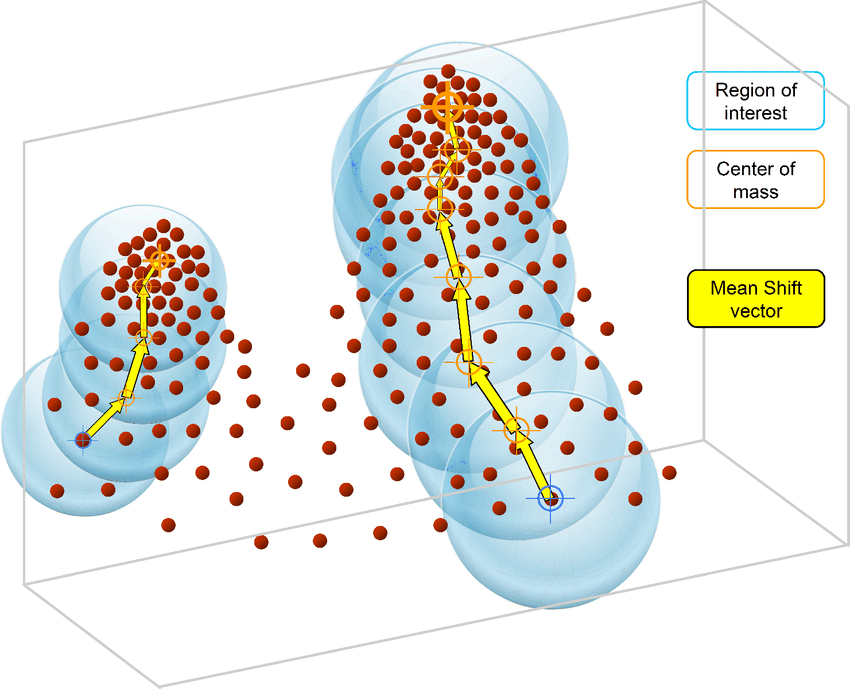
Mean-shift algorithm is the one that used for cluster analysis in image processing and computer vision. It assigns clusters to different data points by iteratively shifting it towards the cluster centroid. It is widely used in image segmentation and analyzing real-world data as it does not need the number of clusters or their shapes to be pre-defined. Given below is an example portraying mean-shift algorithm's working.
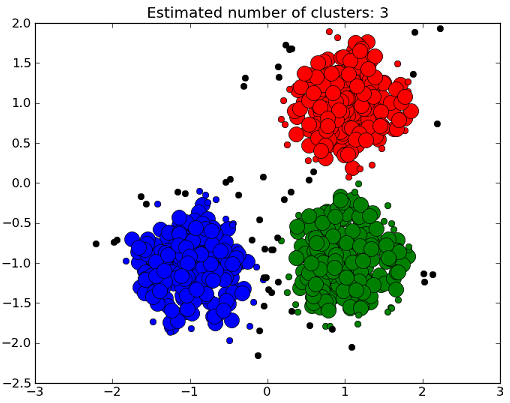
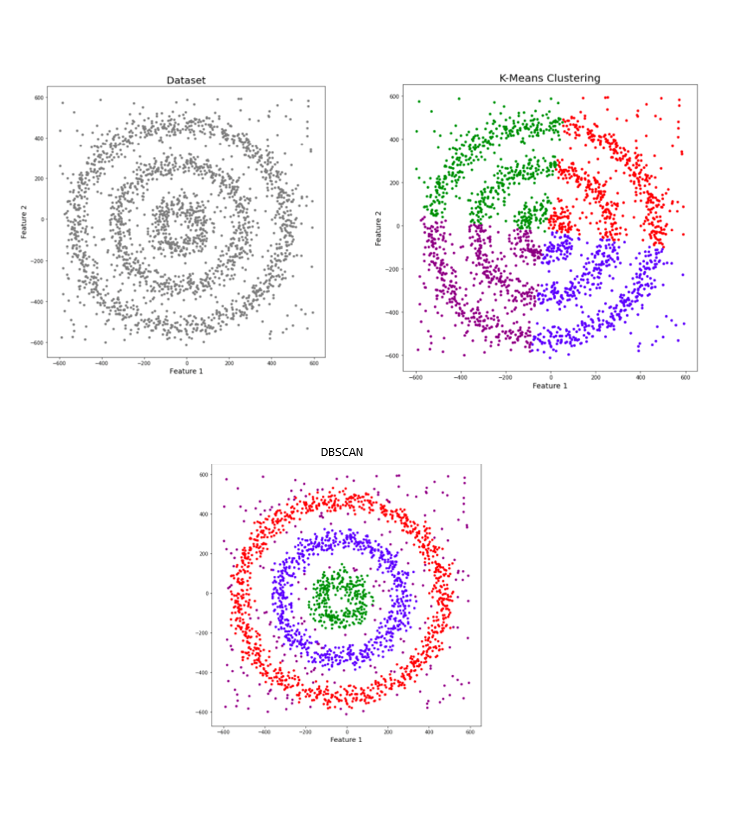
Density-Based Spatial Clustering of
Applications with Noise (DBSCAN) algorithm is used when our data contains outliers and irregularities. Algorithms like K-means are severely affected by noise in datasets and are suited only for finding well-separated clusters. DBSCAN algorithm, on the other hand can be used when we are dealing with datasets that contain arbitrary shaped or non-convex clusters. In the example given below, we see that our initial dataset contains noise and can see how efficiently it can be grouped into clusters using DBSCAN rather than K-means algorithm.
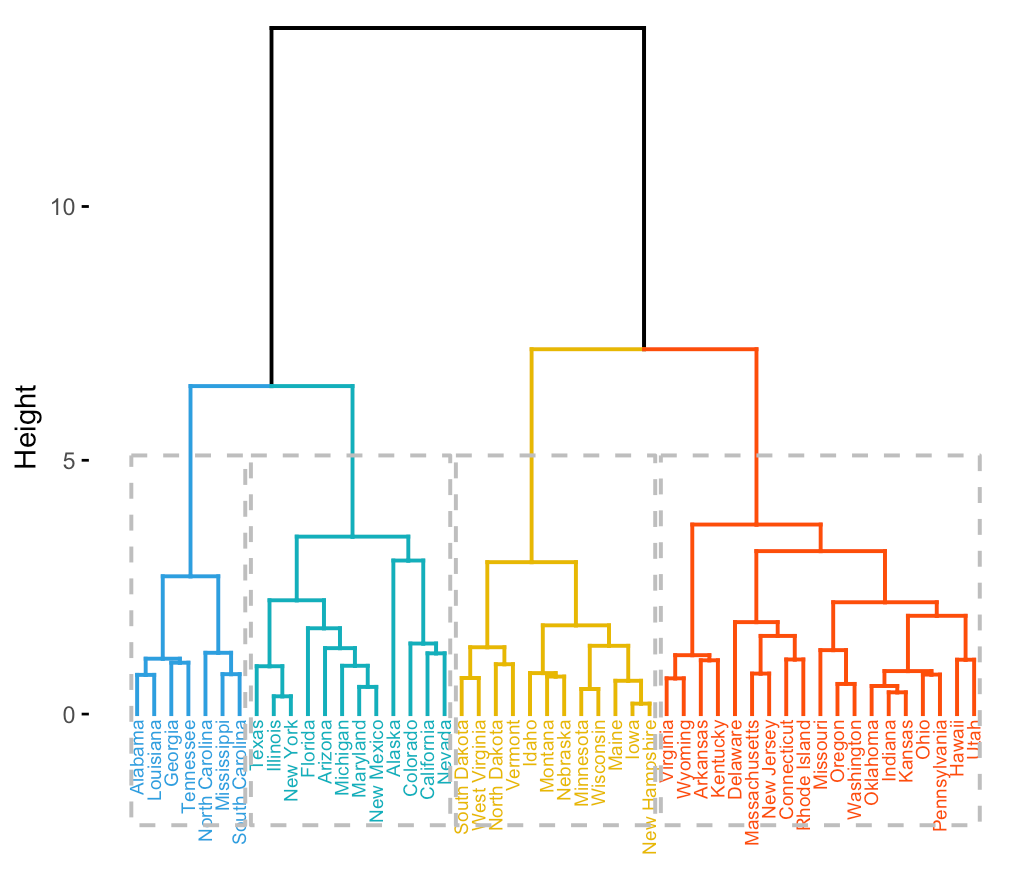
Agglomerative hierarchical clustering is a type of hierarchical clustering algorithms that initially treats every data point as a single cluster and successively groups of clusters are merged together until we have a single big cluster that has all the data points. This presents results in a tree like structure known as a dendrogram. This method is widely used to analyze social network data and also in gene expression data analysis. For example, it can be used for identifying clusters of actors in a social system on the basis of their social ties. An example of a dendrogram is given below.