How is Regression used in Data Science?

In this article, we will see how regression is used in Data Science.
Table of contents
- What is regression?
- Uses of regression
What is regression?
Regression is a statistical method used in various fields to find out how strong the relationship between a dependent variable and one or more independent variable is. The dependent variable is usually denoted by "Y". Through regression analysis, we get to know how much impact each factor has on the final output, the factors we need to keep and can ignore, the certainty of the factors and the presence or absence of multicollinearity. A regression line is a line that best fits the trend of a given dataset.
Uses of regression
In data science, regression often refers to getting an estimate of a dependent variable that is continuous based on the inputs given. When a machine learning problem deal with continuous numbers, regression becomes important. It is used in prediction or forecasting and also to deduce relationships between variables. There are several types of regression that is used in data science and machine learning. They are:
- Linear regression
- Lasso regression
- Ridge regression
- Polynomial regression
- Support vector regression
- Decision tree regression
- Random Forest Regression
- Logistic regression
Now we will see the use cases of some of these regression techniques in data science.
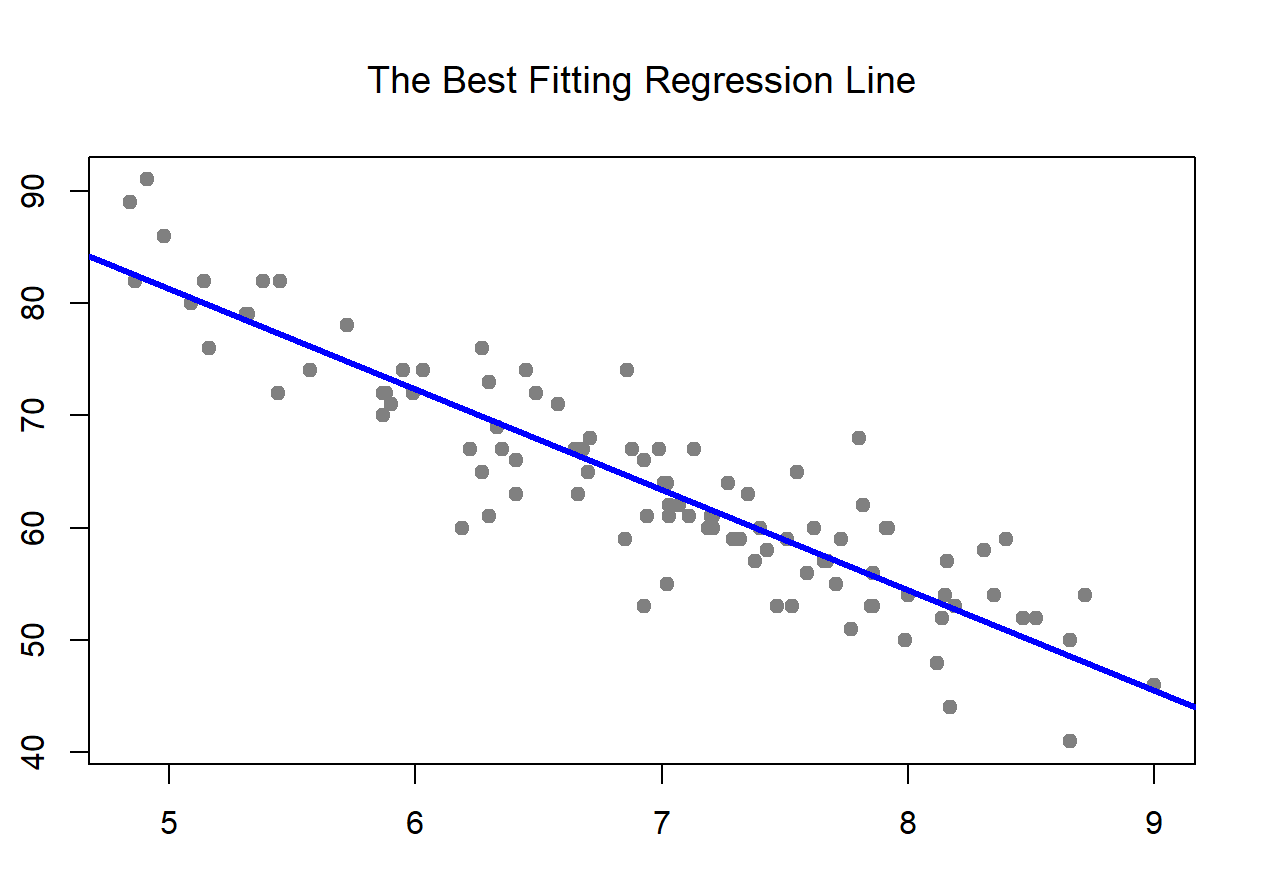
Simple linear regression is used to predict relationship between two continuous variables. For example, suppose in our problem, weight of a person only depends on their height, we can use linear regression to quantify the relationship between them and find that when weight is plotted as a function of height, we get a linear best fit line as given below.

Real world applications of linear regression are many! It is used by businesses to understand the relationship between the amount spent on advertising and their revenue. It is used by nutritionists and sports professionals to analyze the effect of different diet and workout regimen on players, by medical professionals to identify relationship between drug dosage and blood pressure, to find the impact of rainfall amount on number fruits yielded, etc.
Linear models might not necessarily be best models when we are dealing with unseen data. When we have underlying patterns in our data, we use ridge or lasso regression as it avoids overfitting and handles model complexity. Ridge regression is used for analyzing prostrate-specific antigen among people who are about to have their prostates removed and estimating bare land values in forestry, where as lasso regression is heavily used in the financial sector for building models in applied stress tests.
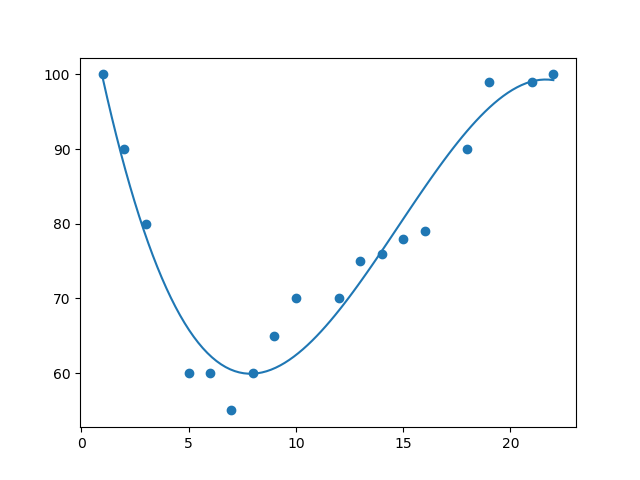
Polynomial regression is used when linear regression fails to capture the trend of our data i.e when we have non-linear data. In the below image, we can find that the relationship between the two involved variables can be best described by the equation of a curve rather than a straight line. This is widely used to predict the rate of spread of infectious diseases, to study the isotopes of sediments and the generation of a synthesis in chemical experiments as we have no linear relationship between variables in these cases.
We can use decision tree regression when we have complex relationships between the independent variables, if we have missing variables, when there is a huge difference in their scales or if we have a mix of numerical and categorical variables. Here, the model learns by splitting the training data into subsets in such a way that the sum of square of residuals are minimized. One example problem includes predicting the revenue of an ice cream shop on a given day based on temperature on that day.
Random forest regression uses a collection of decision trees to introduce randomness. This is used when we want our decision tree implementation to not overfit and generalize well over other datasets. This is used to predict loss or profit estimates while purchasing a particular stock, bitcoin price detection and also for product price optimization in the e-commerce sector.
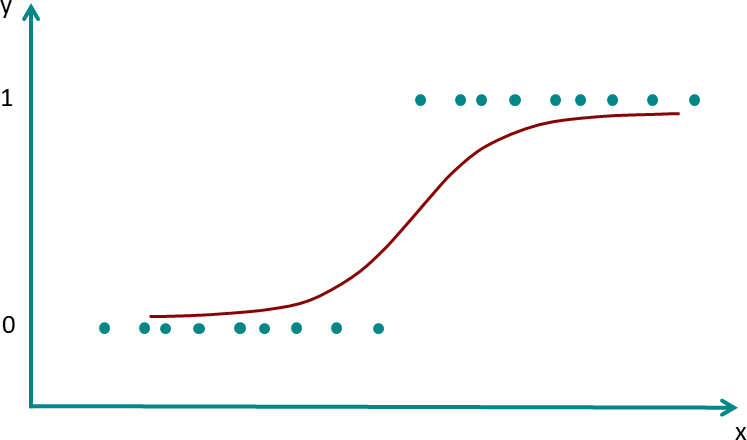
Even though it has the word 'regression', Logistic regression is used more for classification purposes. It is used when we have a categorical dependent variable and it uses a logistic function like sigmoid or logit functions at its heart. Given below is an example of logistic regression.