Predicting Air Pollution Levels in New Delhi (Part Two)

This is part two of a three-part series about how I applied Machine Learning to predict pollution levels in New Delhi. Part One introduces the problem, some solutions, and how prediction can help. Part Two focusses on the data we require, and involves initial analysis. In the final part, we go over the implementation of the machine learning model.
We are going to predict PM 2.5 levels in New Delhi. For any prediction, we require lots of historical data. To apply supervised machine learning models, we always want to work with structured and labelled data.
One of the reasons for choosing PM 2.5 as our metric for air pollution was the clear relationship with the Air Quality Index. According to the US definition, the AQI is a yardstick that runs from 0 to 500. The higher the AQI value, the greater the level of air pollution and the greater the health concern. There are 6 categories in this index, each with a different colour representing the threat level, and the consequences. Here is the breakdown shown below:
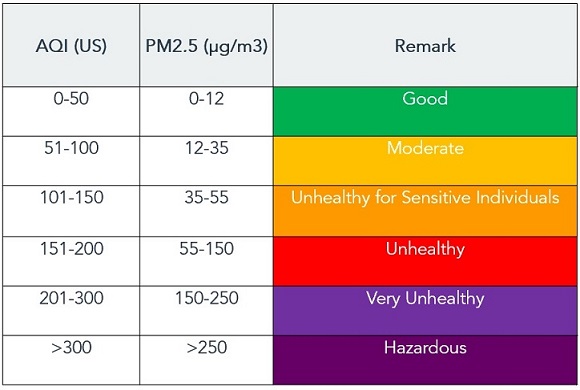
Using this we will be able to use our prediction model to also indicate what level of quality the air pollution in the city is at, and display the consequences and risk reduction measures.
The Pollution Data
As discussed, we are going to predict PM 2.5 levels in the city of New Delhi, and then use them to output the equivalent AQI value. For this, we needed a reliable dataset of PM 2.5 levels going back at least a few years. After some digging, I came across a Kaggle dataset (linked in references below) with Air Quality Data going back across 5 years. This dataset is made from publicly available records kept by the Central Pollution Control Board.
This dataset had the hourly readings of various pollutants, such as PM 2.5, for the numerous weather stations across the country, and it went back 5 years to 2015. There are other datasets for PM 2.5 and pollution data available, such as archive data that the US Embassy in New Delhi collects, however no other sources seemed to be as comprehensive as this. Other sources kept only daily or monthly records.
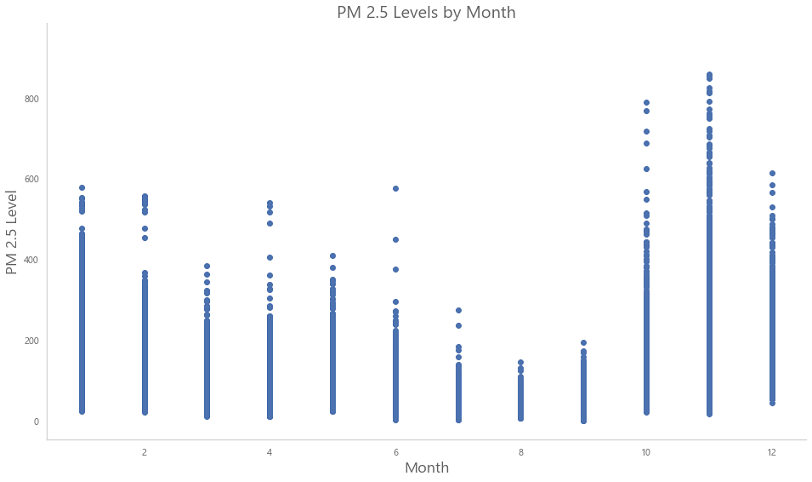
Looking at the average monthly PM 2.5 levels, we can see that the winter months in Delhi really do see a sharp rise in pollution, especially around November. This is in tune with the experience of Delhi residents.
The next big question left to ask is, what do we predict air pollution levels with? What are the factors contributing to air pollution? There are various - from the number of vehicles on the road, to the time of day. Accurate air pollution prediction for an entire city is also not possible - especially for large cities like New Delhi. Each region of a city can have different conditions leading to different air qualtiy values. While there are many dynamic factors that are co-related to the air quality of a region, few of them are easily and consistently available in the form of data.
However, the most important factor when it comes to New Delhi's air pollution seems to be its geography, and the weather that comes with it. In the winter months, the winds over the region stagnate, and this sort of creates a gas-chamber effect where the toxic fumes from cars and factories keep swirling above and around the city with no where else to go. Again, as a Delhiite, one nows that the best days are days in the monsoon months, as the rain clears the skies and air quality improves significantly.
Clearly, we needed weather (or to be more scientific, meteorological) data for New Delhi that went back to 2015.
The Weather Data
It took signifcant digging to find weather data that would be suitable for my project. There are numerous weather stations across India, and for New Delhi I decided to use the records maintained by the Safdarjung Weather Station. There are other stations such as one in the Indira Gandhi International Airport, but I wanted one in the actual city, not the outskirts.
One free source I found was National Oceanic and Atmospheric Administration (NOAA), which collects data from thousands of weather stations around the world. However, I found this dataset to have large amounts of missing data for New Delhi, which would hamper my project. I finally came across the Reliable Prognosis Weather Archive (see references) that had years and years of meteorological data for different weather stations, including the one in Safdarjung.
This dataset was synoptic (three-hourly), so I later had to convert my pollution data to match with the three-hour intervals that the meteorological data was being recorded at. This was also a comprehensive dataset, consisting of various meteorological attributes such as wind speeds, types of cloud formations, dry bulb temprature, apart from humidity and temperature.
From these various factors I would have to select a few that had a clear correlation with air quality. For that I also had to understand the meanings of some of these indicators.
Ultimately, after cleaning and combining both weather and air quality data, I had a final dataset with over 15,000 rows of information! Cleaning the dataset involved removing outliers (such as PM 2.5 levels that went above 500, as this is not a valid reading), and deciding what to do with empty or missing values. This is discussed further in the final part of this series, the implementation.
Initial Analysis
The following determinations can be made after exploratory data analysis -
-
From the graphs we can observe that in the winter months of October, November and December the PM 2.5 levels reach their highest levels. This makes Month a good predictor.
-
While winter months have the worst pollution levels, some summer months have average levels in the unhealthy range.
-
The time of day has a some impact as well, but day of the week is not as significant. We shall use time of the day (aka hour) as a predictor.
-
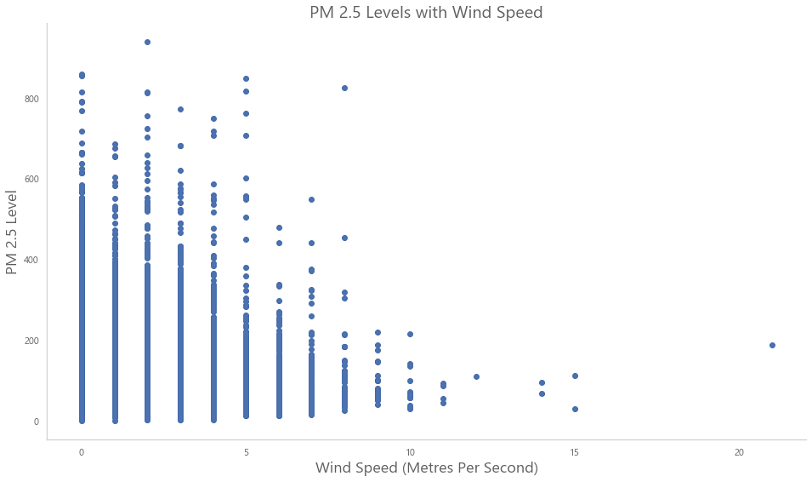
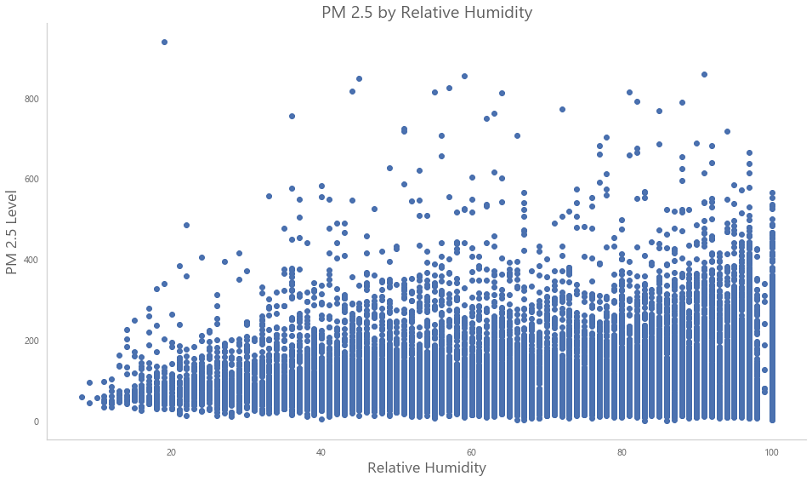
With higher wind speeds the PM 2.5 levels decrease. Cannot tell for Relative Humidity (dew point) as it fluctuates.
Some of these visualizations below lead us to these inital determinations.
PM 2.5 and Wind Speed
We can clearly see the negative correlation between PM 2.5 and wind speed.
PM 2.5 and Relative Humidity
Here is the graph of PM 2.5 level versus Relative Humidity. Humiidity is generally higher when it has rained, so it is an important feature.
Correlation Matrix
Instead of individually comparing, we can create what is known as a correlation matrix, a heatmap that tells us which features are correlated (the darker the heatmap colour, the more the correlation).
Here is the correlation matrix for our dataset -
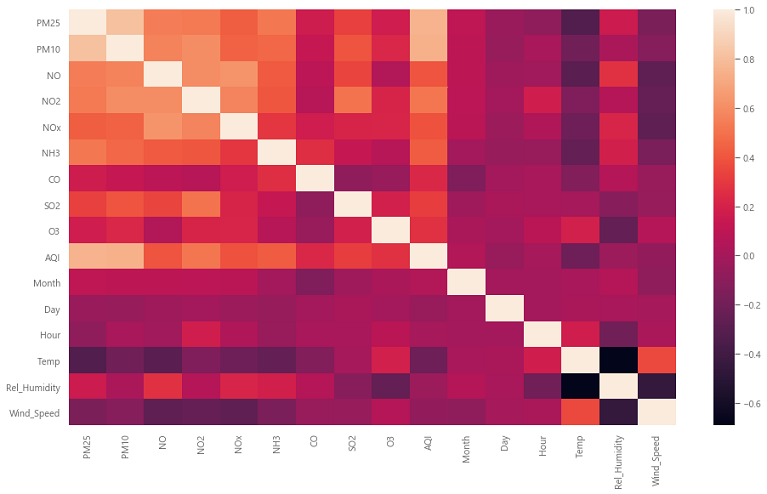
Based on this matrix, I decided to go with the following 5 features as PM 2.5 predictors:
- Month
- Hour
- Temperature
- Wind Speed
- Relative Humidity
Coming Up
This was part 2 in a 3 part series on predicting air pollution in the capital of India, New Delhi. We discussed the data that was required for this project, the attributes that were selected as good indicators of pollution, and did some initial analysis to arrive at this stage. In the final part, we will focus on the machine learning model I have built, aka the implementation. Stay tuned!
Further Reading and Resources
Link to Part 3 of this series - The Machine Learning ModelAir Quality Data in India - Kaggle
Realiable Prognosis Weather Archive
NOAA Global Weather Datasets
Air Quality, US Embassy in New Delhi