
Open-Source Internship opportunity by OpenGenus for programmers. Apply now.
Reading time: 20 minutes
Introduction
If you have worked on a Deep Learning model, you probably already know what TensorFlow is. It is an Open Source python library and is used for numerical computation and large-scale machine learning. TensorFlow bundles together a slew of machine learning and deep learning (or neural networking) models and algorithms and makes them useful by way of a common metaphor. It uses Python to provide a convenient front-end API for building applications with the framework, while executing those applications in high-performance C++.
TensorFlow can train and run deep neural networks for handwritten digit classification, image recognition, word embeddings, recurrent neural networks, sequence-to-sequence models for machine translation, natural language processing, and PDE (partial differential equation) based simulations. Best of all, TensorFlow supports production prediction at scale, with the same models used for training.
TensorFlow works on variant of a multi-dimension array which is known as tensors. Before we see how graphs are used in TensorFlow, let's see how this library got its name....
What are Tensors?
Well, its easier to say that tensors are multi-dimensional arrays but they are not the same thing. Multi-dimensional arrays are a easy way to represent or write tensors. On the other hand, Tensors are used to represent a physical quantity and are very powerful tools for Mathematics and Physics.
As per definition:-
Tensors are geometric objects that describe linear relations between geometric vectors, scalars, and other tensors. Elementary examples of such relations include the dot product, the cross product, and linear maps. Geometric vectors, often used in physics and engineering applications, and scalars themselves are also tensors.
See, order of tensors define: how many basis unit components are being used to define/represent a physical quantity. So, scalars are zero-order tensors as no directional component, vectors are one-order tensors as one directional or unit component is used to define them and so on...
If you are still not clear about what tensors really are, you can see this video. It beautifully explains the concept of tensors.
Now that we know what tensors are, we are ready to breakdown how TensorFlow uses tensors and Graphs to provide such a seamless Machine Learning framework.
How TensorFlow uses Graph concepts?
TensorFlow allows developers to create dataflow graphs
Dataflow graphs are structures that describe how data moves through a graph, or a series of processing nodes. Each node in the graph represents a mathematical operation, and each connection or edge between nodes is a multidimensional data array, or tensor.
These dataflow graphs or computational graphs contain nodes where tensors are processed/calculated using the defined function which are operated in series as we move forward in graph. For example, there is a function f(x, y) = x^2 * y + y + 2 then TensorFlow graph will look something like this:
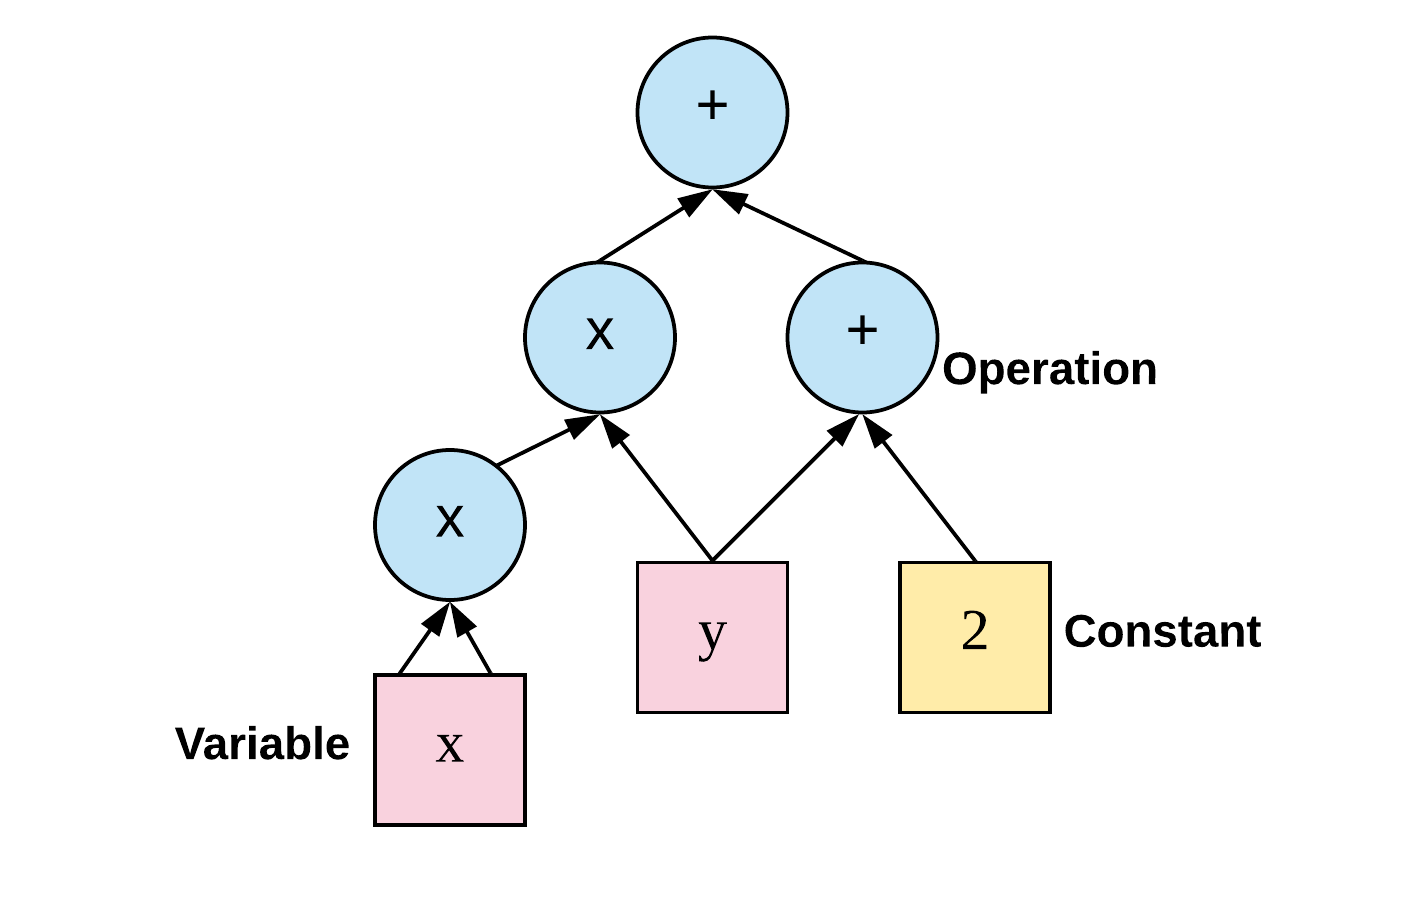
In the figure above, we can see how for a particular function we can make a dataflow/computational graph and apply our inputs to get the results. Each node has its own pre-defined function and input are given to them. After function is applied on corresponding input we get output which are further used in the graph. Its just that our inputs and outputs from each corresponding nodes are tensors.
These graphs become bigger and bigger as function gets more complex or more computation is needed. There are several models already written in the library which can be directly used as we fit. But all these models are just lines of code, like all variables and lines of code they need to be put in memory to actually get some processing done. So, having a graph or model isn't enough we need something else with it. For this session are used. Sessions are used to initialize our graph or model and pass input into it. Session is what puts our model into memory and get the work done.
There are a lot of other details but this is a very brief description of how TensorFlow uses graph data structure to provide one of the best in industry framework and why it is a preferred library for machine learning projects. As an added bonus its Open Source, so you or anyone else contribute to it and it is made improved further and further by professionals and expert people all around the globe.
Applications and Optimizations
There are various other applications and optimizations which use graph for their working. The main purpose behind these applications is speed-up and simplification of models. Some of the other applications and optimizations of graphs are as follows :-
Feature Engineering
- Feature Engineering - Perhaps the biggest differentiator of the proper application of knowledge graphs for data preparation is the acceleration -- and automation -- of feature engineering. Feature engineering is the process whereby data scientists identify the relevant data attributes that predict the desired outcome of machine learning models; it's essential for model accuracy. Oftentimes, there's a direct correlation between time-consuming data preparation and inefficient feature engineering that slows the production of machine learning models.
Graphs can expedite feature engineering and feature selection partly because of automatic query generation and transformation capabilities. Accelerating this part of engineering machine learning models allows for increased numbers of features, which positively impacts model accuracy. By assisting data scientists and engineers with the transformations necessary for feature engineering, graphs shorten the process from days and weeks to hours.
Traceability
- Traceability - Traceability, also known as data lineage or data provenance, is pivotal for ensuring production-level accuracy and consistency commensurate with that of the training period for machine learning models. Models are trained with specific input data that delivers equally specific outputs. As such, most initial models are brittle and require data as similar as possible to that used during their training. The provenance of graph databases illustrates the flow of data used to train models. This lineage provides a road map for recreating data's journey once models are put into production. Traceability shows how to reconstruct the data flow to leverage models without having to rebuild or substantially tweak them.
When building a machine learning model to predict patient outcomes for a specific medication or prescription, for example, a host of information about that specific patient -- potentially contained in scores of tables and documents -- must be encapsulated within that model. Provenance demonstrates just how it was captured and what processes took place, which is invaluable when operationalizing models.
Decision Tree Pruning
- Decision Tree Pruning - In machine learning and data mining, pruning is a technique associated with decision trees. Pruning reduces the size of decision trees by removing parts of the tree that do not provide power to classify instances. Decision trees are the most susceptible out of all the machine learning algorithms to overfitting. Pruning reduces the complexity of the final classifier, and hence improves predictive accuracy by the reduction of overfitting.
A tree that is too large risks overfitting the training data and poorly generalizing to new samples. A small tree might not capture important structural information about the sample space. However, it is hard to tell when a tree algorithm should stop because it is impossible to tell if the addition of a single extra node will dramatically decrease error. This problem is known as the horizon effect. A common strategy is to grow the tree until each node contains a small number of instances then use pruning to remove nodes that do not provide additional information.
Pruning should reduce the size of a learning tree without reducing predictive accuracy as measured by a cross-validation set. There are many techniques for tree pruning that differ in the measurement that is used to optimize performance.
Several other optimizations and applications like:
- Layer fusion
- Parallelizations
which use graph in Machine Learning models. Several models exist and several new ones are made every year. And almost all of them have graph implementations in them in one way or the other.