Open-Source Internship opportunity by OpenGenus for programmers. Apply now.
Reading time: 35 minutes
In case you haven't read about the K Means Algorithm yet, it is highly recommended to first go through it, in order to understand best, how K+ means works.
K-means is one of the most popular and simplest unsupervised learning algorithms
that solve the well-known clustering problem. The procedure follows a simple and easy way to classify a given data set to a predefined, say K number of clusters.
However, a major drawback of K Means is, that we need to determine the optimal values of K, and this is a very difficult job. Prior to solving the problem, it is difficult to know which value of K would do best for our particular problem.
To overcome this difficult problem, we use the K+ Means algorithm, which incorporates a method to calculate a good value of K for our problems. K+ Means algorithm builds onto K Means algorithm, and is an enhancement to it.
K+ Means is also great at detecting outliers, and forming new clusters for them. Therefore, K+ Means is not sensitive to outliers, unlike the K Means algorithm.
The K+ Means algorithm
STEP 1: Find K clusters using the K-Means algorithm
STEP 2: For each of the clusters, calculate MIN, AVG and MAX intra cluster dissimilarity
STEP 3: If, for any cluster, AVG value is greater than others, then MIN and MAX values are checked. If the MAX value is higher too, we assign the corresponding data point as a new cluster and go back to step 1, with K+1 clusters.
STEP 4: Repeat STEPS 1 to 3 until no new clusters are formed.
What is intra-cluster dissimilarity?
Intra-cluster dissimilarity, or intra-cluster distance, is a metric to find the distances of each data point from the centroid of the cluster, in order to detect outliers.
MIN: Related to point closest to centroid
MAX: Related to point furthest away from centroid (potential outlier)
AVG: Average of distances of all points with centroid respectively.
All distances will be calculated as Euclidean distances
Example
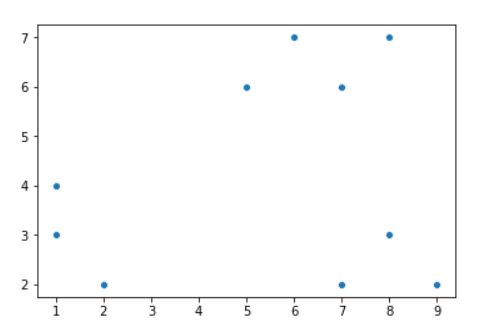
Let's assume 10 input data points, with points labeled from P1 to P10. We will apply our K+ means algorithm on this input data, in order to understand the algorithm better:
| Point | X | Y |
|---|---|---|
| P1 | 1 | 4 |
| P2 | 1 | 3 |
| P3 | 2 | 2 |
| P4 | 7 | 2 |
| P5 | 8 | 3 |
| P6 | 9 | 2 |
| P7 | 5 | 6 |
| P8 | 6 | 7 |
| P9 | 7 | 6 |
| P10 | 8 | 7 |
Here's how a scatter plot of our input data looks:
We will assume K=2 for this example.
Our initial centroids will be P1 and P5
STEP 1: Find K clusters using the K means algorithm.
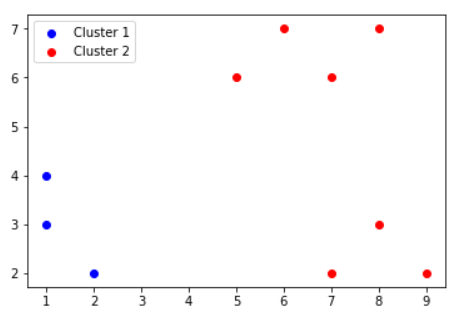
We will initially run K-means algorithm, to get the following as the 2 clusters:
| Clusters | Points |
|---|---|
| Cluster1 | {P1,P2,P3} |
| Cluster2 | {P4,P5,P6,P7,P8,P9,P10} |
STEP 2: For each of the clusters, calculate MIN, AVG and MAX intra cluster dissimilarity.
Cluster 1:
For finding intra-cluster distances, we first will need to find the centroid G1.
G1 = ( 1.33 , 3 )
| Point | X | Y | Distance from G1 |
|---|---|---|---|
| P1 | 1 | 4 | 1.05 |
| P2 | 1 | 3 | 0.33 |
| P3 | 2 | 2 | 1.20 |
Hence,
MIN = 0.33
MAX = 1.20
AVG = 0.86
Cluster 2:
For finding intra-cluster distances, we first will need to find the centroid G2.
G2 = ( 7.14 , 4.71 )
| Point | X | Y | Distance from G1 |
|---|---|---|---|
| P4 | 7 | 2 | 2.71 |
| P5 | 8 | 3 | 1.91 |
| P6 | 9 | 2 | 3.29 |
| P7 | 5 | 6 | 2.50 |
| P8 | 6 | 7 | 2.56 |
| P9 | 7 | 6 | 1.30 |
| P10 | 8 | 7 | 2.45 |
Hence,
MIN = 1.30
MAX = 3.29
AVG = 2.39
STEP 3: If, for any cluster, AVG value is greater than others, then MIN and MAX values are checked. If the MAX value is higher too, we assign the corresponding data point as a new cluster and go back to step 1, with K+1 clusters.
Here, we can clearly see that AVG value of Cluster 2 is much greater than Cluster 1, so we'll compare the MAX values now:
Since 3.29 > 1.20 by a significant margin, we can confirm that Cluster 2 has the presence of an outlier.
MAX value of 3.29 is present in the P6 data point, so that will be the point we can remove from Cluster 2.
STEP 4: Repeat STEPS 1 to 3 until no new clusters are formed.
| Clusters | Points |
|---|---|
| Cluster1 | {P1,P2,P3} |
| Cluster2 | {P4,P5,P7,P8,P9,P10} |
| Cluster2 | {P6} |
Now, we perform STEP 1 again, to form the following clusters:
| Clusters | Points |
|---|---|
| Cluster1 | {P1,P2,P3} |
| Cluster2 | {P7,P8,P9,P10} |
| Cluster2 | {P6,P4,P5} |
Again, we perform STEP 2:
Cluster 1 (unchanged):
MIN = 0.33
MAX = 1.20
AVG = 0.86
Cluster 2:
New G2 = (6.5 , 6.5)
| Point | X | Y | Distance from G2 |
|---|---|---|---|
| P7 | 5 | 6 | 1.58 |
| P8 | 6 | 7 | 0.71 |
| P9 | 7 | 6 | 0.71 |
| P10 | 8 | 7 | 1.58 |
MIN = 0.71
MAX = 1.58
AVG = 1.145
Cluster 3:
G3 = (8,2.33)
| Point | X | Y | Distance from G1 |
|---|---|---|---|
| P4 | 7 | 2 | 1.05 |
| P5 | 8 | 3 | 0.67 |
| P6 | 9 | 2 | 1.05 |
MIN = 0.67
MAX = 1.05
AVG = 0.92
STEP 3:
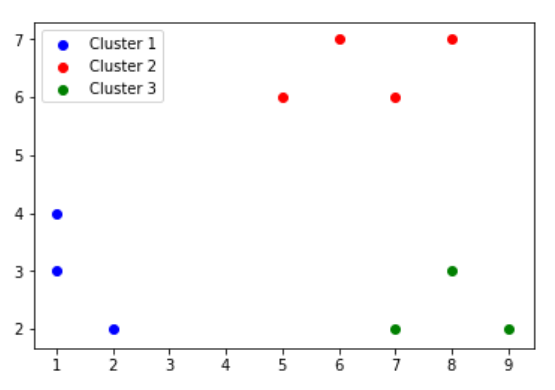
Cluster 1,2 and 3, we find that the AVG inter-cluster distances are quite similar. Hence, we can safely say that there are no outliers, and that these are our final 3 clusters.
FINAL CLUSTERS:
| Clusters | Points |
|---|---|
| Cluster1 | {P1,P2,P3} |
| Cluster2 | {P7,P8,P9,P10} |
| Cluster2 | {P6,P4,P5} |
Complexity analysis
Complexity of K Mean algorithm = O(tkn), where:
- t is the number of iterations
- k is the number of clusters
- n is the number of data points
K+ Mean algorithm is computationally more expensive as compared to K Means, since it performs a few extra steps in order to find the better value of K.
However, the simplicity and effectiveness of K+ Means more than makes up for the time complexity.
Complexity of K+ Mean algorithm = O(t * (k^2) * n).
Conclusion
The K+ Means algorithm takes all the strengths of the widely popular K Means algorithm and remains simple and easy to use and understand. In addition, it removes the weaknesses of the K-Means algorithm as well.