Reading time: 35 minutes | Coding time: 20 minutes
Audio is one of the forms of data in which research is continuously growing with the rise of applications like Google Home and Amazon Echo. Having the basic knowledge of managing audio like a data as you would handle text is a very important skill and is the stepping stone for much greater things. In this article, we will explore various aspects about audio like different formats, features and representation with code demonstrations.
Audio is sound which is characterized by the vibration of air molecules. We have devices like audio recorder which does a good job of capturing the pattern of vibrations which our brain interprete as sound.
In real life, sound is just a data which we can work on.
Key words to understand audio data
Each audio data has the following key terms which is required to understand it:
- sampling rate
- bit depth
Sampling rate is the number of sections (called samples) made in 1 second of audio recording.
Bit depth is the number of bits required to represent a sample.
Features of audio wave
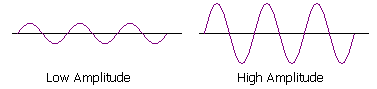
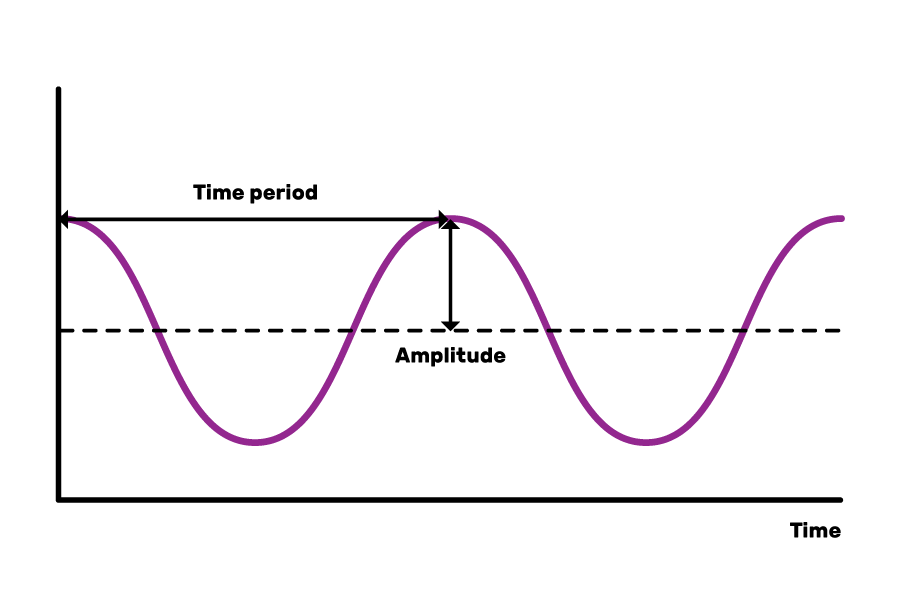
Amplitude : Amplitude is the displacement of a wave from its mean value.
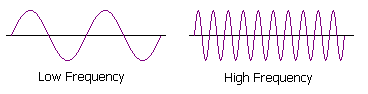
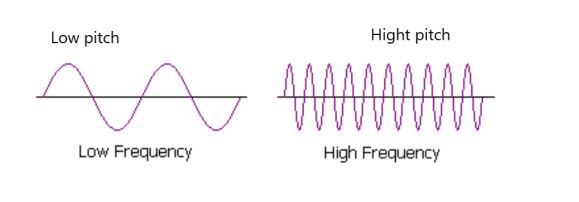
Frequency : The particles of the medium through which the sound moves is vibrating in a back and forth motion at a given time.
Period : The time taken for 1 oscillation is called the period, and the period is related to the frequency by:
Period = 1/frequency
Pitch : The sensation of a frequency is commonly referred to as the pitch of a sound. A high pitch sound corresponds to a high frequency sound wave and a low pitch sound corresponds to a low frequency sound wave.
Intensity : Intensity refers to the force with which you feel the emotion.
Loudness : The loudness of a sound wave is determined from its amplitude.
Valence : Valence just refers to kinds of emotions, such as anger, sadness, or joy, and whether they’re positive or negative.
Different formats of audio :
Digitally, audio is usually represented in the following 3 formats:
- PCM
- WAV
- MP3
PCM
PCM stands for Pulse Code Modulation, a digital representation of raw analog audio signals. Analog sounds exist as waveforms in order to convert the waveform into desired results, the sound must be sampled and recorded at certain intervals (or pulses).
This digital audio format has a sampling rate (how often a sample is made) and a bit depth (how many bits are used to represent each sample).
The digital recording is a close-to-exact representation of analog sound.
WAV
WAV stands for Waveform Audio File Format (also called Audio for Windows at some point but not anymore). The WAV file is just a wrapper for the PCM encoding, making it more suitable for use on Windows systems.
Mac systems can also open WAV files without any issues.
MP3
MP3 stands for MPEG-1 Audio Layer 3. When it was released it became the most popular audio format in the world for music files.
The main goal of MP3 are:
- To drop all the sound data that exists beyond the hearing range of normal people (20-20000Hz).
- To reduce the quality of sounds that aren’t easy to hear.
- To compress all other audio data as efficiently as possible.
MP3 is not the same as MP4.
Audio Representation
NOTE: ipd.Audio(y, rate=sr) is only valid for Jupyter Notebook
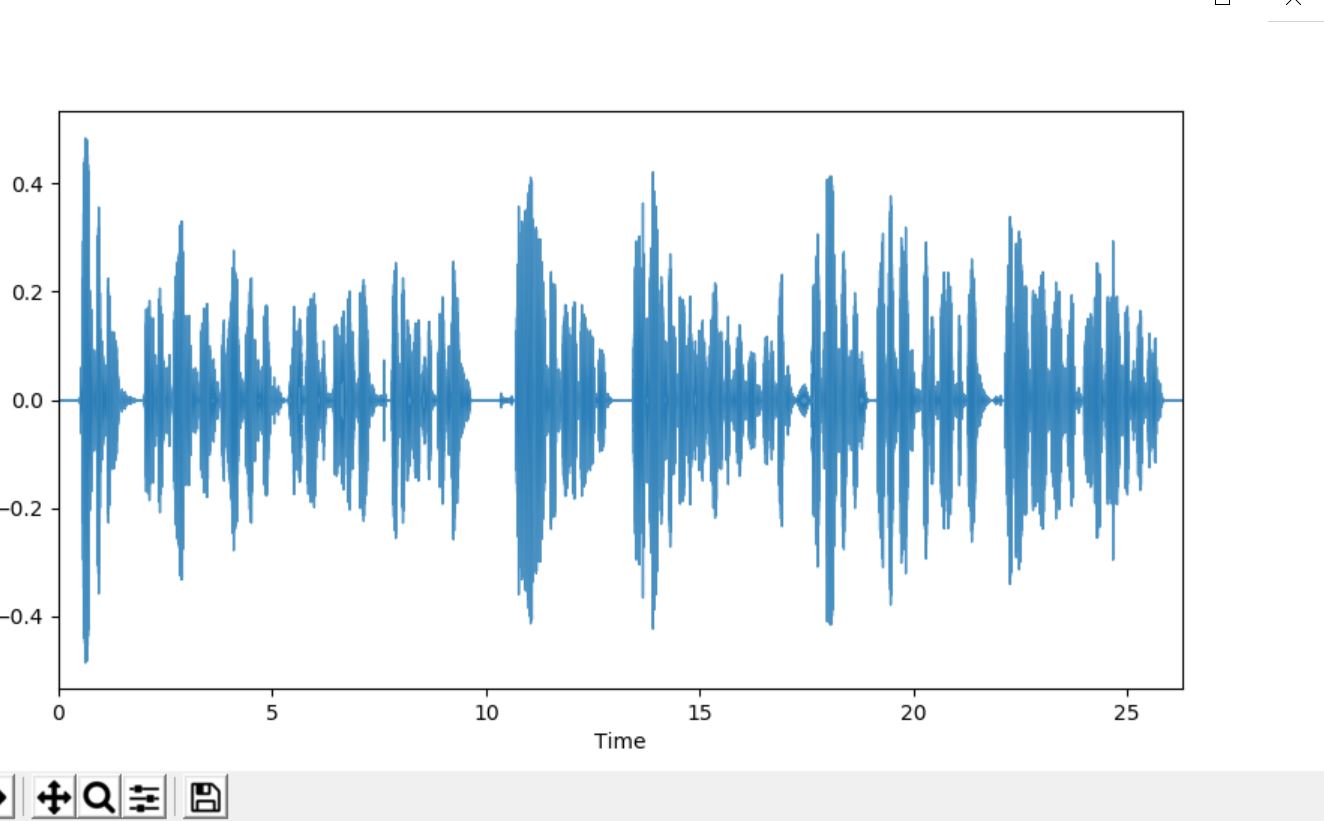
Waveforms and domains
Waveform wrt sound represents movement of particles in a gaseous, liquid, or solid medium.
Time domain when refering with respect to sound is depection of particles movement with the help of analysis of time.
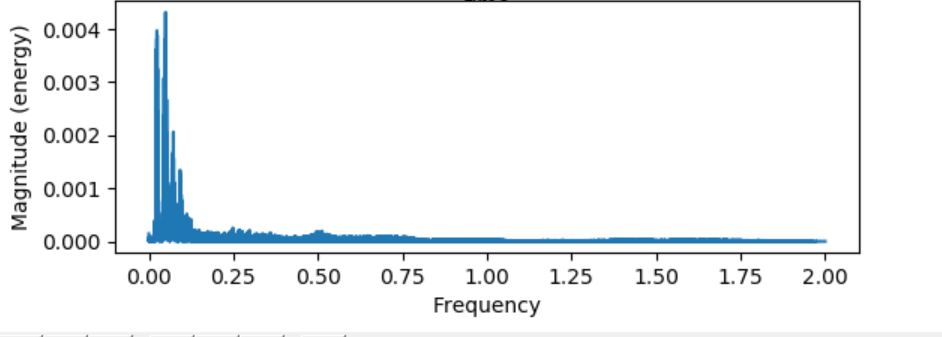
Frequency domain when refering with respect to sound is depection of particles movement with the help of analysis of frequency (explained later).
Code demonstration
We will demonstrate how we can extract some data for audio in Python using Librosa library:
CODE for time domain
import numpy as np
import matplotlib.pyplot as plt
from glob import glob
import librosa as lr
import librosa.display
from IPython.display import Audio
import IPython.display as ipd

audio='arabic6'
y, sr = lr.load('./{}.wav'.format(audio))
#i.pd.Audio(y, rate=sr)
plt.figure(figsize=(15, 5))
lr.display.waveplot(y, sr, alpha=0.8)
plt.show()
Output :
CODE for frequency domain
import numpy as np
import matplotlib.pyplot as plot
from scipy import pi
from scipy.fftpack import fft
import librosa as lr
import librosa.display

audio='arabic6'
y, sr = lr.load('./{}.wav'.format(audio))
signalAmplitude   = np.sin(y)
plot.subplot(211)
plot.plot(y, signalAmplitude,'bs')
plot.xlabel('time')
plot.ylabel('amplitude')
plot.subplot(212)
plot.magnitude_spectrum(signalAmplitude,Fs=4)
plot.show()
Output :
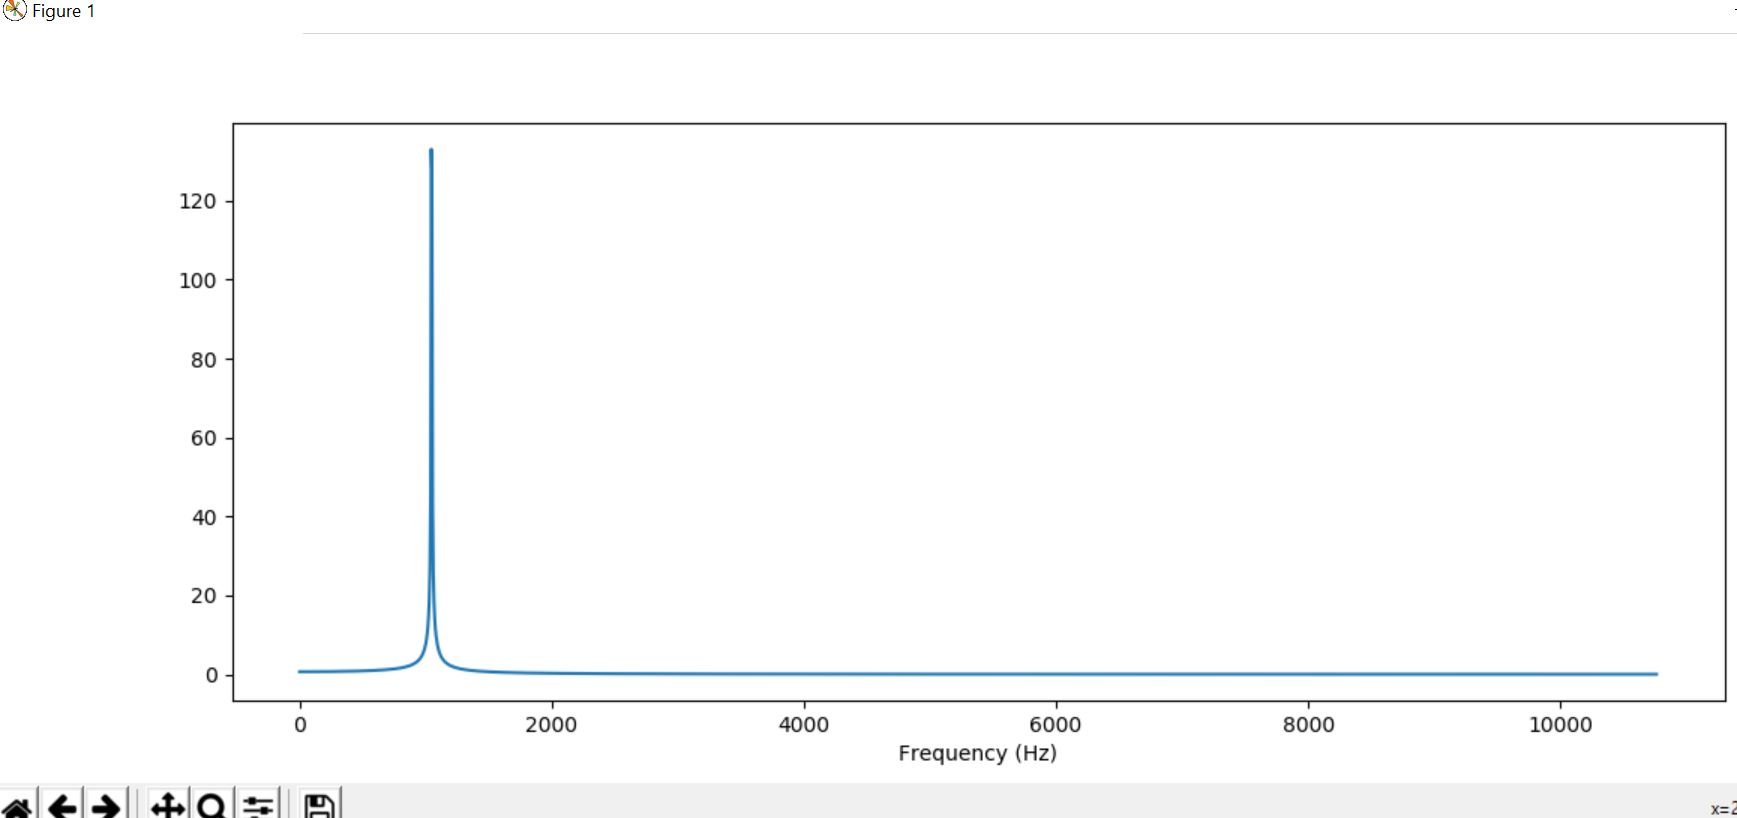
Pure Tone
A pure tone is a sound with a sinusoidal waveform; this is, a sine wave of any frequency, phase, and amplitude.
CODE
import numpy as np
import matplotlib.pyplot as plt
from glob import glob
import librosa as lr
import librosa.display
from IPython.display import Audio
import IPython.display as ipd
import scipy

audio='arabic6'
y, sr = lr.load('./{}.wav'.format(audio))
T = 2.0 # seconds
f0 = 1047.0 #synthesize a pure tone at 1047 Hz
sr = 22050
t = np.linspace(0, T, int(T*sr), endpoint=False) # time variable
y = 0.1*np.sin(2*np.pi*f0*t)
X = scipy.fft(y[:4096])
X_mag = np.absolute(X)        # spectral magnitude
f = np.linspace(0, sr, 4096)  # frequency variable
plt.figure(figsize=(14, 5))
plt.plot(f[:2000], X_mag[:2000]) # magnitude spectrum
plt.xlabel('Frequency (Hz)')
plt.show()
Output :
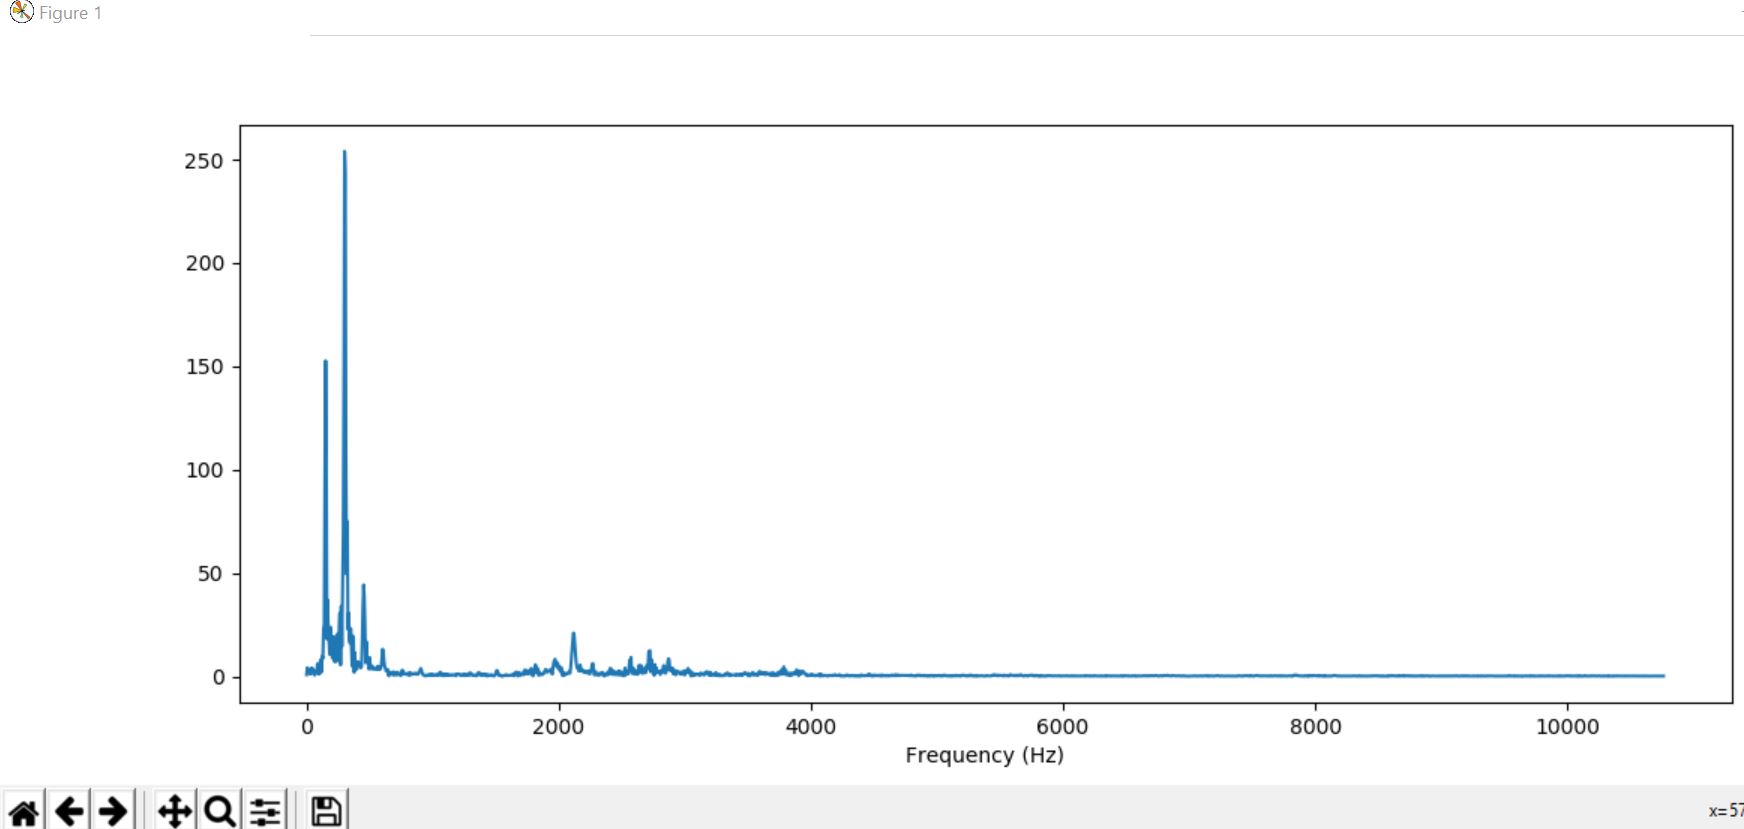
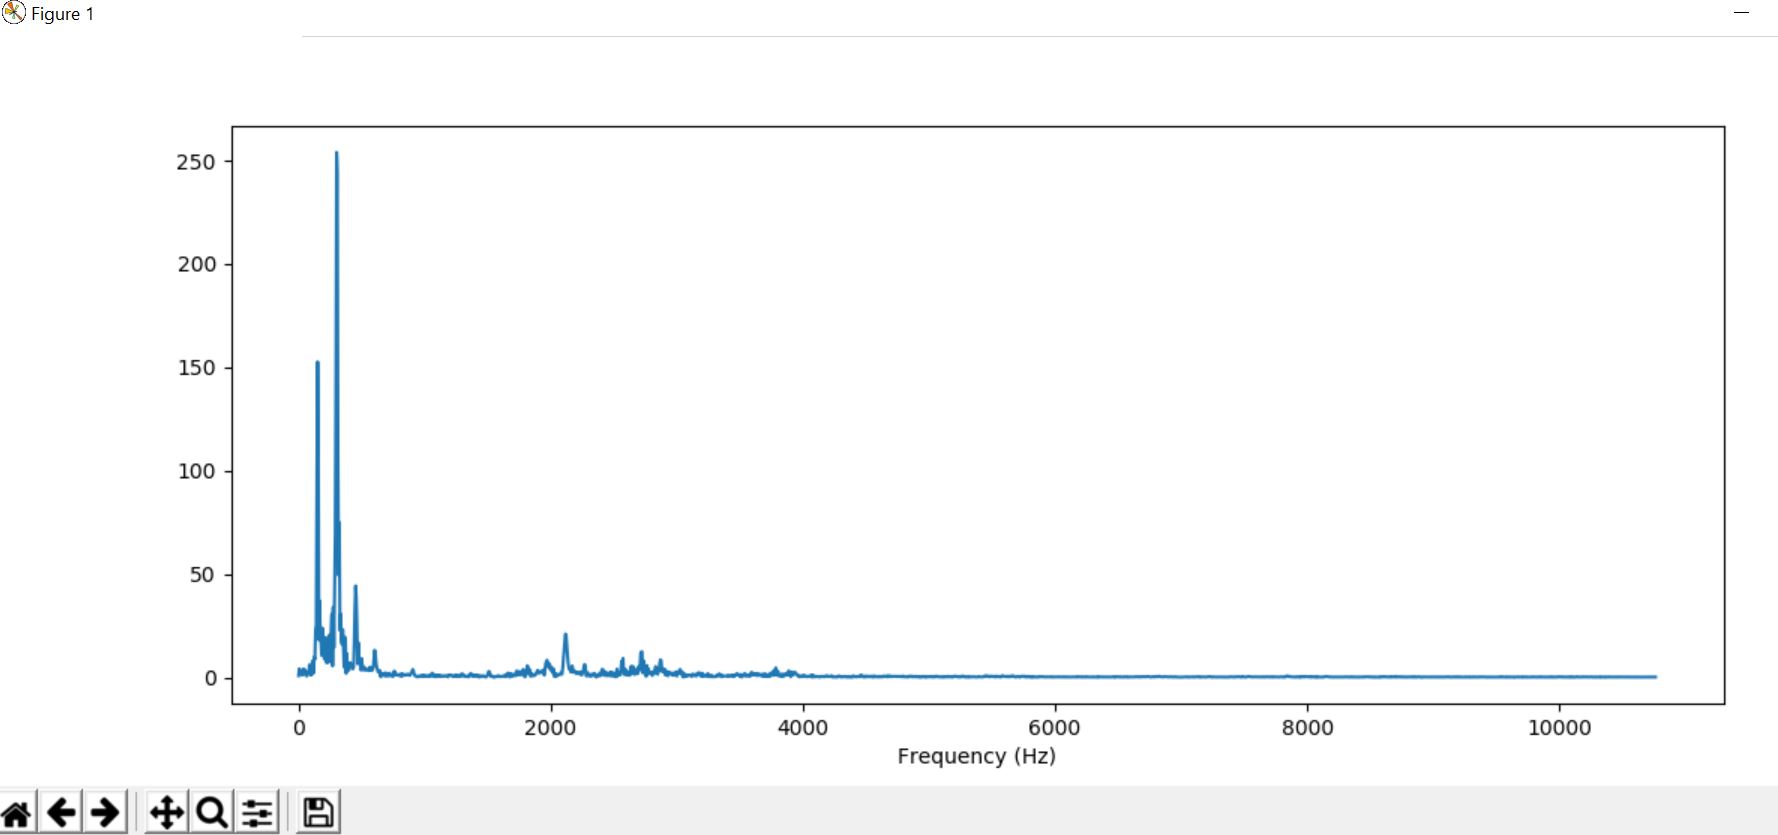
Oboe
Oboe is an instrument which is placed between the lips and blown which causes both reeds to vibrate against each other. They open and close very rapidly, sending bursts of energy into the air column inside the instrument and causing it to vibrate in sympathy.
CODE
import numpy as np
import matplotlib.pyplot as plt
from glob import glob
import librosa as lr
import librosa.display
from IPython.display import Audio
import IPython.display as ipd
import scipy

audio='arabic6'
y, sr = lr.load('./{}.wav'.format(audio))
f = np.linspace(0, sr, 4096)
#print(y.shape)
X = scipy.fft(y[10000:14096])
X_mag = np.absolute(X)
plt.figure(figsize=(14, 5))
plt.plot(f[:2000], X_mag[:2000]) # magnitude spectrum
plt.xlabel('Frequency (Hz)')
plt.show()
Output :
Clarinet
It is a single-reed woodwind instrument used orchestrally and in military and brass bands and possessing a distinguished solo repertory.
CODE
import numpy as np
import matplotlib.pyplot as plt
from glob import glob
import librosa as lr
import librosa.display
from IPython.display import Audio
import IPython.display as ipd
import scipy

audio='arabic6'
y, sr = lr.load('./{}.wav'.format(audio))
f = np.linspace(0, sr, 4096)
#ipd.Audio(y, rate=sr)
#print(y.shape)
X = scipy.fft(y[10000:14096])
X_mag = np.absolute(X)
plt.figure(figsize=(14, 5))
plt.plot(f[:2000], X_mag[:2000]) # magnitude spectrum
plt.xlabel('Frequency (Hz)')
plt.show()
Output :