
Open-Source Internship opportunity by OpenGenus for programmers. Apply now.
In this article, we have explored the idea of R squared and Adjusted R squared which are frequently used in Regression Analysis to analyze data.
| Table of contents |
|---|
| Introduction |
| What is R-squared |
| Residual sum of squares(RSS) |
| Total sum of squares(TSS) |
| Calculation R-squared |
| Limitations of R-squared |
| Adjusted R-squared |
| calculation of adjusted R-squared |
| conclusion |
Introduction
Hola everyone! you must have known about linear regression, if not just go through Linear regression. After understanding how Linear Regression algorithm works, I m sure you would have tried some predictions on problem statement and built a model. okay we have predicted values and built a model, what's next?
This will be the most crucial part. we should evaluate the perfomance of our model which most of the people wont do.. This evaluation will show the shortcomings of our model.we should choose the appropriate Evaluation metric . In this article we are going to see about two important metrics: R squared and adjusted R squared
what is R-squared?
R-squared is a goodness of fit measure for linear regression models. It is a statistical measure that represents the proportion of the variance for a dependent variable that is explained by an independent variable (variables in a regression model).It is quite vague right? believe me you will definitely understood the concept well in the end of the article. before finding the R-squared we first see some other important things needed to find R-squared.
Residual sum of squares (RSS)
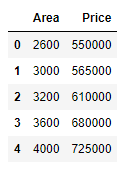
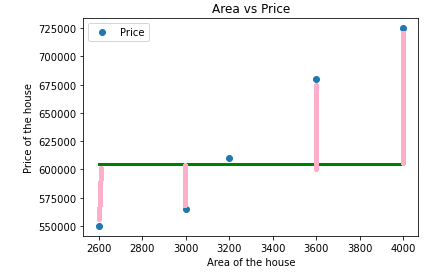
It is also called sum squared regression error , simply it is a variance of best fit line. Let me explain this with a simple and most popular example house price prediction. Here I took a small data set which consists of area of the house and price of house based on area
here, we are trying to predict the price of the house based on area of the house. Area of the house will be our independent variable and the price of the house will be our dependent variabe or target variable Now,let us plot the given data using matplotplib(I guess you already know how to plot in python using matplotlib)
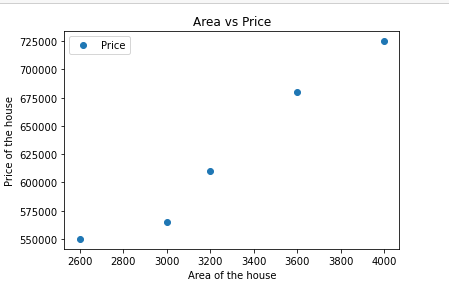
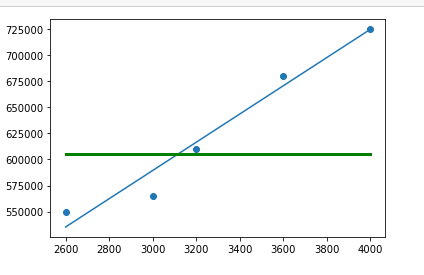
from this plot we can see how the price of the house varies with the area of the house. and let we find the best fit line using linear regression
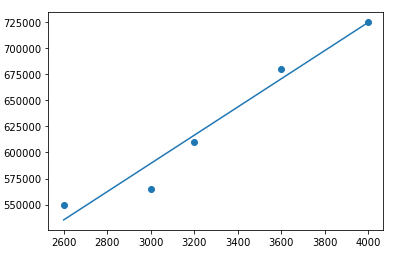
This blue line is our predicted best fit regression line.As we can see that our prediction line does not predicts the actual price exactly. then how do we evaluate the predictions from the regression line? first we start this by determining the residual values our data points.
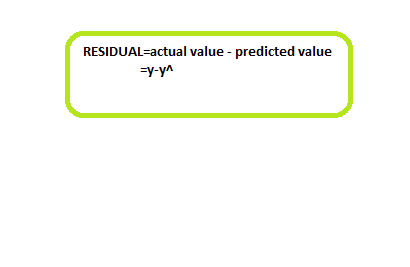
Residual for a point is the difference the actual value and the value predicted by our model.
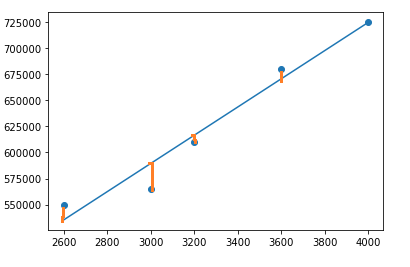
The difference between each data point is squared so that the point below the line dont cancel out point above the line.
Using the residual values, we can find the Residual sum of squares (variance of the best fit line)
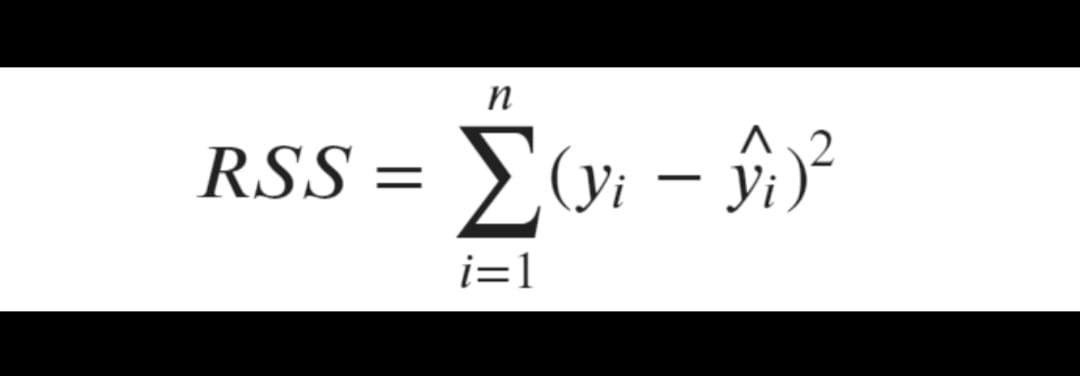
We say that this regression line is best fit if it minimizes the RSS values. the lower the value of RSS the better is our model predictions. but the major limitation of RSS is it is a scale variant statistic
for example, if I had 1,2,3,4 etc... meters of clothes is a target variable, then the RSS value will be of 0.54(not exact just hypotheticaly speaking), but if i change the unit of the target variable from meters to centimeters(100,200,300,400,etc..) still we had the same data but our RSS value will be 5400.
Hence the RSS value varies according to the scale of the target. now what we can do? yes, here comes our R-squared
Before coming to the calculation of R-squared, we will see how to determine Total sum of squares which is needed in the calculation of R-squared.
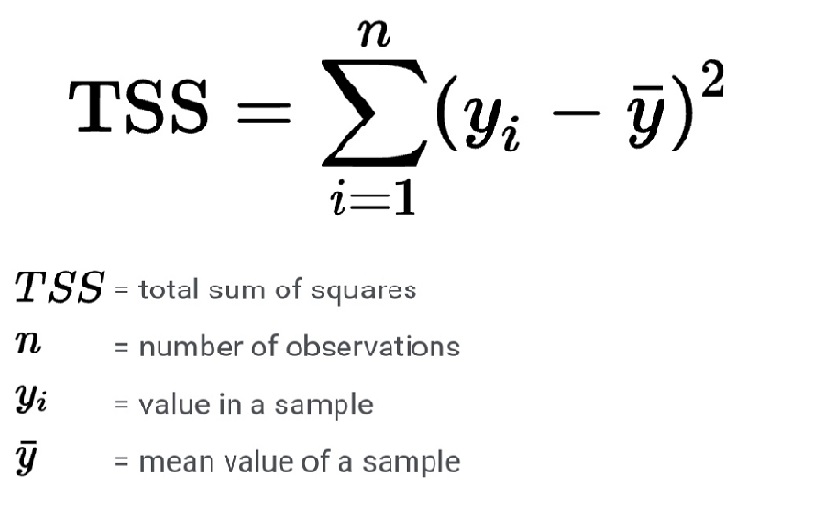
Total sum of squares
It is nothing but the sum of squares of the difference the mean and the actual values(variance of the mean line)
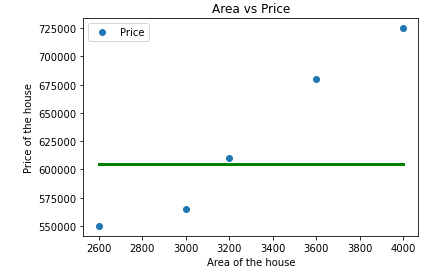
here the green line indicates the mean of our data points
Using the total sum of squares (TSS) we can able to find how our data points are deviated from the mean. ok now let see how to calculate the R-squared
Calculation of R-squared
TSS gives the total variation in dependent variable(Y), and RSS gives the variation in dependent variable that is not explained by independent variable(X),now TSS-RSS gives the variation of dependent variable(Y) that is explained by our model. now to get the proportion of variation of Y explained by our model we just divide TSS-RSS by TSS value. This is called R-squared
R-squared=(TSS-RSS)/TSS
= variation explained by our model/Total variation
=1-(unexplained variation/Total variation)
Higher the value of R-squared the better is our model.If R-squared value is 0.8 , it means that the independent variable explains 80% of the variation in the target variable(Y). R-squared always lies between 0 and 1. if we had a low RSS value it means that our regression line is so close to the actual mean line.
Limitations of R-squared
The value of R-squared never decreases even if we add independent variables to our regression model. either it remains the same or it increases. with the addition of the new independent variables.even if the newly added independent variable is not useful r-squared value will increases.so to overcome this problem we adjust the r squared value that is adjusted R-squared
adjusted R-squared
Like as our R-squared ,adjusted R-squared also indicates how well our data points fits the curve or line.The adjusted R-squared takes into account the number of independent variable used for predicting the target variable.if we add more useless variables to our model , adjusted R-squared will decrease.if we add more useful variables, adjusted r-squared will increase.
adjusted R-squared will always be less than or equal to R-squared.
Calculating adjusted R-squared
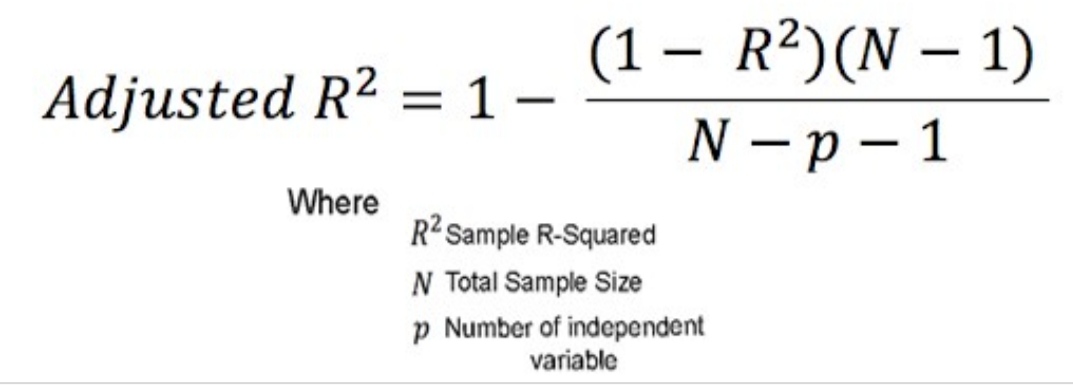
people will mostly prefer adjusted R-squared when there are multiple variables.
Conclusion
In this article at OpenGenus, I have explained R-squared ,it's limitations and adjusted R-squared clearly. I hope you all would have a clear idea when and where to use R-squared and adjusted r-squared.Then what are you waiting for? just go and evaluate your model using R-squared and adjusted R-squared.