
In this post, we will look at different performance metrics which are widely used in Machine Learning. Performance metrics are used to evaluate the performance/ effectiveness of our machine learning model.
I will cover those popular metrics used in Classification and Regression scenarios which come under the Supervised Learning.
Performance Metrics for Regression
Regression analysis is a subfield of supervised machine learning. It aims to model the relationship between a certain number of features and a continuous target variable. Following are the performance metrics used for evaluating a regression model:
- Mean Absolute Error (MAE)
- Mean Squared Error (MSE)
- Root Mean Squared Error (RMSE)
- R-Squared
- Adjusted R-squared
Mean Absolute Error (MAE)
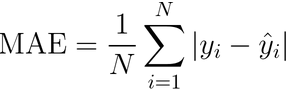
where yᵢ is the actual expected output and ŷᵢ is the model’s prediction.
It is the simplest evaluation metric for a regression scenario and is not much popular compared to the following metrics.
Say, yᵢ = [5,10,15,20] and ŷᵢ = [4.8,10.6,14.3,20.1]
Thus, MAE = 1/4 * (|5-4.8|+|10-10.6|+|15-14.3|+|20-20.1|) = 0.4
Mean Squared Error (MSE)
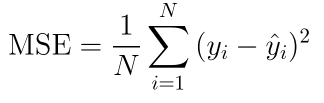
Here, the error term is squared and thus more sensitive to outliers as compared to Mean Absolute Error (MAE).
Thus, MSE = 1/4 * (|5-4.8|2+|10-10.6|2+|15-14.3|2+|20-20.1|2) = 0.225
Root Mean Squared Error (RMSE)
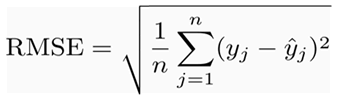
Since MSE includes squared error terms, we take the square root of the MSE, which gives rise to Root Mean Squared Error (RMSE).
Thus, RMSE = (0.225)^0.5 = 0.474
R-Squared
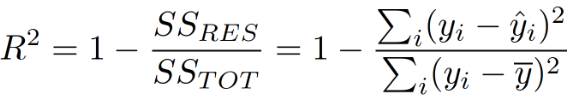
R-squared is calculated by dividing the sum of squares of residuals (SSres) from the regression model by the total sum of squares (SStot) of errors from the average model and then subtract it from 1.
R-squared is also known as the Coefficient of Determination. It explains the degree to which the input variables explain the variation of the output / predicted variable.
A R-squared value of 0.81, tells that the input variables explains 81 % of the variation in the output variable. The higher the R squared, the more variation is explained by the input variables and better is the model.
Although, there exists a limitation in this metric, which is solved by the Adjusted R-squared.
Adjusted R-squared
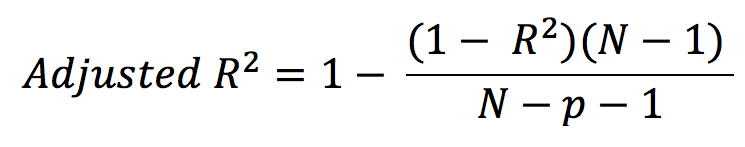
Here, N- total sample size (number of rows) and p- number of predictors (number of columns)
The limitation of R-squared is that it will *either stay the same or increases with the addition of more variables, even if they do not have any relationship with the output variables. *
To overcome this limitation, Adjusted R-square comes into the picture as it penalizes you for adding the variables which do not improve your existing model.
Hence, if you are building Linear regression on multiple variables, it is always suggested that you use Adjusted R-squared to judge the goodness of the model.
If there exists only one input variable, R-square and Adjusted R squared are same.
Performance Metrics for Classification
Classification is the problem of identifying to which of a set of categories/classes a new observation belongs, based on the training set of data containing records whose class label is known. Following are the performance metrics used for evaluating a classification model:
- Accuracy
- Precision and Recall
- Specificity
- F1-score
- AUC-ROC
To understand different metrics, we must understand the Confusion matrix. A confusion matrix is a table that is often used to describe the performance of a classification model (or "classifier") on a set of test data for which the true values are known.
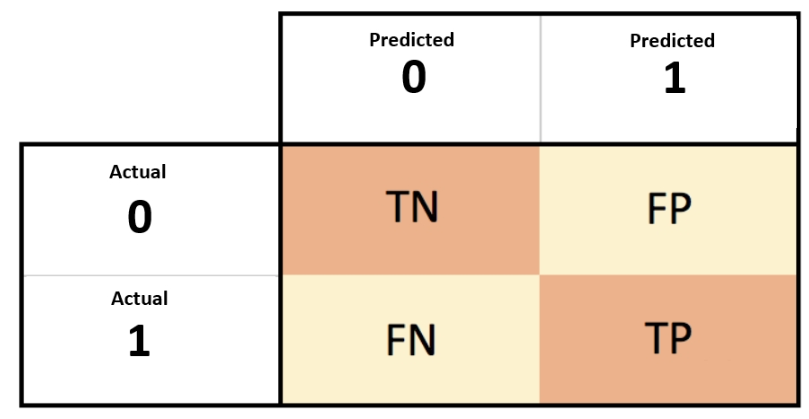
TN- True negatives (actual 0 predicted 0) & TP- True positives (actual 1 predicted 1)
FP- False positives (actual 0 predicted 1) & FN- False Negatives (actual 1 predicted 0)
Consider the following values for the confusion matrix-
- True negatives (TN) = 300
- True positives (TP) = 500
- False negatives (FN) = 150
- False positives (FP) = 50
Accuracy
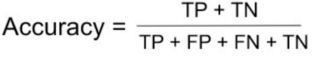
Accuracy is defined as the ratio of the number of correct predictions and the total number of predictions. It lies between [0,1]. In general, higher accuracy means a better model (TP and TN must be high).
However, accuracy is not a useful metric in case of an imbalanced dataset (datasets with uneven distribution of classes). Say we have a data of 1000 patients out of which 50 are having cancer and 950 not, a dumb model which always predicts as no cancer will have the accuracy of 95%, but it is of no practical use since in this case, we want the number of False Negatives as a minimum. Thus, we have different metrics like recall, precision, F1-score etc.
Thus, Accuracy using above values will be (500+300)/(500+50+150+300) = 800/1000 = 80%
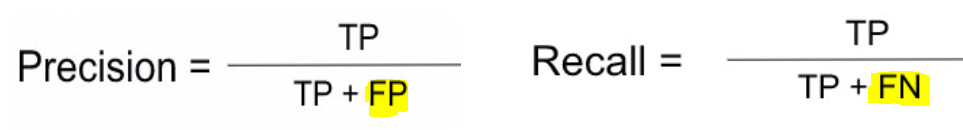
Precision and Recall
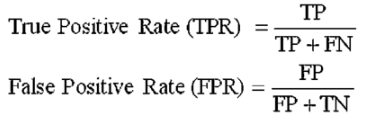
Recall is a useful metric in case of cancer detection, where we want to minimize the number of False negatives for any practical use since we don't want our model to mark a patient suffering from cancer as safe. On the other hand, predicting a healthy patient as cancerous is not a big issue since, in further diagnosis, it will be cleared that he does not have cancer. Recall is also known as Sensitivity.
Thus, Recall using above values will be 500/(500+150) = 500/650 = 76.92%
Precision is useful when we want to reduce the number of False Positives. Consider a system that predicts whether the e-mail received is spam or not. Taking spam as a positive class, we do not want our system to predict non-spam e-mails (important e-mails) as spam, i.e., the aim is to reduce the number of False Positives.
Thus, Precision using above values will be 500/(500+50) = 500/550 = 90.90%
Specificity
Specificity is defined as the ratio of True negatives and True negatives + False positives. We want the value of specificity to be high. Its value lies between [0,1].
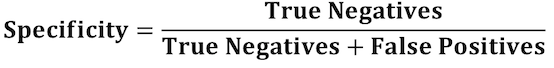
Thus, Specificity using above values will be 300/(300+50) = 300/350 = 85.71%
F1-score
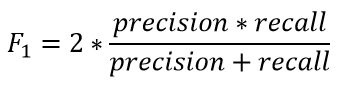
F1-score is a metric that combines both Precision and Recall and equals to the harmonic mean of precision and recall. Its value lies between [0,1] (more the value better the F1-score).
Using values of precision=0.9090 and recall=0.7692, F1-score = 0.8333 = 83.33%
AUC-ROC
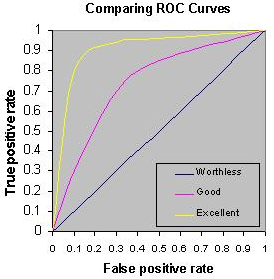
AUC (Area Under The Curve)- ROC (Receiver Operating Characteristics) curve is one of the most important evaluation metrics for checking any classification model’s performance. It is plotted between FPR (X-axis) and TPR (Y-axis). If the value is less than 0.5 than the model is even worse than a random guessing model.
Conclusion
Thus, depending upon the type of your problem (regression or classification), you can use some of these famous metrics in order to evaluate the performance of your predictive model.
Thank You!
Learn more:
- Basics of Image Classification Techniques in Machine Learning by Taru Jain
- Summary of Regression Techniques by Leandro Baruch
- Ridge Regression by Jash Sheth and Leandro Baruch
- Text classification using CNN by Harshiv Patel
- Text classification using Naive Bayes classifier by Harshiv Patel
- Model Evaluation: a crucial step in solving a machine learning problem by Surya Pratap Singh
- Linear Regression using TensorFlow in Python by Leandro Baruch