
Reading time: 45 minutes
Regression is a technique based on statistics to model the relationship between a set of variables to make predictions on unseen data. One of the common regression technique is linear regression which establishes a linear relationship (defined by a linear algebric equation) between a set of dependent and independent variables. Some of the types of regression techniques are:
- Linear regression
- Logistic regression
- Polynomial regression
- Ridge regression
- Lasso regression
- Elastic Net regression
- Stepwise regression
Background on Regression
How can analysts and algorithms be able to predict future values, behaviors, and possible security breaches that may happen, and have not yet developed a time-traveling machine?
Regression techniques are used in the most diverse cases, where basically the correlation between independent variables and the dependent variable and then a favorable scenario is created to identify what is to happen.
Imagine yourself in a company that distributes perishable food. It is very important to know exactly what will be sold so that you can get from your suppliers only what is needed, otherwise food will spoil, generate loss, not counting wrong politicking.
You, as a sales analyst, receive the following mission from your director: "Submit a report of what we will sell next quarter." - At first this seems like an impossible mission, or else what is expected is a result based on the instinct of the analyst in question and maybe his experience in the market. But how accurate is that? Does not the market change? Yes, the market changes, behaviors change, and however important it may be, the analyst's experience is not enough to have an acceptable outcome. For these cases, we use regression techniques. Then, giving continuity to the received mission, the analyst must determine which are the independent variables and find their correlations with the dependent variable.
Okay, it's the second time we see this, what are these variables anyway? In this specific case, the dependent variable is exactly how much will be sold of each product, whether the value in currency or quantity. And independent variables can be numerous, such as: number and size of active customers, purchase history of these customers, financial health of the market in question, number of competitors, inflation, receptivity of the products that are sold (when it comes to food, nowadays natural, biological foods are gaining strength, is this type of food that we are selling?), among other particularities that each market will have it. In the real estate market, house size, number of rooms and the neighborhood are common independent variables, while in the automobile market the independent variables are different. The important thing is to know that the regression works, regardless of the value we are seeking and what our variables are. The main requirement t is to have someone with expertise in the market in question so that we can have the correct and complete mapping and create a dataset to apply the regression model.
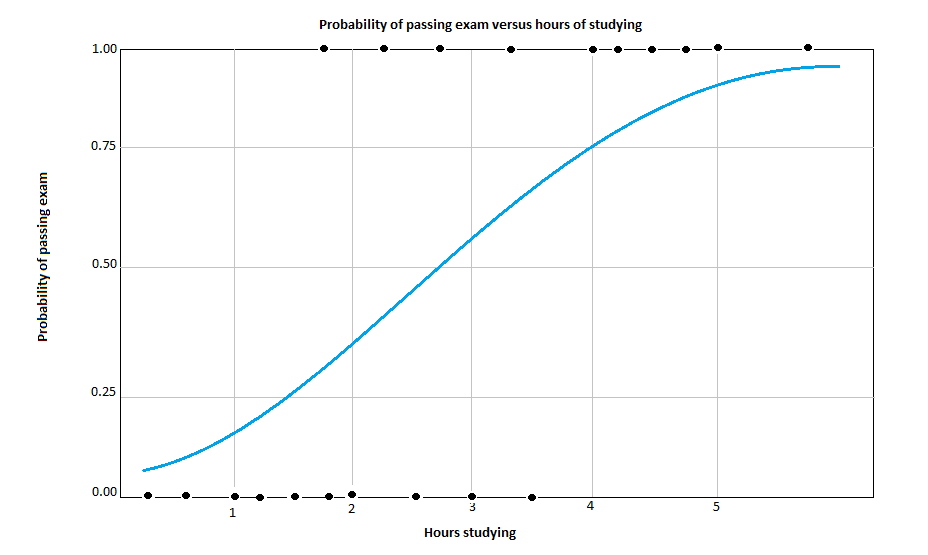
Logistic Regression
Logistic Regression aims to predict categorical values, often binary. It is widely used in:
- the medical field to classify sick and healthy individuals
- areas that need to determine a client's risk, such as insurance and financial companies.
In the following image we have an example of Logistic Regression, where the probability of passing the exam increases as the hours of study of the individual increases.
Advantages of Logistic Regression:
- Easy to handle independent variables categorical;
- Provide results in terms of probability;
- Ease of classification of individuals in categories;
- Requires small number of assumptions;
- High degree of reliability.
Linear Regression
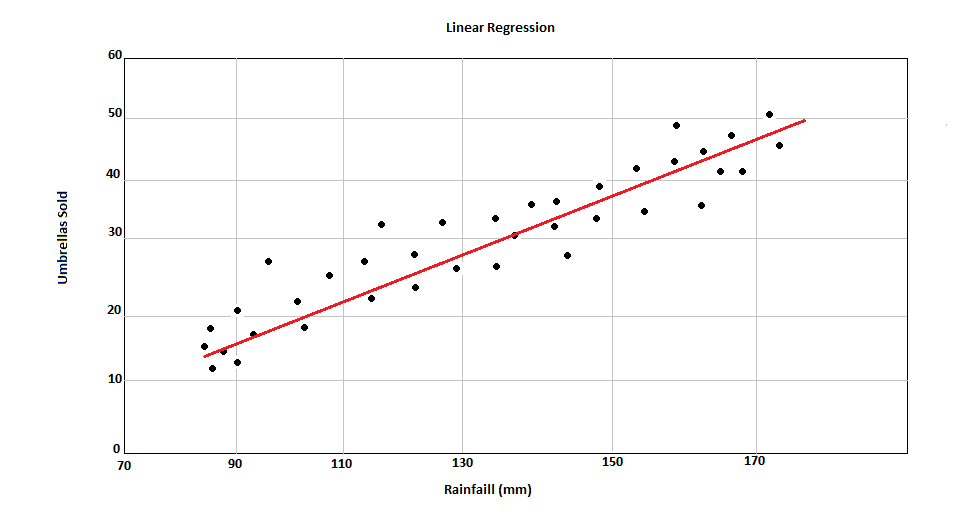
In Linear Regression, our algorithm searches the Regression line, which is nothing more than a straight line, considering the mean of all values matched by the correlation between the variables.
In the image above, we have a correlation between increased rainfall and number of umbrellas sold. The straight line, known as Regression Line, is plotted considering the best position considering the average of all the data points.
Advantages of Linear Regression:
- Excellent in predicting economic values;
- Quantitative support;
- Decisions of support.
Polynomial Regression
When we handle non-linear and separable data, a straight line will not work. In this case, Polynomial regression is very useful and their always have independent variables with power higher than 1.
It is used most in:
- financial market predictions
- medical dosage
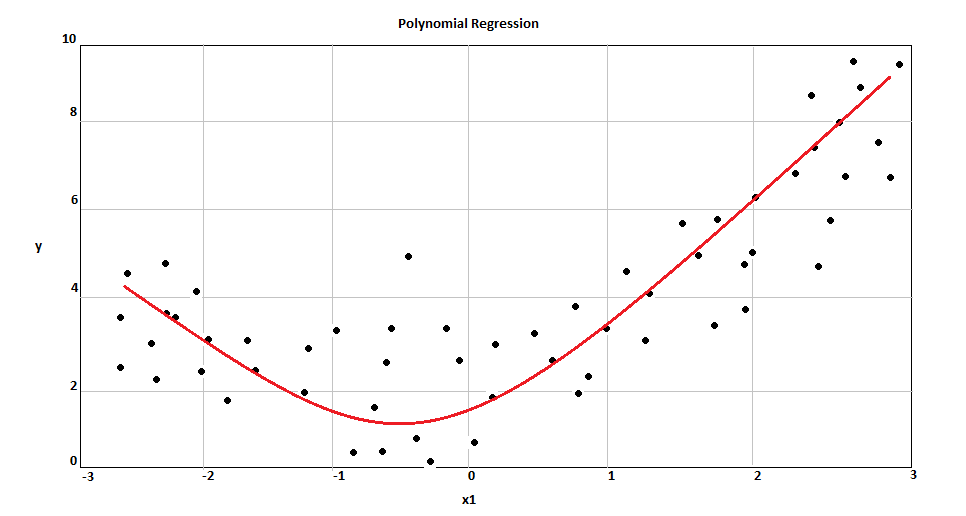
In the image above we can the best fit line. In Polynomial cases, the line is a curve.
Ridge Regression
When we have multicollinearity or when the number of predictor variables in a set exceed the number of observations, we use Ridge Regression. This technique has a shrinkage parameter to solve this problem. The result is a parameter with very low variance
The shrinkage paramter uses what we call of ridge estimator, which theoretically produce new estimators that are shrunk close to the true population parameters. The ridge estimator is especially good at improving the least-squares estimate when multicollinearity is present.
Also, Ridge Regression belongs a class of regresion tools that use L2 regularization. The other type of regularization, L1 regularization, limits the size of the coefficients by adding an L1 penalty equal to the absolute value of the magnitude of coefficients. This sometimes results in the elimination of some coefficients altogether, which can yield sparse models. L2 regularization adds an L2 penalty, which equals the square of the magnitude of coefficients. All coefficients are shrunk by the same factor (so none are eliminated). Unlike L1 regularization, L2 will not result in sparse models.
Lasso Regression
Lasso Regression is similar to Ridge Regression and the difference between them is that Lasso selects the only some feature while reduces the coefficients of others to zero. This property is known as feature selection and which is absent in case of ridge.
The result is even at small values of alpha, the magnitude of coefficients have reduced a lot. In another words, in larger datasets we use Lasso instead of Ridge, but it is important to know, if we have a lot of correlated variables we will lose important informations, even with Lasso. In this case, we don't use Ridge nor Lasso, we go for Elastic Net Regression.
Elastic Net Regression
So, we talked about Ridge, Lasso and now Elastic Net. We use them due a problem we call high bias and high variance.
Check the image below:
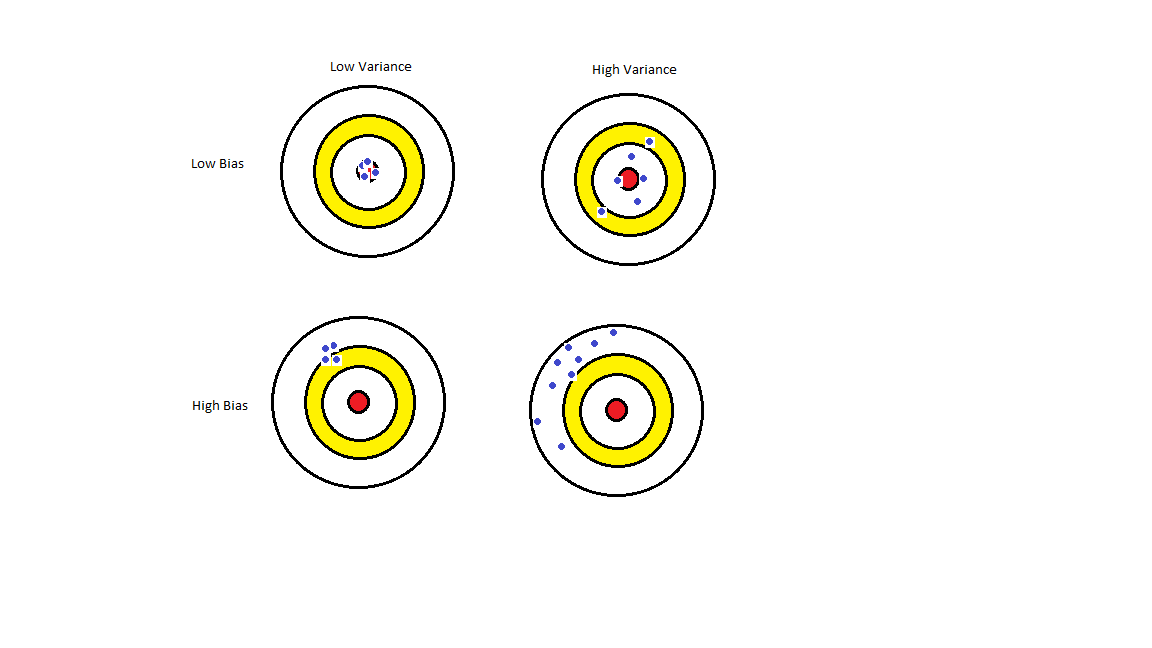
The scenario we are looking for is with Low Bias and Low Variance in order to have a better prediction from our model. Then we use regularization to reduce our variance and introducing some Bias.
We already did that using Ridge and Lasso, but both of them has faults. Elastic Net was created to combine the penalties of ridge regression and lasso to get the best of both worlds. Elastic Net aims at minimizing the loss information. There is a math formula to represent it:
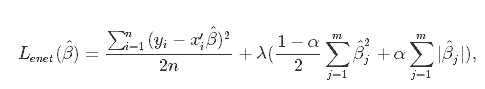
In the formula above, we can see α which is the mixing parameter between ridge and lasso. The result is a "tunned" model for better predictions.
Stepwise Regression
Stepwise regression is a technique which adds or removes variables via series of F-tests or T-tests. The variables to be added or removed are chosen based on the test statistics of the estimated coefficients.
Although this is a technique with good performance, it requires skill on the part of the researcher so should be performed by people who are very familiar with statistical testing.
Unlike most regression models, the models created with stepwise regression should be taken with a grain of salt, they require a keen eye to detect whether they make sense or not.
This technique has two methods:
-
The backward method: start the test with all available predictor variables, then delete one variable at a time as the regression model progresses. At each step, the variable with the lowest "F-to-remove" statistic is deleted from the model.
-
The forward method: add one variable at a time as the regression model progresses. The "F-to-add" statistic will calculate the statistic for each variable not in the model. The variable with the highest "F-to-add" statistic is added to the model.
Although many statisticians agree that Stepwise Regression should not be used, it has some advantages:
- The ability to manage large amounts of potential predictor variables, fine-tuning the model to choose the best predictor variables from the available options.
- It’s faster than other automatic model-selection methods.
- Watching the order in which variables are removed or added can provide valuable information about the quality of the predictor variables.
Here is a list of some issues found using this technique:
- Stepwise regression often has many potential predictor variables but too little data to estimate coefficients meaningfully. Adding more data does not help much, if at all.
- If two predictor variables in the model are highly correlated, only one may make it into the model.
- R-squared values are usually too high.
- Adjusted r-squared values might be high, and then dip sharply as the model progresses. If this happens, identify the variables that were added or removed when this happens and adjust the model.
- F and chi-square tests listed next to output variables don’t have those distributions.
- Predicted values and confidence intervals are too narrow.
- P-values are given that do not have the correct meaning.
- Regression coefficients are biased and coefficients for other variables are too high.
- Collinearity is usually a major issue. Excessive collinearity may cause the program to dump predictor variables into the model.
- Some variables (especially dummy variables) may be removed from the model, when they are deemed important to be included. These can be manually added back in.
What should I use?
The types above are just a few examples of many type of regressions. There are some techniques that you could use to verify the accuracy of your model, such as Cross Validation that you split and compare results between train and test datasets to check for overfitting, underfitting or the results expected.