
In This article, we will learn and explore about the System Design of Top K Heavy Hitters. This feature is used to get Top K elements in a set of elements and is frequently used in real systems. Several different approaches exist.
Table of content -
- Introduction
- Functional Requirements
- Non-Functional Requirements
- Hash table, single host
- Hash table, multiple hosts
- Hash table, multiple hosts, partitioning
- Count-min sketch
- High-level Architecture
- Data flow, fast path
- Data flow, slow path
- MapReduce jobs
- Data Retrieval
Introduction -
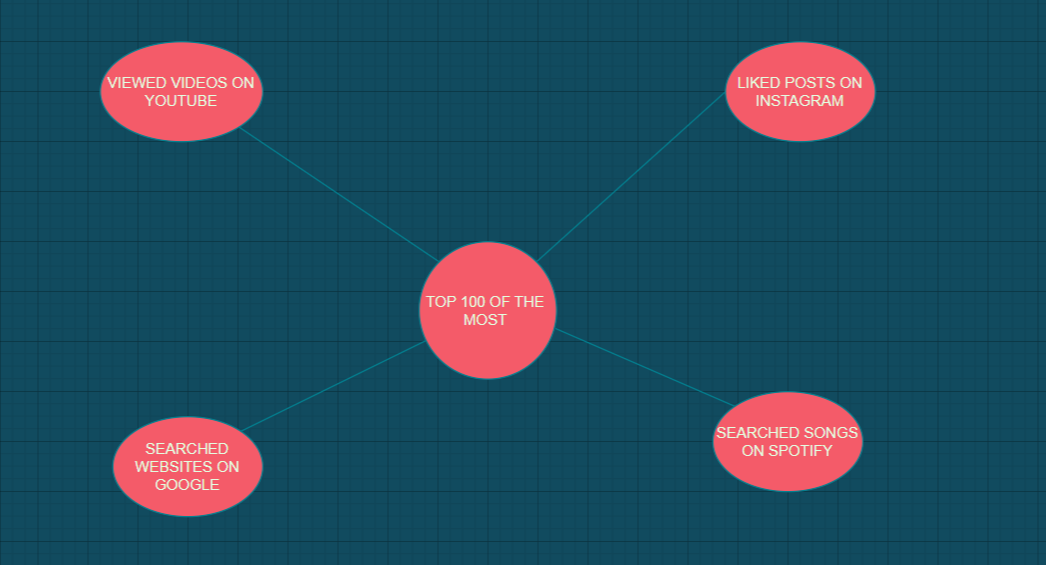
Top K Heavy Hitters is a well known problem in system design interview. Top K Heavy Hitters or Top K most Frequent items may be it in form of top k most visited websites on google , or may be Top K most viewed videos on youtube,or may be Top K most liked posts on Instagram or Twitter. The most basic answers may be database or distributed cache but obviously it is not a good choice for services of this scale where we are dealing with hundreds, thousands or even millions of request per seconds .databases today can handle millions of request per second even though counting views on each video and then finding top k most viewed videos from it is really not a good idea both in terms of time and money in case of such large scale applications.
Now our next approach be that it is an big data processing problem and MapReduce might help.But it alone help ,uch we need our top k heavy hitter elements as close to real time e.g most visited sites in last several minutes etc. So now our problem enter in category of stream processing problems.
Functional Requirements -
topK(k, startTime, endTime) here we want our system to return a list of k most frequent items and because this list changes over time we need to provide time interval or start and end time of the interval from which we want to know top k most frequent items.
Non-Functional Requirements -
Scalable -
We want to design a system that is Easily scalable with increase in data (pictures,videos,songs etc. ).
Highly Available -
Resistant to network and hardware failures. we want to design our system which makes our data available even in case of network and hardware failures.
Highly performant -
We wants our system to be fast such that we can retrieve list of heavy hitters in time of milliseconds.So for this requirement we have to pre- calculate top k heavy hitters. and avoid heavy calculations while calling topK API.
Accuracy -
Acuracy is also one of the most important requirements without accuracy our whole system is not capable of serving our expected requirements.
So accurate results along with above prperties make our system reliable so,let's discuss solutions that can produce accurate results.
e.g. using data sampling we can only count small number of events and not every event .
Hash table, single host -
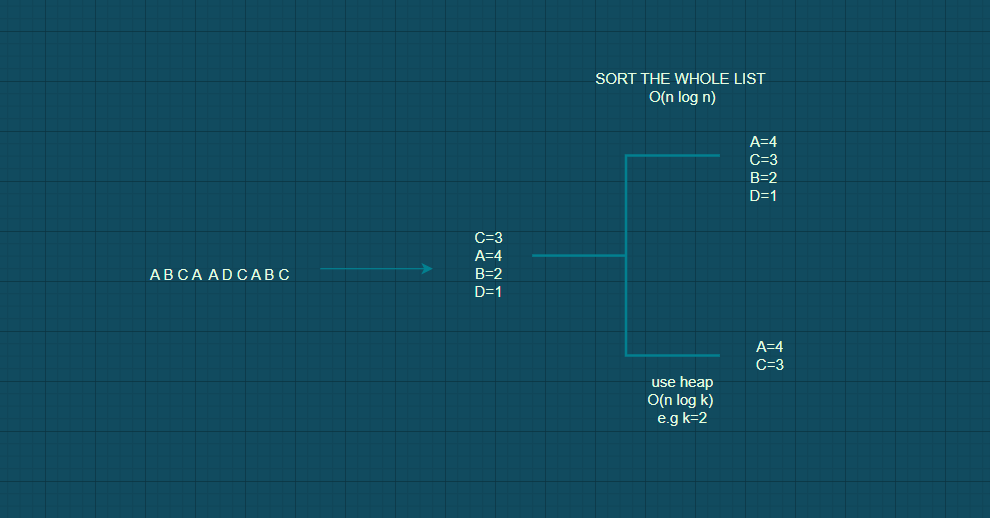
Here data set is loaded into memory of single host.e.g we have list of pictures that are liked by users on insta now let they are as A,B,C,D.so now we have to calculate k most frquently liked pictures.so we create a hash table which contains frequency counts of likes on a picture . or we can add all data in heap data structure and make sure that at a time it contains only top k elements ,Heap approach is faster.
This approach is not scalable.
Hash table, multiple hosts -
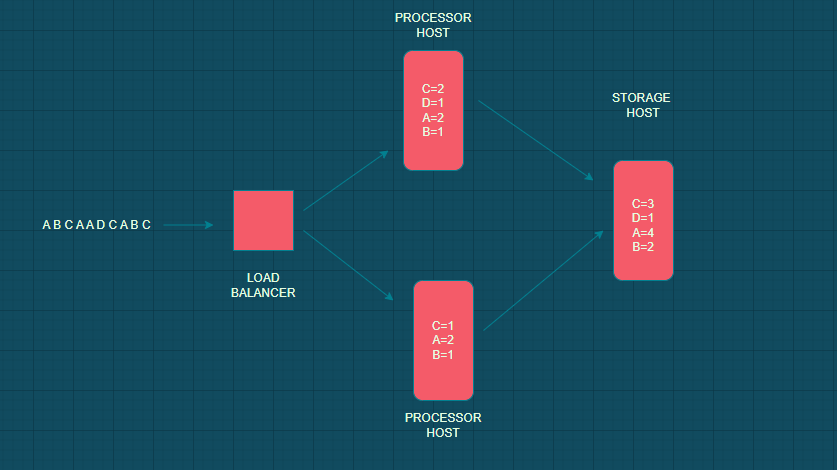
In this we introduce load balancer this load balancer will distribute different events in different processor hosts and at the end these hosts flush data into a single storage host.
Here we can process events in parallel and therefore thoroughput of system increases but the limitation is memory it requires very large memory so our hash table will be filled very soon and hence it is not scalable or perfect for large data sets.
Hash table, multiple hosts, partitioning -
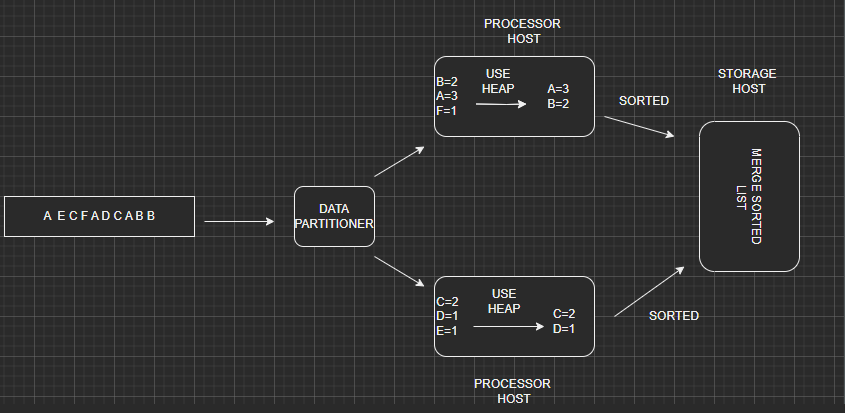
In this method we use partitioning of data into smalller data sets. Here we introduce Data Partitioner which is responsible for routing each individual video identifier to its own processor host therefore each procesor host stores only subset of all the data.
Here we build a hash table , create a heap and add all elements from the hash table to heap and now each processor host contains its own list of K heavy hitters in sorted order now we have to merge those sorted lists into a single top K heavy hitters list by using algorithm to merge n sorted lists.
Limitations -
This method is limited to bounded data sets only which are of limited size.
but Nowadays Unbounded unlimited data are generated every hour so we have either top k heavy hitters which are not accurate when retrieve for a longer interval of time e.g an hour or after a day because processor host data for only some time and then flushes it so we get accurate data only when time interval is less.
Count-min sketch -
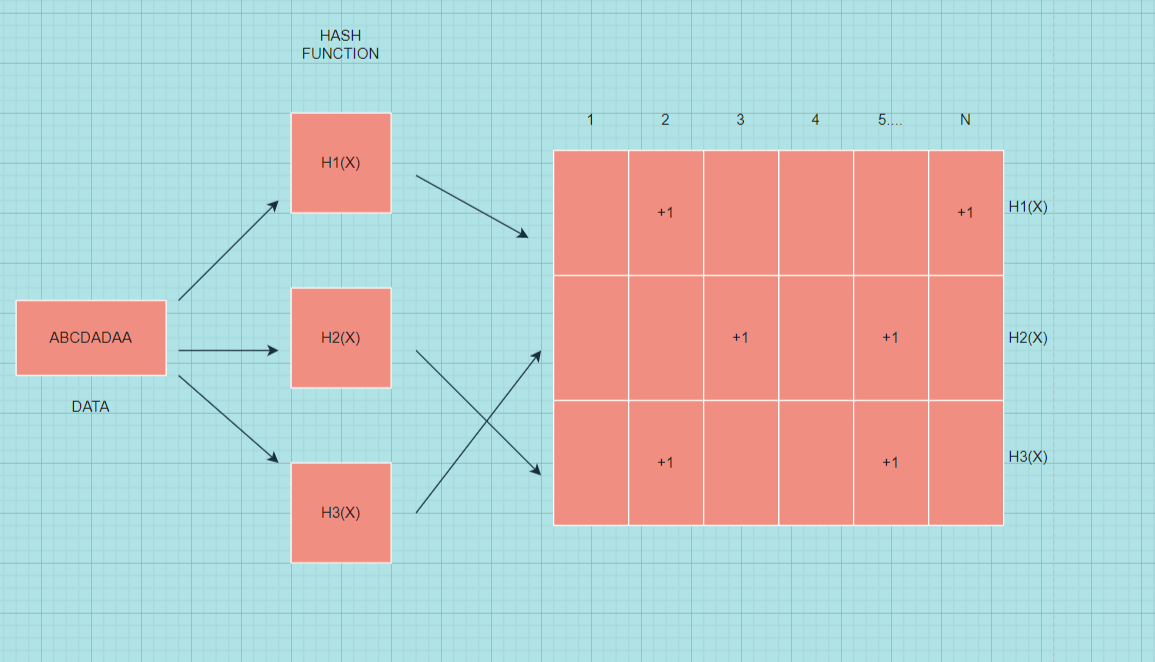
It is a simple solution but comes at cost of accuracy.here we take a two dimensional arrray or more precisely count-min sketch and we define this 2-D arrays height and width. height is less in no. basically it is a hash function and width is large in no. basically upto thousand columns.
let we have a 2-D array of 4 rows(hash function) and 10 columns. now when new element comes we calculate each hash function value and add 1 to its corresponding cell .i.e if a picture P arrives we calculate its hash value for all 4 hash functions and add 1 to each of 4 cells.Now if another p comes we simply increment cell value by 1 in each row and repeat for more p's that arrive to our data.
Now if a picture q arrives we calculate its hash function value and repeat above steps as we done for p.Here they can produce collisions so we increment values of cells where collision occurs.
Retrieval of data is done by taking minimum value from all cells,it is so because due to collisions some cells may contain overestimated values therefore by taking minimum we decrease the chance of overestimation.
High-level Architecture -
Lets take example of youtube. everytime user clicks a video request goes to API,API gateway routes client requests to backend services.Here we are interested only one function of API i.e log generation, where every call to API is logged.we will use these logs for counting how many times each video was viewed.Here we allocate a buffer in memory on the API gateway host , read every log entry and build a frequency count hash table we discussed before.
Here after all this Data is aggregated and sent for further processing.
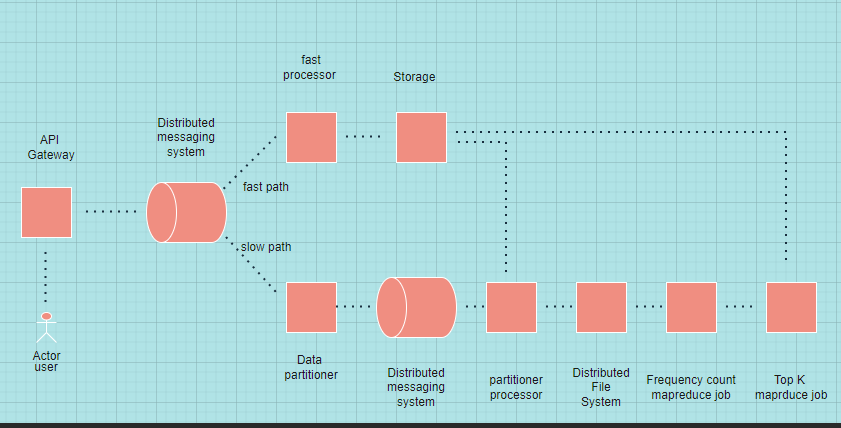
Initially aggregated data is sent to a distributed messaging system, like Apache kafka. Kafka splits messages across several partitions,where each partitions in a cluster can be placed on different machines. now we will divide our data processing pipeline into two parts : fast path and slow path.
on fast path we calculate list of K heavy hitters approximately and results will be available within seconds whereas on slow path we will calculate list of K heavy hitters precisely and here time will be in order of minutes or hours depending on volume of data.
Fast path -
This service creates count-min sketch for some time and creates aggregates data.any Fast processor host can process any message from kafka.since count-min sketch already produces approximate result It implements we already lost our data in some way but since we have our slow path doesn't lose data and gives us accurate result after an hour it doesn't bother us more.
It is simple becuase of absence of data replication in this system.
When millions of users click on video all requests are ended on API gateway hosts.thus we pre-aggregate data which reduces no. of messages going to kafka than fast Aggregator cluster will aggregates data further. and when we arrive to storage we have to deal with very small no. of request as compared to what appears on API gateway.
Slow path -
In slow path we also aggregate data but in slow path we calculate Top k heavy hitters accurately.Here we dump all of our data to the distributed file system and run two MapReduce jobs.one to calculate frequency counts and other to calculate actual top K list. Data is then stored in Storage service .
Here Data partitioner will partition data into different clusters,Partitiom Processor will read data from each partition and aggregate it further also it will aggregate data in memory batch this data in file of pre defined size and send this to the distributed file system , where either it will further processed by MapReduce or send to Storage service.
here we have just given example of different paths to send data in storage devices in real life we should choose a path which will suit the job more e.g if accuracy is not important and we want our data to process faster and need results within seconds we shoul use Fast path.and if time is not important but accuracy is we should use Slow path which utilizes MapReduce.
Data flow, fast path -
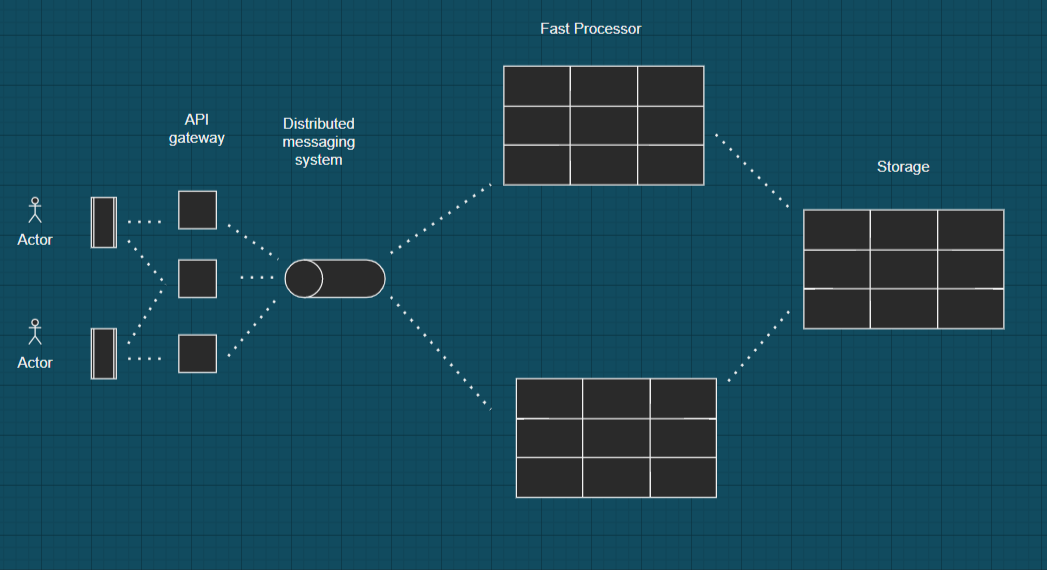
when different users watch videos on youtube than at a single point of time many users watch same video at same time so request of each video landed on API gateway hosts and information about this was captured in log files.And all of this information is stored in form of Hash tables on each host. After several minutes each hash table reaches it limits so it sends data out and sends information about particular videos and its view count so after several host messages are processed by Fast Processor hosts and all Fast processors messages are aggregated to form a single count-min sketch which ultimately send to some storage host where final count-min sketch is build and after merging similar count-min sketches we get an approximate result.
Data flow, slow path -
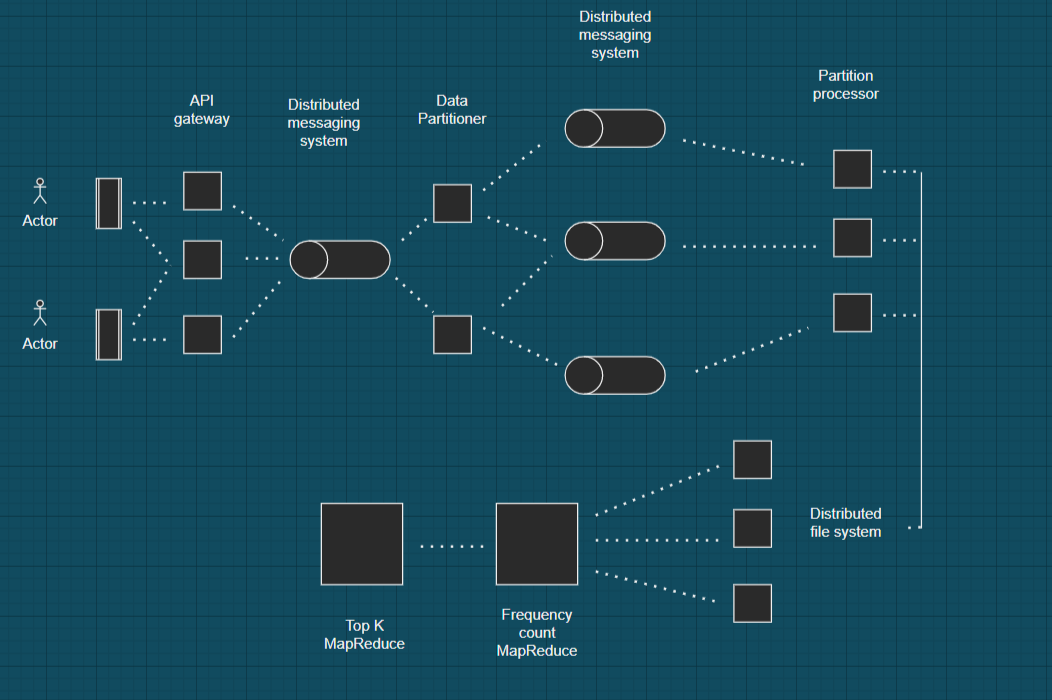
Here Data patitiomer reads each message and sends information to its own partition here each cylinder represents a partition of the Distributed Messaging System. afterwards each partition processor aggregates and accumulates data for some time in memory e.g 10 minutes and writes this data to files which are stored in Distributed File System.Afterwards Frequency Count MapReduce job reads all such files and creates a final list per some time interval And finally Top K MapReduce job uses this information the list of K heavy hitters for that hour.
MapReduce jobs-
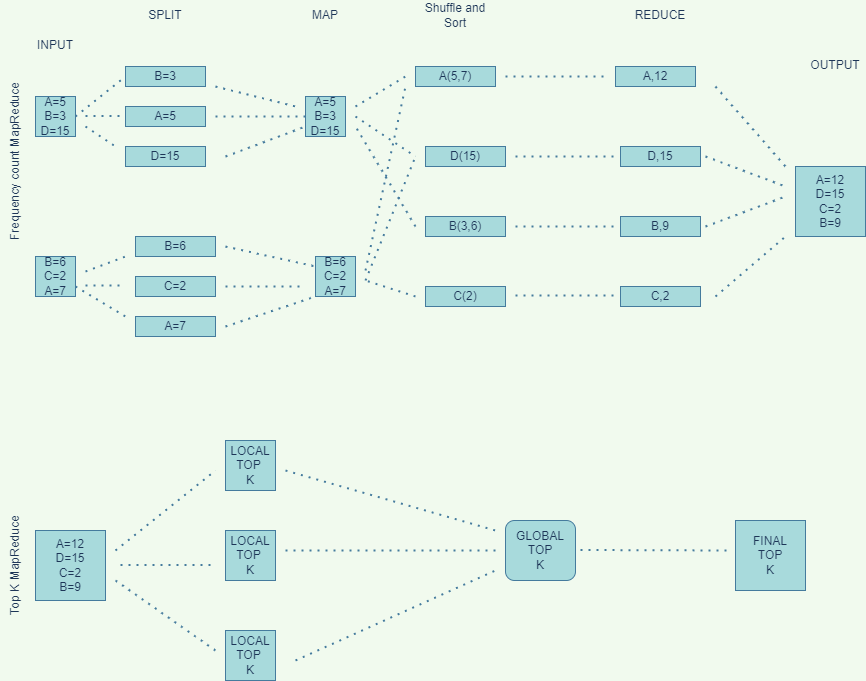
In MapReduce data processing is split into phases. Here record reader parses the data into records and passes the data to the mappers in form of key/value pairs.Partitioning specifies that all values for each key are grouped together and make sure all values of single key go to same reducer. During shuffling MapReducer takes output files produced by partitioners and downloads them to the reducing machine and sort them to group keys together. reducer than takes each key and iterates over all the values assosciated with keys.For top k heavy hitters we just sum up all the data for keys and output is written in file system. The Top K MapReduce job takes this data splits into small files and send them to mapper that calculates local top K list. and all these top K list sends to single reducer which calculate final Top K list .
Data Retrieval -
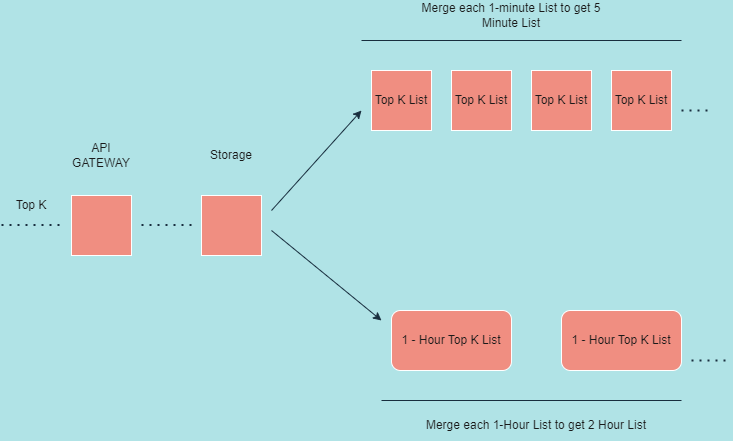
API gateways will route data retrieval calls from storage service and storage service just retrieves data from its database e.g let our fast path stores top k list after each minute and our slow path after each hour . Now if a user wants top K list after 8 minutes it just merges 8 1-minute topk lists and give us approximate results . similarly when a user wants a top K list after 4 hours best answer will be to merge 4 1-hour top K lists and give approximate results.
With this article at OpenGenus, you must have the complete idea of Top K Heavy Hitters System Design.