
Get this book -> Problems on Array: For Interviews and Competitive Programming
Table of contents:
- Overview
- Introduction to Data Visualization
- Benefits of using Data Visualization Techniques
- Different Data Visualization Techniques
- Conclusion
In this article at OpenGenus, we have explained everything you need to learn about Data Visualization techniques in Data Science.
Overview
In the world of data science where considerable volumes of information are generated and analyzed, communicating processed insights becomes vital. Data visualization transcends complexity barriers by turning raw data into useful information at different levels for various audiences. With its skillful use, their methods facilitate pattern identification while presenting complex material easily understood by varying audiences. This article at OpenGenus takes an in-depth look at key concepts, techniques, and best practices necessary for successful visualization project outcomes empowering data scientists to create impactful visual narratives essential to proactively drive organizational decision-making towards its objectives.
Introduction to Data Visualization
The representation of information by visual means is referred to as Data Visualization. Raw facts are converted into easy-to-understand graphical illustrations such as charts or maps etc., adding meaning and intuitiveness to large amounts of information when needed. The presentation leverages the human's natural aptitude for recognizing visual patterns and relationships more promptly than traditional methods alone, allowing scientists or stakeholders with graphical narratives that facilitate understanding an analysis process.
Making sense of complicated databases is where Data Visualization comes in handy since it plays a crucial role in successfully communicating complex information concisely enabling strategists access to consistently reliable insights which support decision making processes across industries. Data Visualization also plays an important role in storytelling in the field of Data Science whereby crafting visuals arranged meaningfully allows researchers opportunities for creating compelling statistical scenarios through a myriad of graphic elements making ethical appealings towards those who wish adherance while conveying critical concepts concurrently.
Benefits of using Data Visualization Techniques
Utilizing data visualization techniques brings numerous benefits to the practice of data science. Some of them are described here:
-
Those seeking improved data comprehension should consider utilizing Data Visualization methods. Visualizing raw information assists in uncovering previously hidden patterns and trends as well as building connections out of complex datasets. This approach provides valuable perspective for decision-makers in order to process vast quantities of information efficiently.
-
Data visualization makes exploration and analysis effortless by helping experts navigate through huge datasets while identifying any irregularities that might impede their investigations. Visualizations also assist in recognizing underlying structures or distributions that may not be readily apparent with surface-level observations alone. By encouraging closer inspection of these elements via visual means researchers uncover new discoveries during hypothesis testing which ultimately offers substantial support for generating an exacting conclusion.
-
Understanding how to utilize data visualization is an essential strategy to promote cooperation among groups and elevate their decision-making processes. Simplifying complex information through visually compelling presentations enables diverse perspectives and backgrounds to effectively participate in these efforts. Furthermore, this technique encourages stakeholder engagement that can contribute towards consensus-driven solutions while promoting teamwork dynamics by fostering common comprehension of shared insights.
Well, let us move ahead in this article by looking into top visualization techniques.
Different Data Visualization Techniques
Now we will explore various visualization techniques that data scientists can employ to effectively communicate insights. These techniques serve as building blocks for creating informative and visually engaging dashboards.
Following are the 14 Data Visualization techniques in Data Science:
- Bar Charts
- Line Charts
- Area Charts
- Scatter Plots
- Histograms
- Box Plots
- Pie Charts
- Heatmaps
- Geographic Maps
- Advanced Visualization Techniques
- Network Graphs
- Treemaps
- Timeline Visualizations
- Word Clouds
- 3D Visualizations
We will discuss each technique in detail.
Bar Charts
Versatile and widely-used, bar charts have become well-established as one of the best ways to visualize complex information sets. The visualization technique uses rectangular bars whose lengths represent variations within particular datasets- presenting clear differences between values at-a-glance. Whether your objective is highlighting categorical discrepancies or exploring the distribution of a selected dataset across various groupings; Bar graphs excel at creating easy-to-read visual depictions whilst maximizing the precision of statistical insight for researchers from all backgrounds.
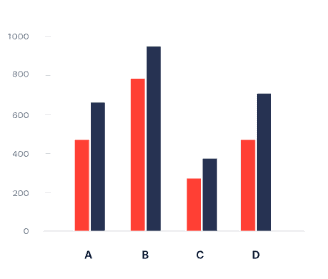
By arranging the bars horizontally or vertically, bar charts provide a clear visual representation of the relative magnitudes of the data. Grouped bar charts, stacked bar charts, and clustered bar charts offer additional capabilities for comparing multiple variables or subcategories within a category.
Line Charts
Line charts are ideal for displaying trends and patterns over time or continuous variables. They utilize a series of data points connected by lines to represent the relationship between the variables. Line charts are effective in visualizing temporal trends, cyclical patterns, and comparing multiple time series or continuous variables.
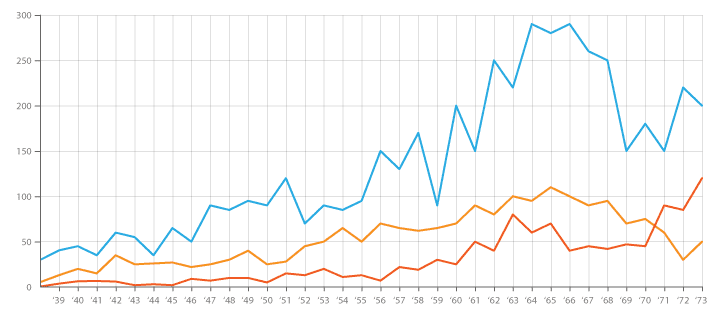
The usage of line charts proves to be highly useful in promptly detecting the overall trend, variations, and abnormalities present within datasets. Moreover, they offer a clear graphical depiction of both the pace and trajectory of alterations. When multiple lines or shaded regions are incorporated into displays generated by line charts, they become capable of exhibiting confidence intervals or possible redundancy in the data.
Area Charts
If you're seeking an efficient way to represent cumulative contributions or proportions of varying factors over time or categories, area graphs can certainly convey this effectively and efficiently. What distinguishes them from line graphs is their coloring pattern which provides clarity while comparing important information about multiple variables at once - by filling below them neatly on the graph page! That simple distinction allows for highlighting differences in magnitudes amongst different sets more clearly than other methods might accomplish without overwhelming readers or users looking for insights.
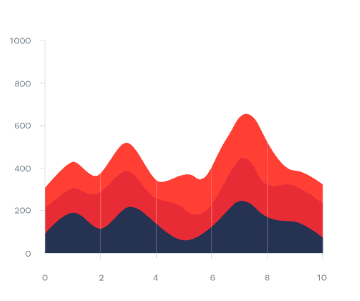
Area charts can showcase trends, compare multiple variables, and emphasize the total contribution of the variables. They are particularly useful for visualizing stacked data or displaying the progression of values over time.
Scatter Plots
A graphical representation known as a scatter plot is widely used to visualize how two continuous variables relate to each other. On these plots. Every single piece of data is displayed as a point positioned according to the values it has in relation to its counterparts.
In addition to providing visual cues about all kinds of correlations between your variables - clusters and patterns can also be observed with ease in your charts! There are also specific uses that allow for defining outliers within larger statistical constructs by examining them closely for stand out characteristics such as high variability or separation from other similar arrays.

To create informative scatter plots, adding trend lines or regression lines can aid in understanding the overall relationship and highlighting patterns.
Histograms
Histograms serve as effective graphical representations for studying the distribution of one variable. Typically constructed by dividing value ranges into equally-sized bins and using vertical bars to show frequency or count within each bin, histograms offer valuable insights relating to key characteristics such as shape, central tendency, spread and skewness.
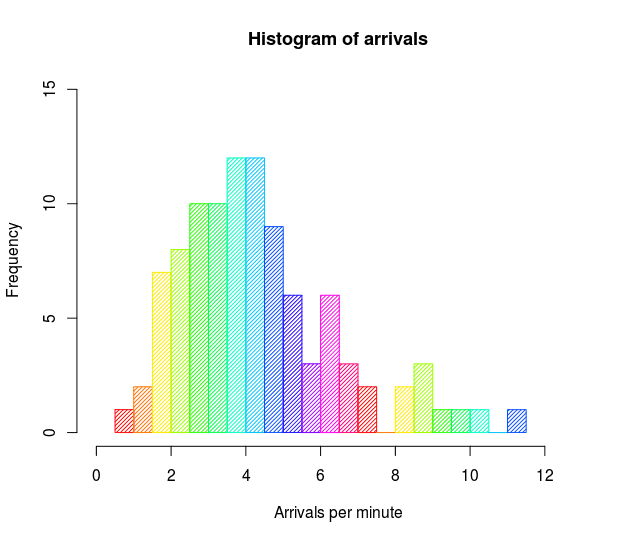
Continuous or numeric variable distributions become easier to understand with histograms which are a particularly powerful tool. They allow us to identify patterns like normal distribution, multimodality, skewness and outliers.
Effectively utilizing histograms involves selecting an appropriate number of bins for accurate results. The bars' width or height must correctly represent observations' frequency in order to achieve the best results possible. Further insights into this underlying distribution can be gained by including overlays featuring smoothed curves and reference lines.
Box Plots
Used to display distribution summaries for continuous variables, box and whisker plots (commonly referred to as Box Plots) provide concise information that includes medians and any possible outlier values in your dataset by plotting quartiles with whiskers above and below them. With their ability for side by side comparisons across different categories or groups with ease these graphical displays make them incredibly useful for analyzing your data figures quickly and effectively!
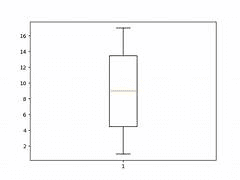
Box plots showcase the spread, skewness, and symmetry of the data, allowing for quick comparisons of central tendencies and variability. They provide insights into the range of values, the presence of outliers, and the overall distribution shape.
Pie Charts
Pie charts are circular visualizations divided into slices, where the area of each slice represents the proportion or percentage of a variable. Pie charts are useful for displaying categorical data and illustrating the composition or distribution of different categories.
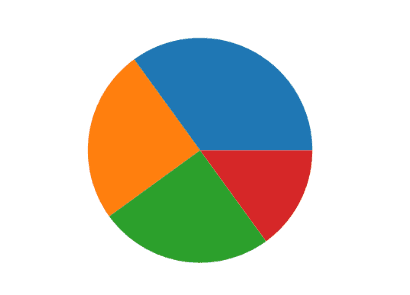
When seeking to disclose complex data, pie charts are an ideal choice. They allow important information concerning category size and contribution to become immediately evident in a visually striking manner. Notably, this graphical approach excels at highlighting proportionality while also allowing for easy comparison between multiple categories.
Heatmaps
Heatmaps are visual representations of data in a tabular format, where values are encoded as colors within cells. Heatmaps are particularly effective for displaying large datasets or matrices and revealing patterns or relationships between variables.
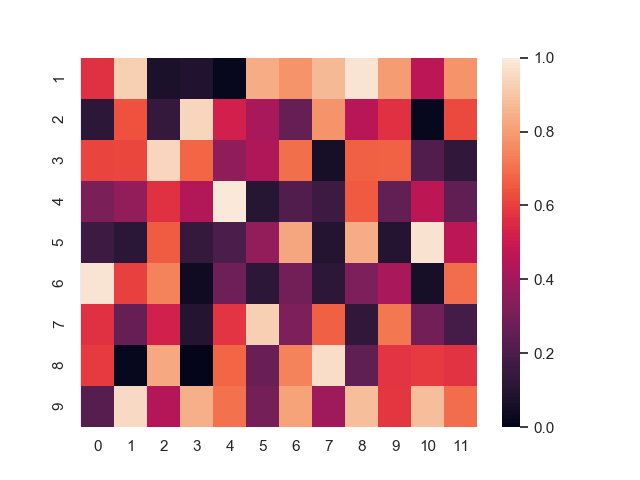
Heatmaps play an important role in numerous fields such as genomics, finance and social networking analysis by using colors on a gradient scale to represent varying magnitudes of numerical values across rows and columns.The most interesting thing is how easily it identifies higher concentration areas via clustering similar attributes possibly leading deep insight discovery.Also its easy interpretation supports wider applicabilitys.By selecting appropriate color palettes along with proportionate scaling and effective normalization strategies ensures aspects of data are highlighted.Considering adding row/column dendrograms or annotations optimizing your heatmap's interpretability.
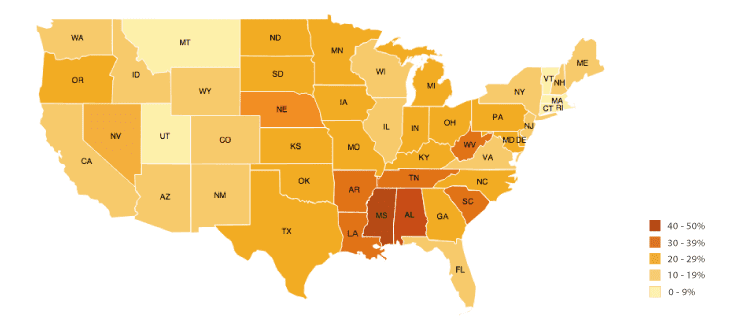
Geographic Maps
Geographic maps visualize data based on geographical locations or regions, providing insights into spatial patterns and distributions. Choropleth maps, bubble maps, and cartograms are common techniques used to represent data geographically.
Choropleth maps color regions or polygons based on a specific variable's value, allowing for comparisons across different geographic areas. Bubble maps use varying sizes of bubbles to represent the magnitude of a variable at different locations. Cartograms distort the size or shape of regions based on a particular variable, emphasizing its importance or value. The following figure describes a choropleth map.
Advanced Visualization Techniques
In this section, we will delve into advanced visualization techniques which go beyond basic charts and graphs, allowing data scientists to communicate complex information, reveal intricate patterns, and tell compelling stories with their data. They are discussed as follows:
Network Graphs
By presenting interconnected relationships visually amidst various entities, network graphs (also called node-link diagrams or network diagrams) prove to be a potent analytical tool. Nodes typically denote data points or individual subjects while the edges connote links that act as liaison between them. This method of analysis is useful in observing complex systems like social networks and hierarchical structures.

By visualizing the connections and interactions between entities, network graphs reveal patterns, clusters, and centrality within the network. They help identify key influencers, communities, or bottlenecks in the system.
To create effective network graphs, it is important to choose appropriate layout algorithms to arrange the nodes, consider using color or size to encode additional attributes or metadata.
Treemaps
The use of nested rectangles or tiles makes it possible for treemaps – an advanced visualization method –to delineate hierarchical data structures accurately and efficiently. For each category or subcategory being displayed the size of its corresponding rectangle is proportioned based on its quantitative value. Through this approach. It becomes effortless to visualize not only how various categories relate under a specific hierarchy but how quantitative values are distributed within it as well.
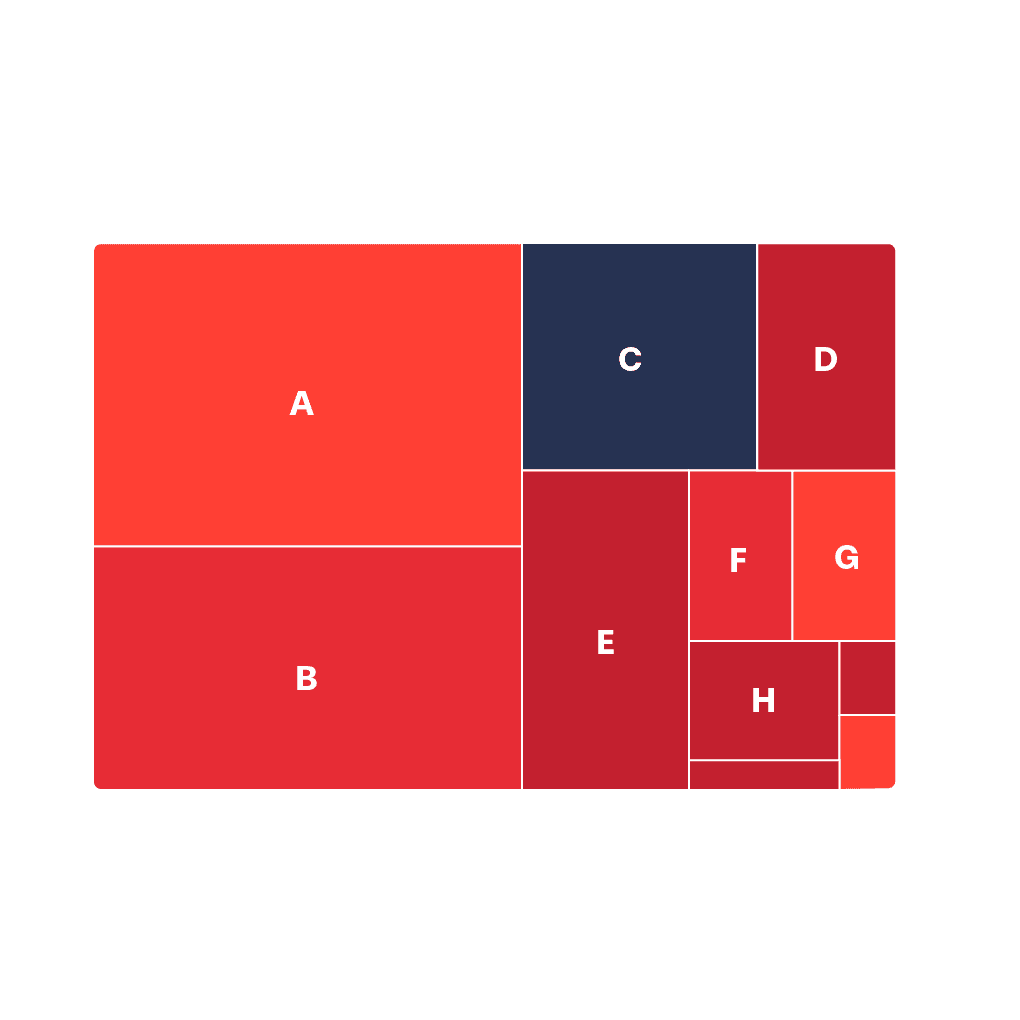
Treemaps provide an intuitive way to compare the sizes or proportions of categories and their subcategories. They are useful in analyzing the composition, hierarchy, and patterns within large datasets or organizational structures.
To create effective treemaps, it is important to choose appropriate layout algorithms to arrange the rectangles.
Timeline Visualizations
The presentation of data or events that occurred at various times can be challenging without proper temporal context. Fortunately timeline visuals effectively organize this information in a chronological manner while enhancing our understanding of patterns or trends over time.
Using different visualization styles including line charts, bar graphs or icons; timelines reveal the interrelationships between individual events by depicting their timing ,duration as well as sequence . As commonly incorporated into fields such as historical analysis ,project management ,or event planning ;timelines remain a valuable tool for simplifying complex concepts for better comprehension .
Word Clouds
Word clouds (tag clouds) employ visual representation of text data by exhibiting word size and color variations based on their relevance and occurrence rate. This method is highly effective when it comes to scrutinizing textual information for the identification of salient ideas or core themes while additionally providing a visual snapshot depicting the most crucial words within a document or dataset.
Word clouds allow for rapid recognition of often-discussed topics or words – hence they have become commonplace in text analysis, social media sentiment analysis, content summarization scenarios.
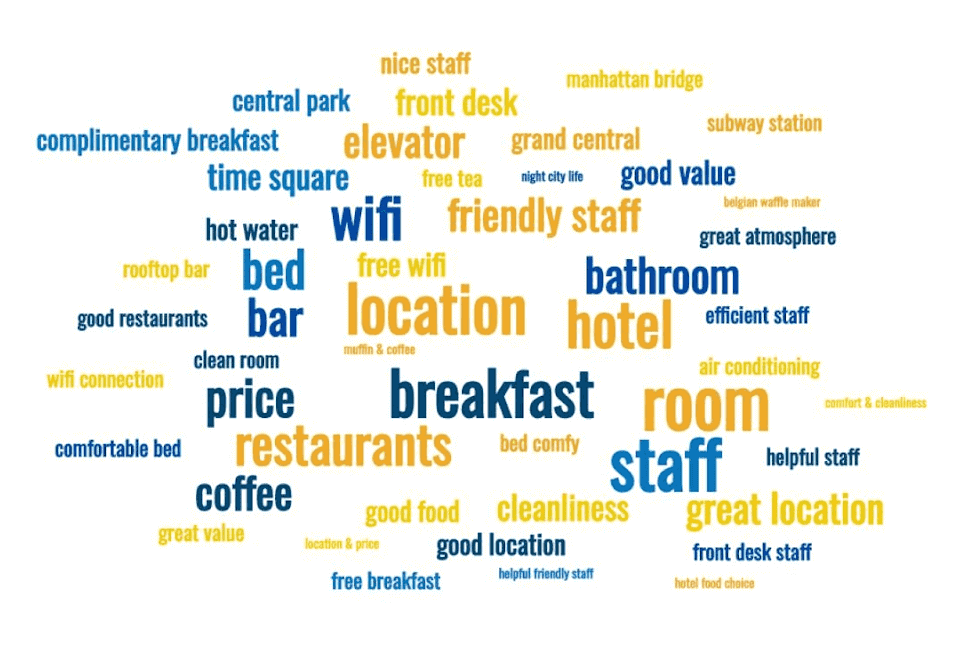
To create effective word clouds, it is important to consider the weighting or scaling of words based on their frequency or relevance.
3D Visualizations
Integrating depth as an additional dimension lets 3D visualizations provide a thorough spatial representation of data. Complex structures, volumetric data and datasets with multiple dimensions can be easily comprehended via these visuals.
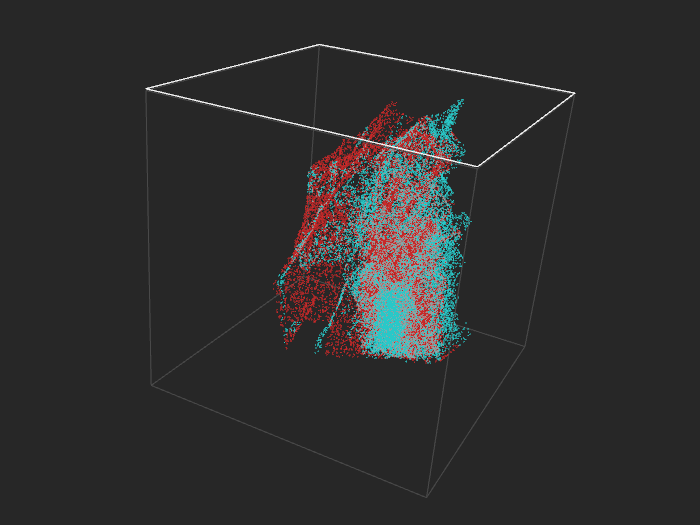
Additionally, they boost our understanding of surface contours, object interactions as well as spatial relationships. Its application extends beyond industry categorization - scientific visualization use cases are abundant along with virtual reality applications or architectural designing.
Preparing meaningful 3D visualizations involves selecting appropriate rendering techniques in conjunction with careful consideration of factors such as lighting and shading; these steps maximize viewers' ability to perceive depth effectively. The addition of interactive navigation or rotation functions can be useful in offering greater interaction with the representation presented. Yet, it is crucial not to overlook potential distortions or occlusions introduced by prioritizing aesthetics too heavily at the expense of clarity during data interpretation.
Conclusion
In conclusion, this article at OpenGenus provides a comprehensive overview of data visualization techniques and their importance in data science. The key points covered include:
- Transforming raw data into meaningful and actionable information through data visualization is crucial for conveying insights and research findings effectively.
- Leveraging the exceptional capacity of our visual system for discerning patterns and relationships, data visualization aids in comprehending and analyzing complex information.
- Implementing data visualization techniques enables us to reap numerous advantages, which comprise a better understanding, thorough exploration, and more effective collaboration in arriving at informed decisions.
- Visualization techniques such as bar charts; line graphs; scatter-plot diagrams; histograms are key essential communication instruments aiding in conveying abstract concepts.
- Scientists have extensively explored sophisticated visualization methods that involve treemaps, timeline visualizations, network graphs and 3D visualizations. Such methods facilitate the unraveling of intricate patterns by simplifying complex data for better communication.
- Each visualization technique has unique capabilities and considerations, and data scientists should choose and apply them based on their specific analysis goals and requirements.
By mastering these visualization techniques, data scientists can create visually engaging dashboards that drive informed decision-making, convey insights effectively, and contribute to organizational success.