
Even though we have discussed some interview questions based on Python programming language in the previous articles, we will discuss a few more on basics of Python here as importance of Python for data science cannot be emphasized enough.
1. What is the difference between iloc and loc?
Both iloc and loc are indexers used in pandas. loc is label based which takes in the labels i.e row name and column name to give the data in the particular field. iloc is position based which takes in the row and column numbers to return the data in the field.
df.iloc[row_position, column_position]
df.loc[row_label, column_label]
Let us consider the dataset whose header is as given below.
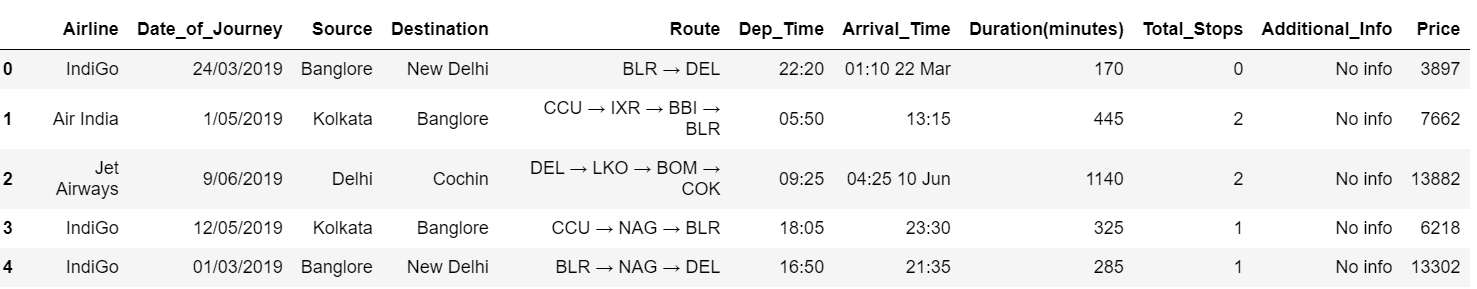
To get the name of the airline in row 1, we can use iloc and loc as follows.
data.iloc[1,0]
Output:
'Air India'
data.loc[1,'Airline']
Output:
'Air India'
2. What do you understand by pickling and unpickling?
The process of converting a python object into a byte stream to transport it over a network or for storage purpose is known as pickling. The pickle module is used here. The process of retrieving the original python object from the byte stream is known as unpickling.
3. Suppose we have a csv file in which the first 5 rows are empty as our dataset. How do we read it skipping the empty rows?
pd.read_csv('data.csv', skiprows=5)
The skiprows argument in the read_csv() function in pandas library allows us to skip the specified number of rows at the start of the dataset.
4. Normalize a 3 x 3 random matrix.
import numpy as np
x=np.random.random((3,3))
print("Original Array:")
print(x)
xmin=x.min()
xmax=x.max()
x=(x-xmin)/(xmax-xmin)
print("Normalized Array:")
print(x)
Output:

Original Array:
[[0.25858404 0.31958935 0.20011215]
 [0.95111681 0.74439355 0.54820504]
 [0.84410375 0.8325666  0.23689687]]
Normalized Array:
[[0.07785823 0.15908983 0.        ]
 [1.         0.72473772 0.46350297]
 [0.8575068  0.8421445  0.04898069]]
5. What are hstack(), column_stack() and vstack()?
hstack(), column_stack() and vstack() are ways to stack arrays in numpy.
np.vstack(([1,2,3,4],[5,6,7,8]))
Output:
array([[1, 2, 3, 4],
       [5, 6, 7, 8]])
np.hstack(([1,2,3,4],[5,6,7,8]))
Output:
array([1, 2, 3, 4, 5, 6, 7, 8])
np.column_stack(([1,2,3,4],[5,6,7,8]))
Output:
array([[1, 5],
       [2, 6],
       [3, 7],
       [4, 8]])
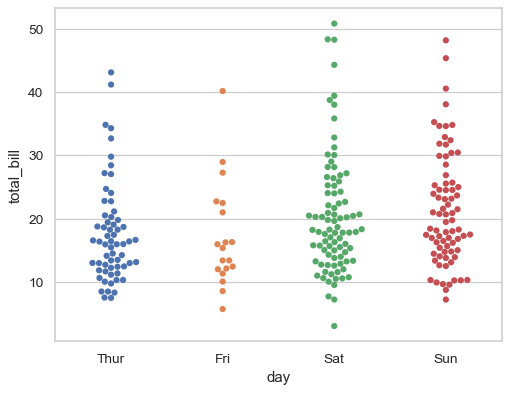
6. Explain when bee swarm and violin plots are used.
We use a bee swarm plot when we want a good representation of distribution of the values in our dataset. It is created using the swarm() function in seaborn library. One disadvantage is that it does not scale well for large number of observations.
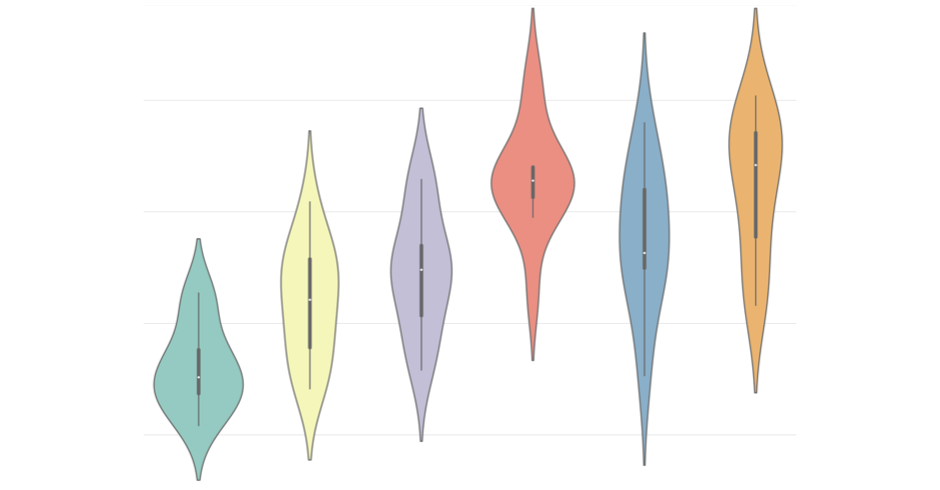
A violin plot is similar to a box plot and it used when we want to see the distribution of a numeric data. This is useful when we need to compare multiple groups. Unlike a box plot, violin plots give us a deeper understanding of the density.
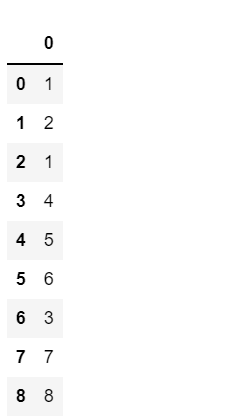
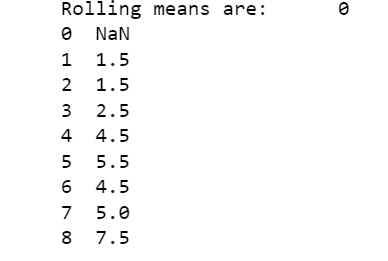
7. How to calculate rolling average of a variable?
Rolling average is also known as moving average. Here, a window size is declared (say k). The average of first k observations is calculated and stored. Then the first number is dropped and the next number is added to the window. Now the average of these k observations is found. Thus this goes on till the all the observations are covered. This can simply be performed by df.rolling().mean() function.
a=[1,2,1,4,5,6,3,7,8]
data=pd.DataFrame(a)
data
Output:
data.rolling(window=2)
print("Rolling means are:",data.rolling(window=2).mean())
Output:
8. What are the 3 methods provided by the "re" module to modify strings?
The Python module "re" provides three methods to modify strings. They are split(), sub() and subn().
- The split() function uses a regex pattern to “split” a given string into a list.
- The sub() function finds all substrings where the regex pattern matches and then replaces them with a different string.
- The subn() function is similar to sub() function. It also returns the new string along with the number of replacements.
9. In matplotlib subplots, how do you adjust the spacing between them?
We use the subplots_adjust() function for this purpose. We need to provide left, right, bottom and top values as fractions of the height and width of the figure. Since all the values are measured from the left and bottom of the figure, we must keep in mind that right and top cannot be lower than left and bottom.
10. How does using list.sort() and sorted() on lists affect the output?
The list.sort() function sorts the list and saves the sorted list. This sorts the list in-place, which means that the list indices are mutated and the original list is not retained.
x=[6,3,7]
x1=x.sort()
print(x,x1)
Output:
[3, 6, 7] None
The sorted() function sorts the list and returns a new sorted list. It does not affect the original list.
x=[6,3,7]
x2=sorted(x)
print(x,x2)
Output:
[6, 3, 7] [3, 6, 7]
11. How to generate a sparse matrix?
We can generate a sparse matrix using the rand function in the scipy.sparse module.
Syntax: rand(m, n, density, format, dtype, random_state)
where:
- m, n : integer value of the shape of the matrix
- density : This specifies the density of the generated matrix and is optional. (density=1 means a full matrix and density=0 means a matrix with no non-zero items)
- format : This is the sparse matrix format and is an optional string value.
- dtype : This specifies the type of the returned matrix values and is optional.
- random_state : This is an optional random number generator or random seed. If not given, the singleton numpy.random will be used.
from scipy.sparse import rand
x = rand(4, 3, density=0.25, format="dense", random_state=42)
x
Output:
matrix([[0.05641158, 0.        , 0.        ],
        [0.        , 0.        , 0.65088847],
        [0.        , 0.        , 0.14286682],
        [0.        , 0.        , 0.        ]]
12. What is Flask?
Flask is written in Python and it does not need specific tools or libraries and hence is a micro web framework. It depends on the Jinja template engine and the Werkzeug WSGI toolkit and makes it easy for the developers to create web applications in Python.
13. How to calculate the sum of a small array faster than np.sum()?
x=np.array([1,2,3,4,5,6])
np.add.reduce(x)
Output:
21
14. What is the use of extend()?
extend() is a list function that takes in a list of arguments, iterates over each of them and adds them to the list thus extending it.
a=["Sam",4,6,"Alex"]
a.extend(["Chris","Dolly",3])
a
Output:
['Sam', 4, 6, 'Alex', 'Chris', 'Dolly', 3]
15. What are the different methods to extract the integer part of a random array?
The different ways to extract the integer part of a random array are given below:
x=np.random.uniform(0,10,5)
print(x)
print(x-x%1)
print(np.floor(x))
print(np.ceil(x)-1)
print(x.astype(int))
print(np.trunc(x))
Output:
[1.01406434 8.57057873 4.98096286 2.69202105 1.91406664]
[1. 8. 4. 2. 1.]
[1. 8. 4. 2. 1.]
[1. 8. 4. 2. 1.]
[1 8 4 2 1]
[1. 8. 4. 2. 1.]
16. What are * args and ** kwargs? When do you use them?
Both * args and ** kwargs are used when we do not know the number of arguments that will be passed to a function. We mention * args as the argument to pass a variable number of arguments to a function ** kwargs when we want to pass a keyworded argument list of variable length.
17. How are the functions del(), clear(), remove() and pop() different from each other?
- del() is used to delete a value at a particular index or position in a list.
- clear() clears the entire list.
- remove() deletes the specified value from the list.
- pop() removes the last element of the list and returns it.
18. When are pivot_table and crosstab used?
A crosstab is used to format and summarize the data easily. The default value of aggfunc is 'None' in the pandas crosstab() function. By default it computes a frequency table of the factors unless an array of values and an aggregation function are passed.
A pivot_table() function is used to create a spreadsheet style pivot table as a dataframe. The default value of aggfunc here is 'mean'.
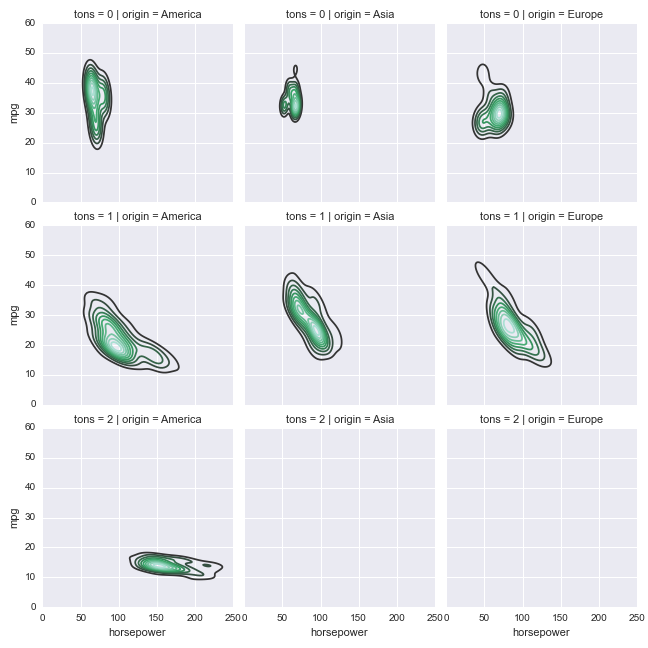
19. What is a FacetGrid?
A FacetGrid can be created using the seaborn.FacetGrid() function. It is a multi-plot grid that uses many panels to visualize relationship between many variables and distribution of a single variable separately within subsets of the given dataset. It can be created using 3 dimensions- row, column, hue. The function takes a dataframe and the names of variables for the dimensions as input.
20. Name some Python packages for data science.
Some Python packages used for data science are:
- Matplotlib and Seaborn - for creating compelling visualizations.
- Numpy - to create and handle n-dimensional arrays and matrices.
- Pandas - for high-performance data manipulation and analysis.
- TensorFlow - for constructing computational graphs on which neural networks and many other machine learning models depend.
21. How to flatten a matrix?
We can flatten a matrix by simply using the flatten() function available in the numpy library.
matrix=np.array([[1, 3, 2],
                    [5, 6, 9],
                    [7, 8, 4]])
print(matrix.flatten())
Output:
[1 3 2 5 6 9 7 8 4]
22. Explain decorators and generators.
Functions that return iterable or traversal objects are known as generators. They are used to create iterators. A generator function contains at least one "yield" statement. Decorator functions are the ones which allows us to modify classes, methods and functions.
23. What do you understand by list comprehension?
List comprehension provides a simpler way to create lists from other iterables like lists, tuples, strings, etc.
a= [x**3 for x in range(10)]
a
Output:
[0, 1, 8, 27, 64, 125, 216, 343, 512, 729]
24. What is monkey patching?
Monkey patching is a technique that comes handy in testing as it helps the programmer to extend or modify other codes during runtime. But using it in production environment makes it difficult to debug the code.
25. Find the output of the below code.
def func( i=[]):
    i.append(1)
    return

func()
func()
The above code returns the following output:
[1]

[1, 1]
Since the argument of the function 'func' is a list, 1 is appended to the list every time the function is called.
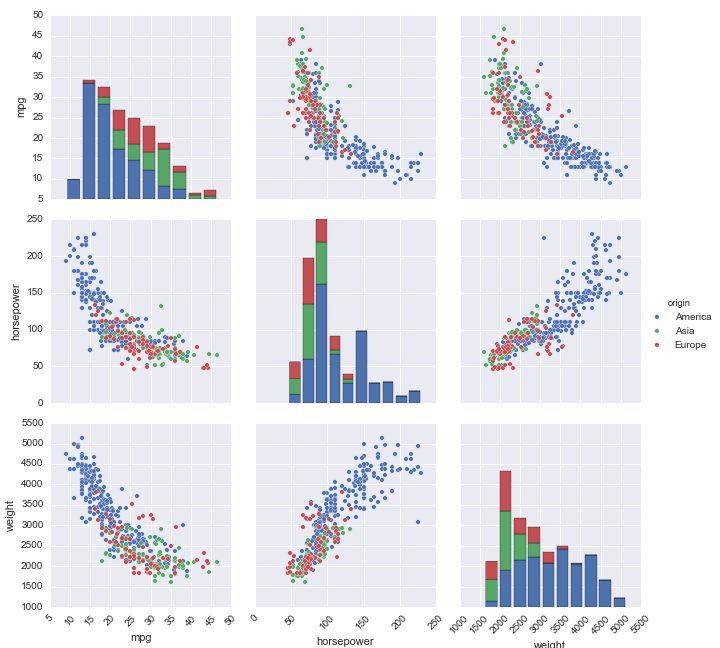
26. What is a Pairplot?
This shows the relationship between a pair of columns of our dataset as a matrix of axes. The diagonals show the data distribution for the variable itself.
27. List some of the categorical and distribution plots.
Categorical plots:
- Box plot
- Bee swarm plot
- Cat plot
- Strip plot
- Violin plot
- Bar plot
- Count plot
Distribution plots:
- KDE plot
- Histogram/ histplot
28. Which tool in Python will you use to find bugs if any are there?
Pylint and Pychecker are the two tools used to find bugs. Pylint check the module and verifies whether or not the coding standards are met and Pychecker is a static analysis tool that helps find bugs in the code.
29. Write a function that reverses the string.
def reversed_string(sentence):
    return sentence[::-1]

sentence = input("Enter string:")
reversed_string(sentence)
Output:
Enter string: I love Data Science!
'!ecneicS ataD evol I'
30. Write a function in Python that returns the sum of the diagonals of the matrix. Only include the sum of all the elements on the primary diagonal and all the elements on the secondary diagonal that are not part of the primary diagonal.
def diagonal_sum(mat):
    n = len(mat)
    output = 0
    for i in range(n):
        output = output+mat[i][i]
        if i!=n-i-1:
            output = output+mat[i][n-i-1]
    return output

# test case
mat = [[1,1,1,1],
       [1,1,1,1],
       [1,1,1,1],
       [1,1,1,1]]

diagonal_sum(mat)
Output:
8
31. Differentiate between range, xrange, and arange.
- range() function returns a sequence of integers as a Python list.
- xrange() function returns a generator object or a range object and the particular range is displayed only on demand.
- arange() is a Numpy function that can also return fractional values.
32. Defanging an IP address
Defanging an IP address means to simply replace "." with "[.]"
def ip_address(address):
    new_address = ""
    split_address = address.split(".")
    separator = "[.]"
    new_address = separator.join(split_address)
    return new_address
ipaddress = ip_address("192.168.1.1")
print(ipaddress)
Output:
192[.]168[.]1[.]1
33. What is the buffer containing the actual elements of the array?
ndarray.dataitemSize is the buffer that contains the actual elements of the array.
34. How do you export a dataframe as a CSV file after hiding header and index labels?
df.to_csv(‘/file.csv’,index=False,header=False)
The above code is used for exporting a dataframe as a CSV file after hiding header and index labels.
35. What is vectorization in Pandas?
The process of running operations on the entire array is known as vectorization. This can be done to cut back the amount of iterations performed by the functions. Pandas have a variety of vectorized functions (eg: aggregations) that are optimized to operate specifically on series and dataframes. So using vectorized pandas functions execute the operations quickly.