
In this article, we will see the flow of a technical interview for a Data Science job and here, we will assume an imaginary candidate for the purpose of understanding how it really works.
Technical interviews are usually done to see if we possess the required technical knowledge for the position. It may take place via video conferencing, phone call or in-person. Depending on the seniority of the position and the company, it may consist of several rounds that may take up a whole day! In this interview, we can expect any type of question from the basics to the brain-teasers which makes this round need rigorous practice and clarity of technical concepts.
Interviewer : Tell me about yourself.
Since this is the first interaction of yours with the interviewer, you should make sure that you give a solid answer. Talk about your educational background and elaborate on your technical skills that are relevant to the position. Also talk about your previous experiences (if any) and do mention the projects you did that you feel will be an added bonus. These will serve as a framework for the direction in which the interview goes. Do not mention something until you are confident enough to answer questions on them if asked.
Let us say that our imaginary candidate talks about his ML projects as follows:
I have worked on several machine learning projects. Some of the mention worthy ones are the "Cricket world cup prediction", "Movie recommendation system" and "Cancer prediction".
Interviewer : Since you say that you have worked on Cricket world cup prediction, which algorithm did you use and why?
Here, you can explain your choice of algorithm for your project and why did you choose them. Make sure that your reason is backed up with data while you mention them. One possible answer of our candidate is given below.
I chose to solve the problem using supervised learning techniques. I compared several models like Logistic Regression, Support Vector Machines, Random Forests and K Nearest Neighbors on a performance metric before choosing one. I eventually went with Random forest as it was the best performing model for the given problem with 80% training and 75% test accuracy.
Interviewer : Can you explain the Random Forest algorithm?
Random forest is a collection of many random decision trees and this comes under ensemble learning. It is much less sensitive to the training data unlike decision trees. In layman's language, the whole algorithm can be summarized as follows:
- Create a number of datasets from our original dataset using bootstrapping.
- Randomly select a subset of features for each tree and use only them for training a decision tree on each dataset.
- The final result is obtained by passing the data points through every tree and averaging the results obtained from each. Instead of averaging, majority voting can also be used. This is called aggregation.
Interviewer : What is bagging?
Bagging is an ensemble learning method. It stands for bootstrap aggregating. In this method, we first data using bootstrapping. In bootstrapping, we generate multiple samples of size N from an existing dataset. Multiple models are trained in parallel using these bootstrapped data. In short, it is a jargon for bootstrapping + aggregation.
Interviewer : What is multicollinearity and how does it affect random forest algorithm?
When there is correlation present between the independent features, then this scenario is called multicollinearity. It does not affect the random forest algorithm as much as it affects the logistic regression algorithm. Since random forest uses bootstrapping and feature sampling, the algorithm is not affected by multicollinearity that much.
Interviewer : How do you detect outliers?
Depending on the kind of data we are working with, there are 4 methods to detect outliers:
- For single variable, we can say that values beyond 1.5 times the inter quartile range are outliers.
- For a labeled dataset, we can build a binary classifier to detect outliers.
- For an unlabeled dataset, we can use anomaly detection models to detect outliers.
- For detecting outliers in a time series data, both supervised and unsupervised models can be used. Eg: Mean absolute deviation, DBSCAN.
Interviewer : Since you mentioned supervised and unsupervised learning, can you point out the differences between them?
Supervised learning:
- Uses labeled data as inputs
- Is computationally easier
- Has a feedback mechanism
- Used for prediction and classification models
Unsupervised learning:
- Uses unlabeled data as inputs
- Is computationally complex
- Do not have a feedback mechanism
- Used for finding underlying patterns in unlabeled data and arriving at conclusions.
Interviewer : Take any dataset of your choice, can you code a simple classifier?
from  sklearn import  datasets
iris=datasets.load_iris()

X=iris.data
y=iris.target

from sklearn.model_selection import train_test_split
X_train,X_test, y_train,y_test=train_test_split(X,y,test_size=0.2)

from sklearn.neighbors import KNeighborsClassifier
knn=KNeighborsClassifier()
knn.fit(X_train,y_train)
prediction=knn.predict(X_test)
from sklearn.metrics import accuracy_score
print(accuracy_score(y_test,predictions))
Interviewer : I see that you have used accuracy as your performance metric. Why was it your choice?
For evaluating classification models, accuracy is the most used metric. The reason being that it is easy to calculate and summarizes the model's capability with a single number. Accuracy tells us about the model's performance across all classes and especially comes in handy when all the classes in the dataset are of equal importance as in the iris dataset considered above.
Interviewer : What are the other ways to check the performance of a model that you know?
The other ways to check a model's performance are:
- Confusion Matrix
- Precision and Recall
- F1 score
- ROC or Receiver Operating Characteristic Curve
Interviewer : What are the different types of biases that you are familiar of?
- Selection bias - When a sample obtained is not representative of the population intended to be analyzed.
- Survivorship bias - Tendency to draw conclusions on things that have survived a selection process.
- Automation bias - Tendency to favor results generated by automated systems over the ones generated by non-automated systems.
- Implicit bias - When assumptions are made based on one's personal experiences and mental models.
- Sampling bias - It comes under selection bias and is when the data is not randomized properly during collection.
Interviewer : What are the different types of sampling techniques?
There are four main sampling techniques. They are:
- Systematic sampling
- Stratified sampling
- Cluster sampling
- Simple random sampling
Interviewer : Explain stratified sampling.
In stratified sampling, the population is divides into a number of subgroups based on certain characteristics relevant to the population. Next we calculate the number of samples to be taken from each subgroup based on the overall proportion of the population and then use either systematic or simple random sampling to select samples from each subgroup.
Interviewer : How would you rate your python skills out of 10?
For this question, give a number that best describes your python coding skills. It is important to be honest here and it is mandatory that we are well-acquainted with python before we sit for a Data science interview. Let's say our candidate says that his coding skills are an 8 on 10.
Interviewer : You are given a table containing assignment scores of students in a class. Write a query that identifies the largest difference in total score of all assignments. Output just the difference in total score between the two students. The table that is to be used is box_scores and has following columns.
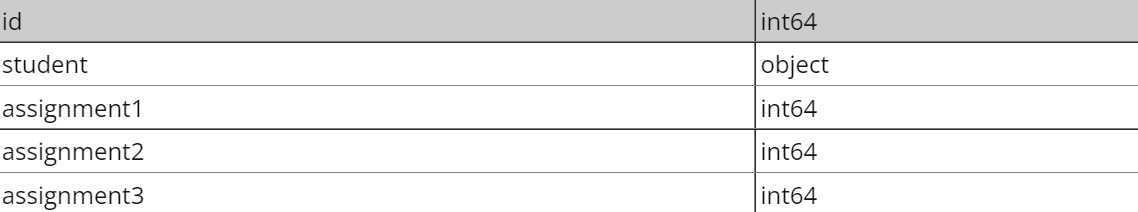
As the first step, create a dataframe with the same name and the given columns and enter some records into it. Then the further steps are given below.
import pandas as pd
import numpy as np
box_scores['total_score'] = box_scores['assignment1']+box_scores['assignment2']+box_scores['assignment3']
box_scores['total_score'].max() - box_scores['total_score'].min()
Interviewer : Are NumPy arrays better than Python lists? If yes, how?
Yes, NumPy arrays are better than Python lists as they fare better in terms of performance, size and functionality. NumPy arrays are faster than lists and tend to take up less memory space. NumPy also has many built-in functions for algebraic operations.
Interviewer : Write a function called find_bigrams that takes a sentence or paragraph of strings and returns a list of all bigrams.
def find_bigrams(text_lst):
    result = [a for ls in text_lst for a in zip(ls.split(" ")[:-1], ls.split(" ")[1:])]
    return result
text = "I love Python programming"
print("Original:")
print(text)
print("\nBigram sequence:")
print(find_bigrams(text))
What are lambda functions?
Lambda function in Python is an anonymous function. It can have only one expression but can take many arguments. When the function we need to define is only of a single line, we need not separately define it using many lines of code and instead can use lambda function to achieve the same job in just a line.
This is just a scaled-down version of an actual technical interview. Far more number of questions from varied topics (related to data science, of course) are asked and our skills are extensively tested. Sometimes product-based companies like Google, Facebook and Uber might ask questions based on the services they offer too! It is wise to research the company thoroughly before we sit for an interview.