
In this article, we will get to know the flow of a statistical interview for a data science job with actual questions with sample answers.
As we all know, machine learning is a modern name for statistics and a data scientist is a new-age name for a statistician. Statistical interview round is a part of the technical rounds of interviews where our knowledge in probability and statistics - both basics and advanced concepts are tested out. This generally spans for a maximum of an hour. Sometimes, it may even be shorter! Here, we will skip the customary introduction part and dive right in to the questions.
Interviewer: What is the central limit theorem?
The central limit theorem states that "As the sample size becomes larger, the distribution of sample means approximates to a normal distribution curve."
As an example, we can take a sample from any dataset and calculate its mean. Now we plot this value. Once we repeat this process multiple times, we see that all the sample means and their frequencies would resemble a normal distribution. The mean of this obtained distribution will closely resemble the mean of the original dataset.
Interviewer: What general conditions must be satisfied for the central limit theorem to hold true?
The general conditions that must be satisfied for central limit theorem to hold good are:
- The sample values must be independent of each other.
- The samples must be chosen in a random manner.
- The sample size must be large enough; generally the threshold value is 30.
Interviewer: When you sample, what potential biases can you be inflicting?
The potential biases that can happen while sampling are:
- Sampling a very small amount of observations - Under coverage bias.
- Not choosing samples in a random manner - Sampling bias.
- Overlooking observations that did not get past some form of selection test/criteria - Survivorship bias.
Interviewer: What are some of the low and high-bias machine learning algorithms?
Some of the low-bias machine learning algorithms are Support vector machines, Decision trees and K-nearest neighbors. Some of the high-bias ML algorithms include Logistic regression, linear regression and linear discriminant analysis.
Interviewer: What is the difference between a sample and a population?
| Population | Sample |
|---|---|
| Set of all the elements that are taken under consideration for the statistical test. | A subset of the population that is used to explore some aspects of the it. |
| Numbers obtained from population are known as parameters. | Numbers obtained from sample are known as statistics. |
Interviewer: A diet pill is given to 9 subjects over six weeks. The average difference in weight (follow up — baseline) is -2 pounds. What would the standard deviation of the difference in weight have to be for the upper endpoint of the 95% T confidence interval to touch 0?
Upper bound = mean + t-score*(standard deviation/sqrt(sample size))
0 = -2 + 2.306*(s/3)
2 = 2.306 * s / 3
s = 2.601903
Hence, the minimum standard deviation in the above scenario is 2.60 approximately.
Interviewer: What is meant by an inlier?
While an outlier is an erroneous data value that lies on the tail of a particular distribution, an inlier is such a data value that lies on the interior of the distribution. It is more challenging to find an inlier than it is to spot the outlier.
Interviewer: Can you state the applications of long tailed distributions?
Long tail is the part of the curve that is towards the end. It usually gets narrower as it extends towards the ends. Such long tailed distributions are used in classification and regression problems, to demonstrate Pareto principle and to represent various real life distributions such as the product sales.
Interviewer: State the Pareto principle.
Pareto principle is famously known as the 80/20 rule. It states that 80% of the outcomes or results in an experiment comes from 20% of the causes. It is also known as the law of the vital few.
Interviewer: How do you define skewness?
Skewed data cannot be used to create normal distributions. It denotes that the data has a significant difference between the mean, median and the mode and is non-symmetric relative to them.
Interviewer: Could you explain left- and right-skewed distributions?
In a left-skewed distribution, the left-tail is longer than the right one and the mean, median and mode are inverses on one another. In a right-skewed distribution, the right-tail is longer than the left and the mean > median > mode.
Interviewer: If a distribution is skewed to the right and has a median of 30, will the mean be greater than or less than 30?
Since it is a right-skewed distribution, given the median is 30, the mean should be greater than 30 and the mode less than 30.
Interviewer: What is a confounding variable?
A confounding variable is an extra variable that gives wrong estimates hence leading to useless results. It is related to both independent an dependent variables.
Interviewer: Infection rates at a hospital above a 1 infection per 100 person-days at risk are considered high. A hospital had 20 infections over the last 1800 person-days at risk. Give the p-value of the correct one-sided test of whether the hospital is below standards.
We use Poisson distribution as here, we are looking at the number of infections within a given time.
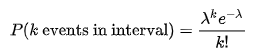
Null hypothesis:1 infection per person-days
Alternative hypothesis:>1 infection per person-days
The alpha level which denotes the level of significance is assumed to be 5%.
k (actual) = 20 infections
lambda (theoretical) = (1/100)* 1800
p = 0.07980 or 7.980%
Since the p-value > alpha, we accept the null hypothesis and come to a conclusion that the hospital is not below standards.
Interviewer: A HIV test has a sensitivity of 98.7% and a specificity of 96.5%. A subject from a population of prevalence 0.2% receives a positive test result. What is the precision of the test (i.e the probability he is HIV positive)?
The formula for precision is given below.
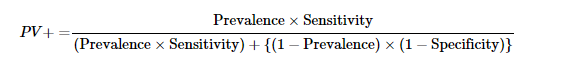
Here, PV stands for the positive predictive value, which is denotes the precision. Substituting the values in the above formula, we get:
PV = (0.002* 0.987)/[(0.002* 0.987)+((1–0.002)* (1–0.965))]
This gives precision (PV) to be 0.0535 or 5.35%