
In this article, we have discussed 35 advanced data science questions asked in interviews.
1. What is the approach you take to solve any data analytics based project?
We generally go along with the 6 phases:
- Ask - First, we ask effective questions to define and understand the business problem.
- Prepare - We find out what data is needed and collect it from various sources
- Process - We then clean the data treating all the outliers, missing values, transform variables and check for its validity and integrity.
- Analyze and build - Then, its time to analyze the data and identify the patterns and arrive at conclusions. In case a ML model is involved, we build the model, train and test it.
- Share - Then we share the results with our peers and stakeholders.
- Act - This is the last stage where we implement our results, deploy the model and track its performance.
2. How regularly should a machine learning algorithm be updated?
We do not update ML algorithms on a regular basis as this hinders the well-defined steps of how the problem is solved and also creates problems in the systems that are already implementing the algorithm. We update the algorithm only in any of the following cases:
- If we find that the algorithm is not efficient in solving the problem and it under performs. In that case, we replace it with a better algorithm.
- In case of non-stationarity.
- If the structure of the underlying data changes.
- If we need the model to evolve as data flows in.
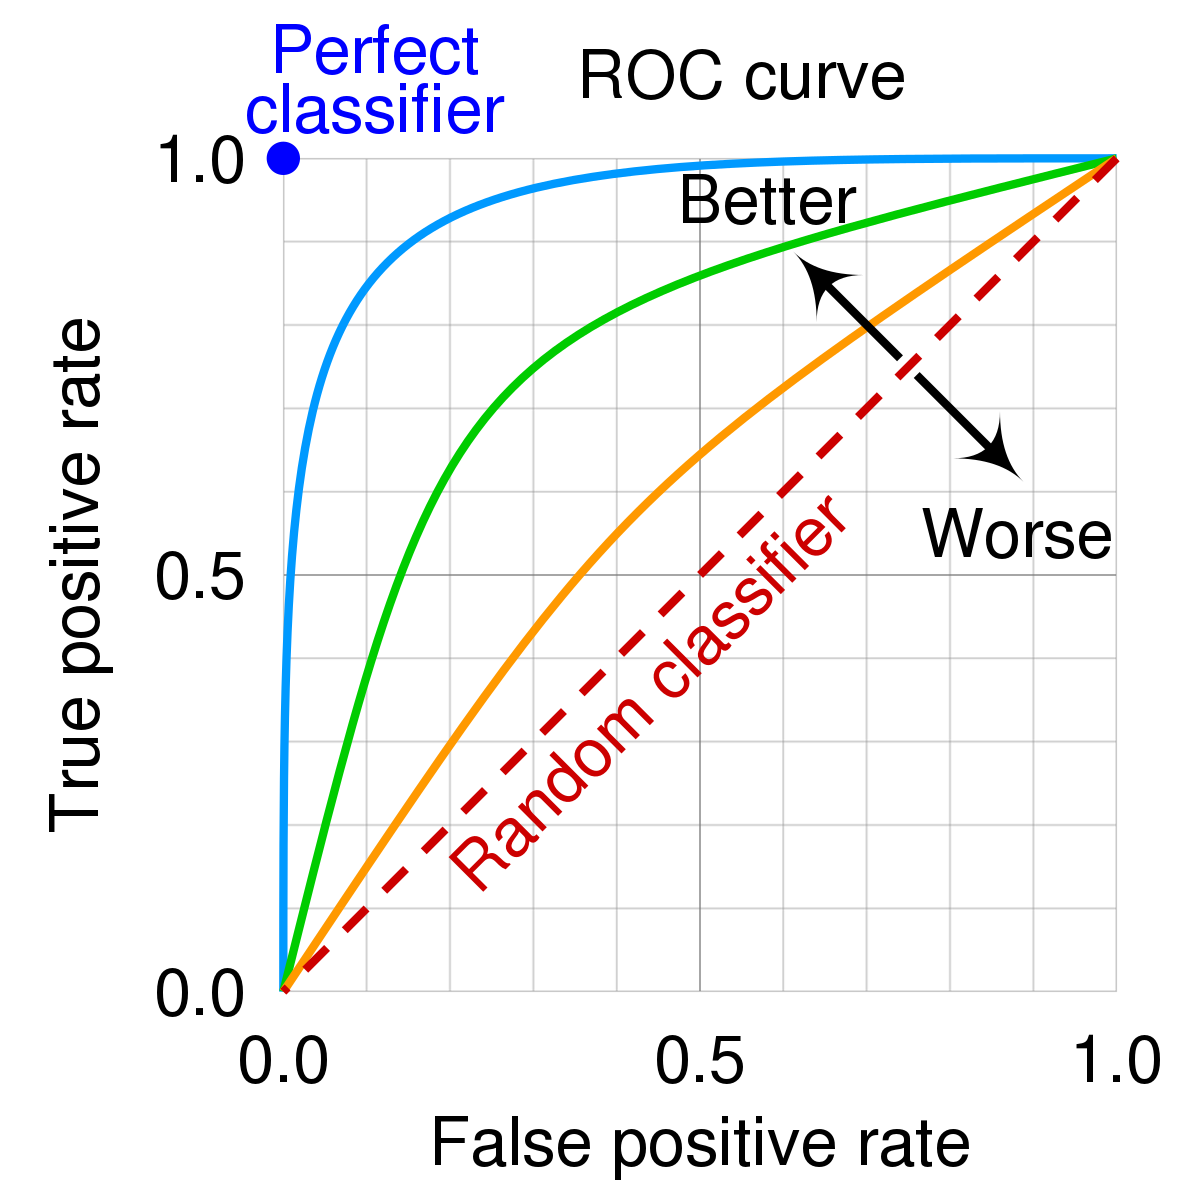
3. What is ROC curve and how to create it?
The Receiver Operating Characteristic (ROC) curve is a plot between true and false positive rates at different thresholds. It tells us how much the model is able to distinguish between classes and gives us a trade-off between sensitivity and specificity.
It is created by plotting the true positive rates against the false positive rates, where true positive rate is the proportion of positive observations that were correctly predicted as positive out of the overall positive observations and false positive rate is the proportion of observations that were incorrectly predicted as positive out of the overall negative observations.
4. How is regularization used to perform feature selection?
The regularization adds penalties to various parameters in the ML model in an attempt to reduce its freedom and avoid overfitting. Regularization methods like the L1 and L2 are used widely. The L1 is also known as LASSO (Least Absolute Shrinkage and Selection Operator) regression that adds the absolute value of the coefficient as penalty. It is capable of shrinking some features to 0 thus eliminating them from the model.
5. What is a Generative Adversarial Network?
A generative adversarial network (GAN) is an unsupervised machine learning task that has 2 main components: a generator model and a discriminator model. These models learn the patterns in the input data in such a way that it is able to generate output samples that likely belong to the original dataset.
The generator model keeps on generating new samples and the job of the discriminator model is to classify the samples as real (belonging to the original dataset) or fake (generated). The two models are trained together in an adversarial or zero-sum condition until the generator is generating more plausible samples.
6. Let us say that our laptop’s RAM is only 4GB and you want to train your model on 10GB data set. What will you do in such a situation?
First we need to know the type of model we are training. The two types that can be trained under such situations are neural networks and support vector machines (SVMs).
For training neural networks:
In this case, we can use a Numpy array to load the entire dataset as it never stores the whole of it and just creates mappings. Then, we can get the desired inputs by indexing the Numpy array and pass these as inputs to the neural networks while maintaining a small batch size.
For training support vector machines:
The advantage of using SVM is that we can obtain smaller portions of the dataset i.e subsets of the original dataset by using the partial fit function and this can be repeated to obtain other subsets too.
7.Why is TensorFlow the most preferred library in deep learning?
The reason why TensorFlow is the most preferred deep learning library is that it has faster compilation speed than other libraries like keras and pytorch. It supports both GPU and CPU computing devices and provides both C++ and Python APIs making it very easy to work with compared to the other libraries.
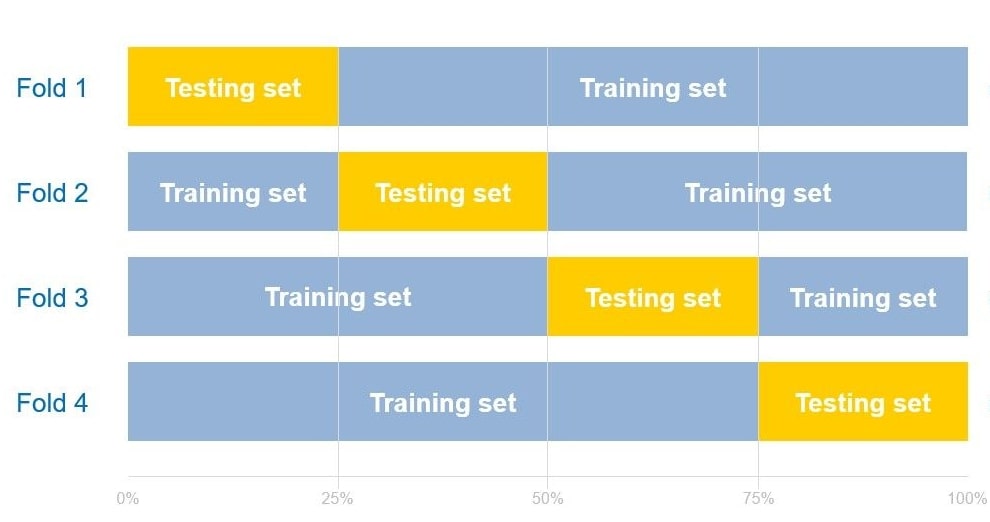
8. What do you understand by cross-validation?
Cross-validation is a technique used in machine learning to improve the performance of the model. We can also call it as a technique for asserting how well the model generalizes to an unknown dataset. Here, the training data is split into different groups, the number of which are usually specified by the programmer. The model will then be trained, validated and tested against these groups in rotation. The various types of cross-validation methods are:
- K-fold
- Stratified K-fold
- Leave-p-out
- Leave-one-out
- Holdout
Given below is a visual representation of 4-fold cross validation (k=4).
9. What are exploding and vanishing gradients?
Let us say we are training a RNN model and as the backpropagation algorithm moves from the output layer towards the input layer, the gradients often become smaller. The problem of the slope becoming too small is known as vanishing gradient problem. This reduces the performance, increases the training time and results in the gradient descent never converging to the optimum.
In the same scenario, instead of getting smaller, if the gradients grow exponentially larger causing huge updates in the weights of the model, it is known as exploding gradient problem. This causes the gradient descent to diverge.
10. Linear regression is carried out under some assumptions. What are they?
The assumptions under which linear regression is done are:
- There is a linear relationship present between the variable in X-axis and the mean of the variable in Y-axis.
- The observations are independent of one another.
- The sample data used represents the entire population.
- Y is normally distributed for any X value
- All the X values have the same residual variance.
11. How is grid search different from random search?
Both grid search and random search are strategies used for tuning model hyperparameters. In grid search, a grid of the parameters and their values to be tested are set up and every possible combination from the grid are tried, evaluated and the model's accuracy using them are tracked. The one with the highest accuracy is chosen as the best parameter values for the model. One drawback is that it consumes a lot of time and becomes complex as the number of parameters increase.
Random search does not test all the combinations but instead picks out random combinations of parameters each time and test and evaluates them. Here, we have the chance of finding the optimal parameters less time compared to grid search.
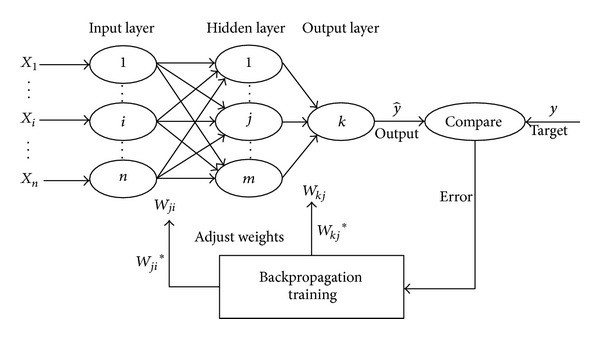
12. How does back propagation work?
Back propagation is an algorithm used in a multilayer network that consists of an input layer, an output layer and atleast one hidden layer. The error is calculayed at the output layer by comparing the target and the actual output. This claculated error is propagated backwards to the input layer. There are three phases in this algorithm:
- Feed forward phase
- Back propagation of error
- Updating the weights
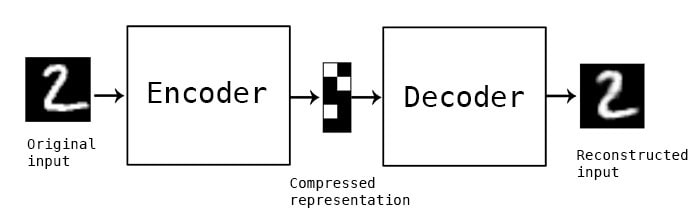
13. What are auto-encoders?
Auto-encoders are learning networks that gets the input, encodes them and then learn to reconstruct the data from the encoded form to an output that is as close to the input as possible. By design, it reduces the dimensions in data by learning to ignore the noise. This receives unlabeled data as inputs. It consists of 4 main components: an encoder, bottleneck, decoder and reconstruction loss.
14. For text analysis, which one between R and Python would you pick and why?
In case of text analysis, Python is preferred than R as Python has faster performance for all types of text analytics and high-performance data analysis tools and data structures that are easy to use are offered by the Pandas library.
15. Given a table of purchases by date, calculate the month-over-month percentage change in revenue. The output should include the year-month date (YYYY-MM) and percentage change, rounded to the 2nd decimal point, and sorted from the beginning of the year to the end of the year. The percentage change column will be populated from the 2nd month forward and can be calculated as ((this month's revenue - last month's revenue) / last month's revenue)* 100.
Hint: use table sf_transactions
SELECT DATE_FORMAT(created_at,'%Y-%m') AS ym,
       ROUND((SUM(value) - LAG(SUM(value)) OVER ())
             / LAG(SUM(value)) OVER ()
             * 100, 2) AS revenue_diff_pct
 FROM sf_transactions
 GROUP BY ym
 ORDER BY ym
16. Describe Markov chains.
Markov chain is a type of stochastic process in which the the future probability of any event depends on the state of its previous event.
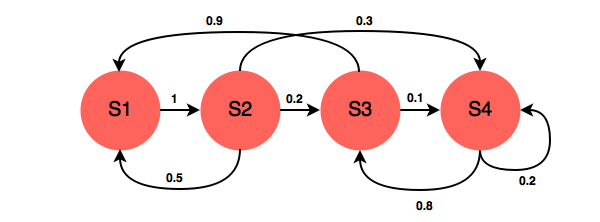
In machine learning, Markov chains can be used for any kind of forecasting like weather and sales forecasting, for predicting customer behavior, analyzing brand loyalty and also it can be merged with many NLP tasks like POS tagging.
17. What is the difference between error and residual error?
Error is the difference between the observed value and the true value. It gives us the measure of how much the observation has deviated from the true value. Residual error is the difference between the observed value and the predicted value. We use residual errors as a criteria for evaluating the model's performance as true values of the quantity of interest are never known. It helps us get the accurate estimate of error.
18. What is imputation? List the different types of imputation techniques.
The process of replacing missing data with other values is known as imputation. Some imputation techniques are discussed below.
- Single imputation - when missing data are replaced by a single value.
- Mean imputation - calculating the mean of the non-missing values of the variable and replace missing data with it.
- Hot deck imputation - We first find all the samples that have similar values for other variables and randomly choose one of their values to replace the missing data.
- Cold deck imputation - Similar to hot deck imputation, but instead of randomly choosing, values are systematically chosen.
- Regression imputation - The missing variable is regressed on other variables and the predicted value replaces the missing data
19. How is Data modeling different from Database design?
Based on the relationship between various data models, Data modelling creates a conceptual model by systematically applying data modeling techniques. It involves moving up from the conceptual stage to the logical and consecutively to the physical schema. On the other hand, the output of database design is a detailed data model of the database. It must strictly include the detailed logical model but the storage parameters and choices of physical design are optional.
20. What is information gain, entropy and pruning in decision tree?
Entropy in a decision tree algorithm is the measure of randomness or impurity. It tell us how pure or impure the given dataset is i.e. gives an idea about variance in the dataset.
Information gain is the difference in entropy. It tell us how much entropy is reduced when the data is split using a particular feature.
Pruning refers to removing redundant sections of the decision tree resulting in a smaller decision tree.
21. Build a logistic regression model on the ‘customer_churn’ dataset in Python. The dependent variable is ‘Churn’ and the independent variable is ‘MonthlyCharges.’ Find the log_loss of the model.
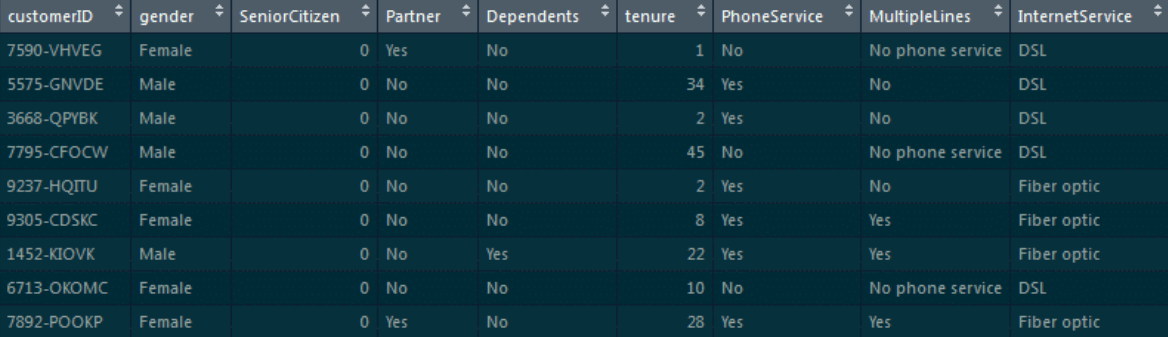
customer_churn=pd.read_csv(“customer_churn.csv”) #loading the dataset
customer_churn.head()   #to view the first 5 entries

# Separating features and target
x=pd.Dataframe(customer_churn[‘MonthlyCharges’])
y=customer_churn[‘Churn’]

# Splitting into train and test
from sklearn.model_selection import train_test_split
x_train, x_test, y_train, y_test=train_test_split(x,y,test_size=0.3, random_state=0)

# Building model
from sklearn.linear_model, we have to import LogisticRegression
l=LogisticRegression()
l.fit(x_train,y_train)
y_pred=l.predict_proba(x_test)

# Computing log loss
from sklearn.metrics import log_loss
print(log_loss(y_test,y_pred)
Output:
0.5555020595194167
22. What is the benefit of dimensionality reduction?
Higher dimension data is difficult to work with as it takes a lot of time to process the data and train the model on it. Dimensionality reduction refers to reducing the dimensions of the data while still keeping intact the overall information of the data. This results in faster processing, removes noise and improves model accuracy. It also reduces the storage requirements of the machine learning project.
23. Find the titles of workers that earn the highest salary. Output the highest-paid title or multiple titles that share the highest salary.
Tables used: worker, title
select t.worker_title
from worker w join title t on w.worker_id = t.worker_ref_id
where salary in (select max(salary)
                    from worker);
24. Write a query that will identify returning active users. A returning active user is a user that has made a second purchase within 7 days of any other of their purchases. Output a list of user_ids of these returning active users.
Table: amazon_transactions
select distinct user_id
from (select *,
    lead(created_at) over(partition by user_id order by created_at) as next_purchase
    from amazon_transactions) sbqry
where datediff(next_purchase, created_at) <= 7;
25. What is a kernel function in SVM?
A kernel function in SVM is a mathematical function that transforms the input into the required form. This transformation is done based on Kernel trick which essentially maps lower dimensional data into higher dimensions. This function can transform data that is not linearly separable into a representation that's linearly separable.
26. What are the types of kernels in SVM?
The nine types of kernels in SVM are:
- Polynomial kernel
- Gaussian kernel
- Gaussian radial basis function (RBF)
- Laplace RBF kernel
- Hyperbolic tangent kernel
- Sigmoid kernel
- Bessel function of the first kind Kernel
- ANOVA radial basis kernel
- Linear splines kernel in one-dimension
27. Write a function in python to calculate the accuracy of a binary classification algorithm using its confusion matrix.
def accuracy_score(matrix):
  true_positives = matrix[0][0]
  true_negatives = matrix[1][1]
  total_observations = sum(matrix[0]) + sum(matrix[1])
  return (true_positives + true_negatives) / total_observations
28. What is root cause analysis?
Root cause analysis is identifying the root cause of the problem i.e. finding out why the problem occurred in the first place in order to arrive at a solution. One of its goals is to learn from the underlying issues (if present) within the root cause and implement what we learn to prevent future issues. The core principles of root cause analysis are:
- Analyze in a systematic way and have evidence to support the claims of root cause.
- Understand that often there are multiple root causes.
- The corrective course of action must be a well-informed one.
- Focus on the HOWs and WHYs instead of WHOs.
- Find how a root cause can be prevented in the future.
29. What is ensemble learning?
The main goal of building machine learning models is that they understand the underlying patterns in data and make predictions accordingly. But when we have complex datasets, it becomes difficult for a single model to do the job. In this case, we combine more than one base models to create an effective model. This is known as ensemble learning.
30. What are bagging and boosting?
Both bagging and boosting are ensemble learning methods. Bagging stands for bootstrap aggregating. In this method, we first data using bootstrapping. In bootstrapping, we generate multiple samples of size N from an existing dataset. Multiple models are trained in parallel using these bootstrapped data.
Unlike bagging, we do not train many models in a parallel manner in boosting. Here, we train many models in a sequential manner. The weak models are iteratively combined passed to another model in such a way that the training of a new model depends on the models trained before it. This is done to reduce error.
31. Calculate precision and recall in the given confusion matrix.
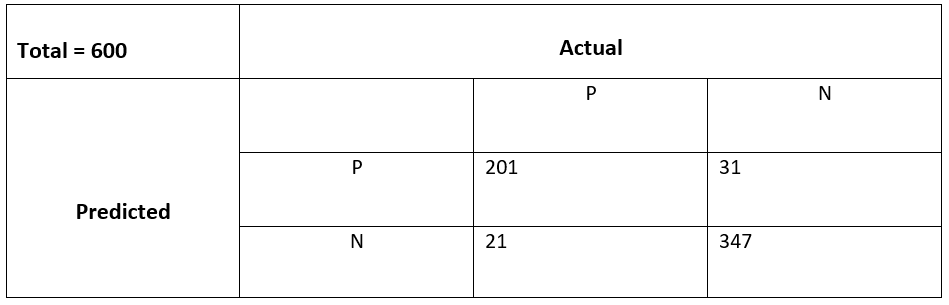
Precision:
(True Positive) / (True Positive + False Positive)
Recall:
(True Positive) / (True Positive + False Negative)
Based on the given data, precision and recall are:
Precision: 201 / (201 + 31) = 0.866
Recall: 201 / (201 + 21) = 0.905
32. How do you deal with unbalanced data?
The ways to deal with imbalanced datasets are:
- Resampling - over and under sampling techniques
- By using a BalancedBaggingClassifier which contains additional balancing instead of a normal classifier.
- Generating more data by ensembling various resampled datasets.
- Clustering the majority class
- Moving the default threshold of 0.5 in our classifiers.
- Choosing proper evaluating metric. For imbalanced datasets F1 score is more appropriate.
33. Define confounding variables.
Confounding variables are the variables that change the effect of the independent and dependent variables. They are an external influence in the experiment. For a variable to be a confounding variable, it must satisfy the following two conditions:
- It must be correlated to the independent variable.
- It must be informally related to the dependent variable.
34. What are the feature selection methods used to select the right variable?
The different feature selection methods that are used to select the right variable are:
- Ridge regression
- Lasso regression
- Chi-square
- Recursive feature elimination
- Pearson's correlation
- backward elimination
35. What is a Box-Cox transformation?
This transformation is named after statisticians George Box and Sir David Roxbee Cox who developed it. It is a transformation of dependent variables that are not normal into normal shapes. Applying Box-Cox transformation to data that is not normal means that we are able to run a broader number of tests on our data.