
Get this book -> Problems on Array: For Interviews and Competitive Programming
This article aims to improve our understanding on one of the basic concepts of statistics: confidence intervals.
Table of contents
- Introduction
- Finding confidence interval for a T-distribution
- Finding confidence interval with a z-score
Introduction
Before getting into confidence intervals, let us define some required terms like margin of error and confidence level .
Margin of error is an amount which is typically small that is allowed for in case of miscalculation or change of circumstances. It's just like an interval of error possibility. For a sample size n, margin of error is given by
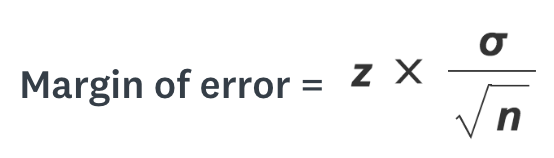
where z is the z-score , σ is the standard deviation and n is the sample size.
A Confidence level tells us the the percentage of probability that the confidence interval would contain the true parameter when we randomly draw samples.
A Confidence interval expresses a range of values within which we are pretty sure that the population parameter lies. Confidence interval is usually calculated as:
CI= sample mean ± margin of error
Here the lower limit of the interval is given by sample mean - margin of error and the upper limit is given by sample mean + margin of error.
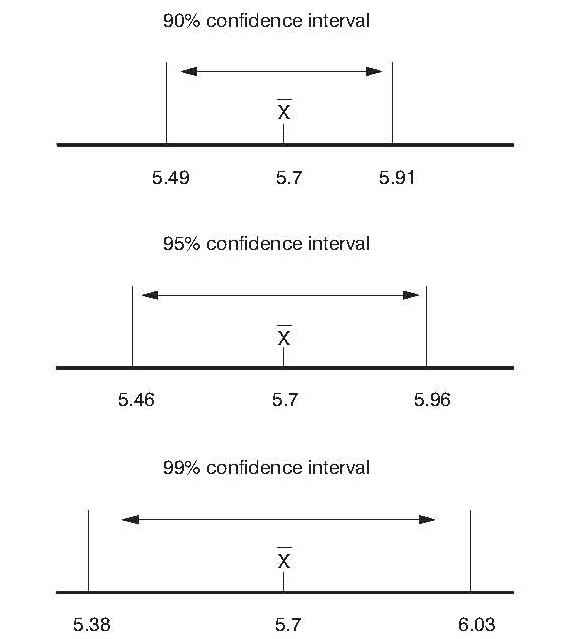
Usually, a Confidence interval is a 95% confidence interval. A 95% confidence interval is just an interval that covers 95% of the bootstrapped means. With this, we know that anything outside of this interval occurs less than 5% and has a p-value < 0.05. Similarly, a 99% confidence interval covers 99% of the bootstrapped means of the given sample. For a sample size of 121 and sample mean 5.7, the various confidence intervals are given below.
Finding confidence interval for a T-distribution
We use a t-distribution to find the confidence interval for a sample when we do not know anything about the behavior of the population. The formula for calculating CI is as follows:
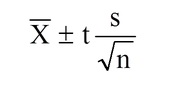
Here s is the standard deviation, t is the t-distribution value that we'll find, x̄ is the sample mean and n is the sample size.
For example, let us suppose, 10 apartment prices in New York City are sampled. The sample mean and the sample standard deviation based on this sample is 980 dollars and 250 dollars (both are estimators based on a sample of size ten). Let us try to find a 95% confidence interval for the mean.
- Subtract 1 from your sample size to find the degrees of freedom (df). Since our sample size is 10, our the degrees of freedom is 10-1 which gives df=9.
- Now, subtract the confidence level from 1, then divide the answer by two. This will be our alpha level.
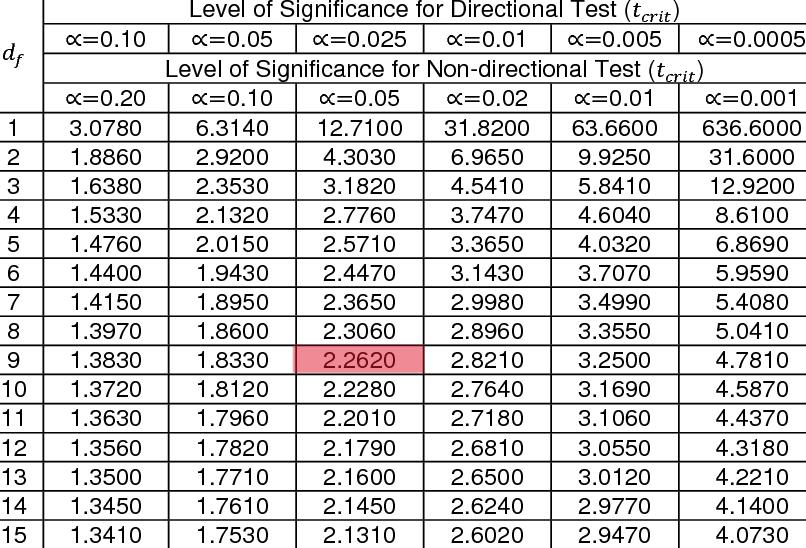
(1-0.95)/2=0.025. - Look up df and α in the t-distribution table. For df=9 and α=0.025, the table gives us 2.2620
4. Divide the standard deviation by square root of sample mean.
250/√10 = 79.056
-
Multiply the value obtained in previous step with the value we found in step 3.
79.056 x 2.2620 = 178.824 -
Now the confidence interval is 980 ± 178.824
-
Upper limit = 980 + 178.824 = 1158.824 and the lower limit is 980 - 178.824 = 801.176
Finding confidence interval with a z-score
The formula to calculate CI is
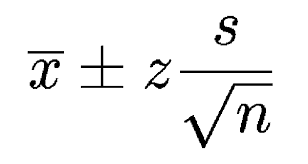
Here, z is the z-score.
Let us understand this through an example. Let us suppose that the sample mean temperature for a certain city in August was found to be 101.82 with a standard deviation of 1.2. The number of samples considered were 6. We need to construct a confidence interval of 95% confidence level.
- Subtract the given confidence level from 1 and divide the answer by 2 to get our α level ( area under a single tail).
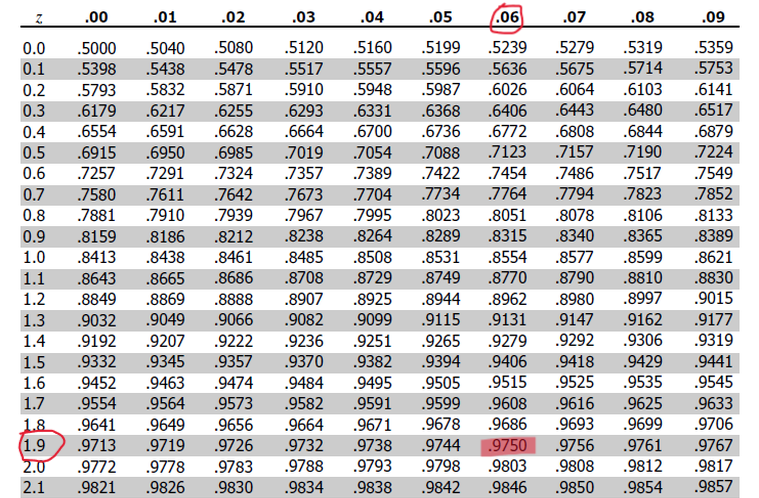
(1-0.95)/2=0.025. - Subtract the α level from from 1 and look that value up in the middle area of the z-table (right z-table in most cases). This gives us the z-score.
(1-0.025) =0.0975
Looking up 0.0975 in the z-table, we get a z-score of 1.96.
- Plug in the numbers and solve for z * s / (√n)
= 1.96 * 1.2/√(6)
= 1.96 * 0.49
= 0.96 - Now the confidence interval is 101.82 ± 0.96
- Upper limit = 101.82 + 0.96 = 102.78 and the lower limit is 101.82 – 0.96 = 100.86
With this article at OpenGenus, you must have the complete idea of Confidence intervals in Data Science.