
In this article, we will understand about various statistical features like median, quartiles, inter quartile range (IQR), bias and variance.
Table of contents
- Statistical Features
- Bias
- Variance
- Median
- Quartiles and Inter quartile range (IQR)
Statistical Features
Statistical features are those features of the dataset that can be defined and calculated via statistical analysis. It is the statistical concept that is probably most used in data science. When we start exploring a dataset, the first thing we do is to find out the statistical features of the dataset. We will discuss in detail about a few of those statistical features here.
Bias
In statistics, when there is a systematic difference between the true parameters and the results we estimated, it is called a bias. It essentially means that our statistic is not representing the population properly. There are many sources of bias. Some of them are:
- Selection bias is when there is no proper randomization while selecting data which results in the sample being unrepresentative of the population.
- Omitted variable bias is when we do not have a required variable/attribute in a model.
- Survivorship bias is when only people or data that made it past some selection criteria are considered and others are overlooked.
- Observer bias is when the observer's prejudice, opinions and expectations influence how they assess or record subjective criteria.
- Recall bias is when participants of an experiment do not remember previous events.
Variance
Variance gives us a measure of how much the data points differ from the mean. It can also be treated as a measure that tell us how far the data points are spread out. It is represented as σ2 and its formula is
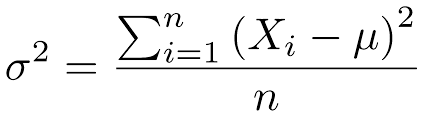
Here, n is the sample size, Xi is the ith data point and μ is the mean. The square root of variance is the standard deviation.
Median
In a sorted list of numbers (either ascending or descending), median is the middle number separating the higher half from the lower half. We tend to use median instead of mean when we have outliers in the dataset that skews the average as a median is less affected by outliers than the mean.
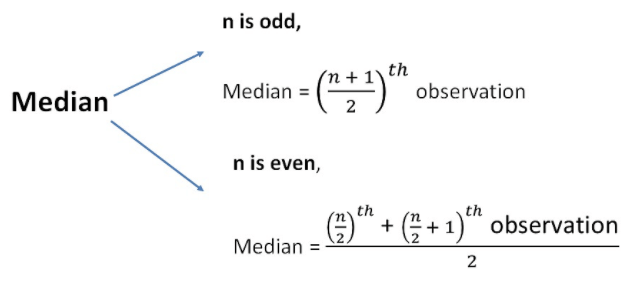
- When our data sample consists of odd number of values, then the median is the middle number such that there are same number of entries above and below it.
- When our data sample consists of even number of values, then the median is the average of the middle pair of values.
Quartiles and Inter quartile range (IQR)
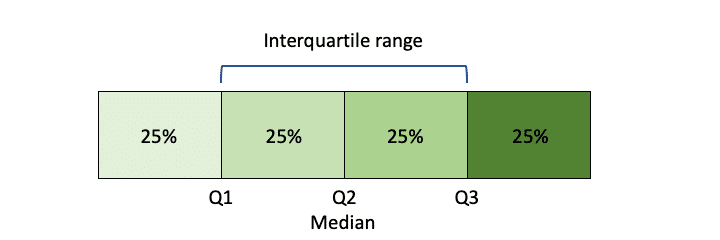
Quartiles are the values that divide the number of observations in our dataset in to four equal parts. They mark each 25% of the data. Q1 marks 25%, Q2 marks the median or 50%, Q3 marks 75%. The inter quartile range contains the second and third quartile and tells us how far is the middle portion of the data is spread.
Minimum (min) value is calculated as Q1 - 1.5(IQR) and the maximum (max) value is calculated as Q3 + 1.5(IQR).
All these are perfectly illustrated by a box plot.
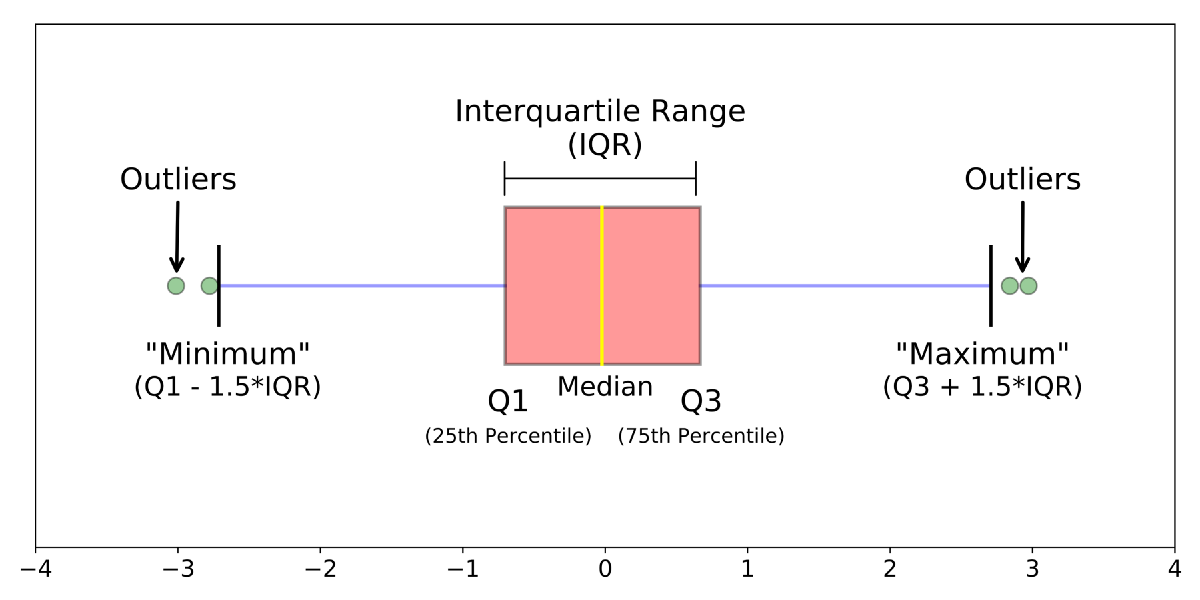
- If the median line is not in the middle, then we can conclude that the data is skewed.
- The length of the box tells us how similar or different the data points are. A smaller box corresponds to similar data points and a taller box tells us that the data points are wide spread.
- The length of the whiskers tell us about the variance and standard deviation. If they are too long, it means that our data is highly varying.
With this article at OpenGenus, you must have the complete idea of Statistical Features in Data Science.