Open-Source Internship opportunity by OpenGenus for programmers. Apply now.
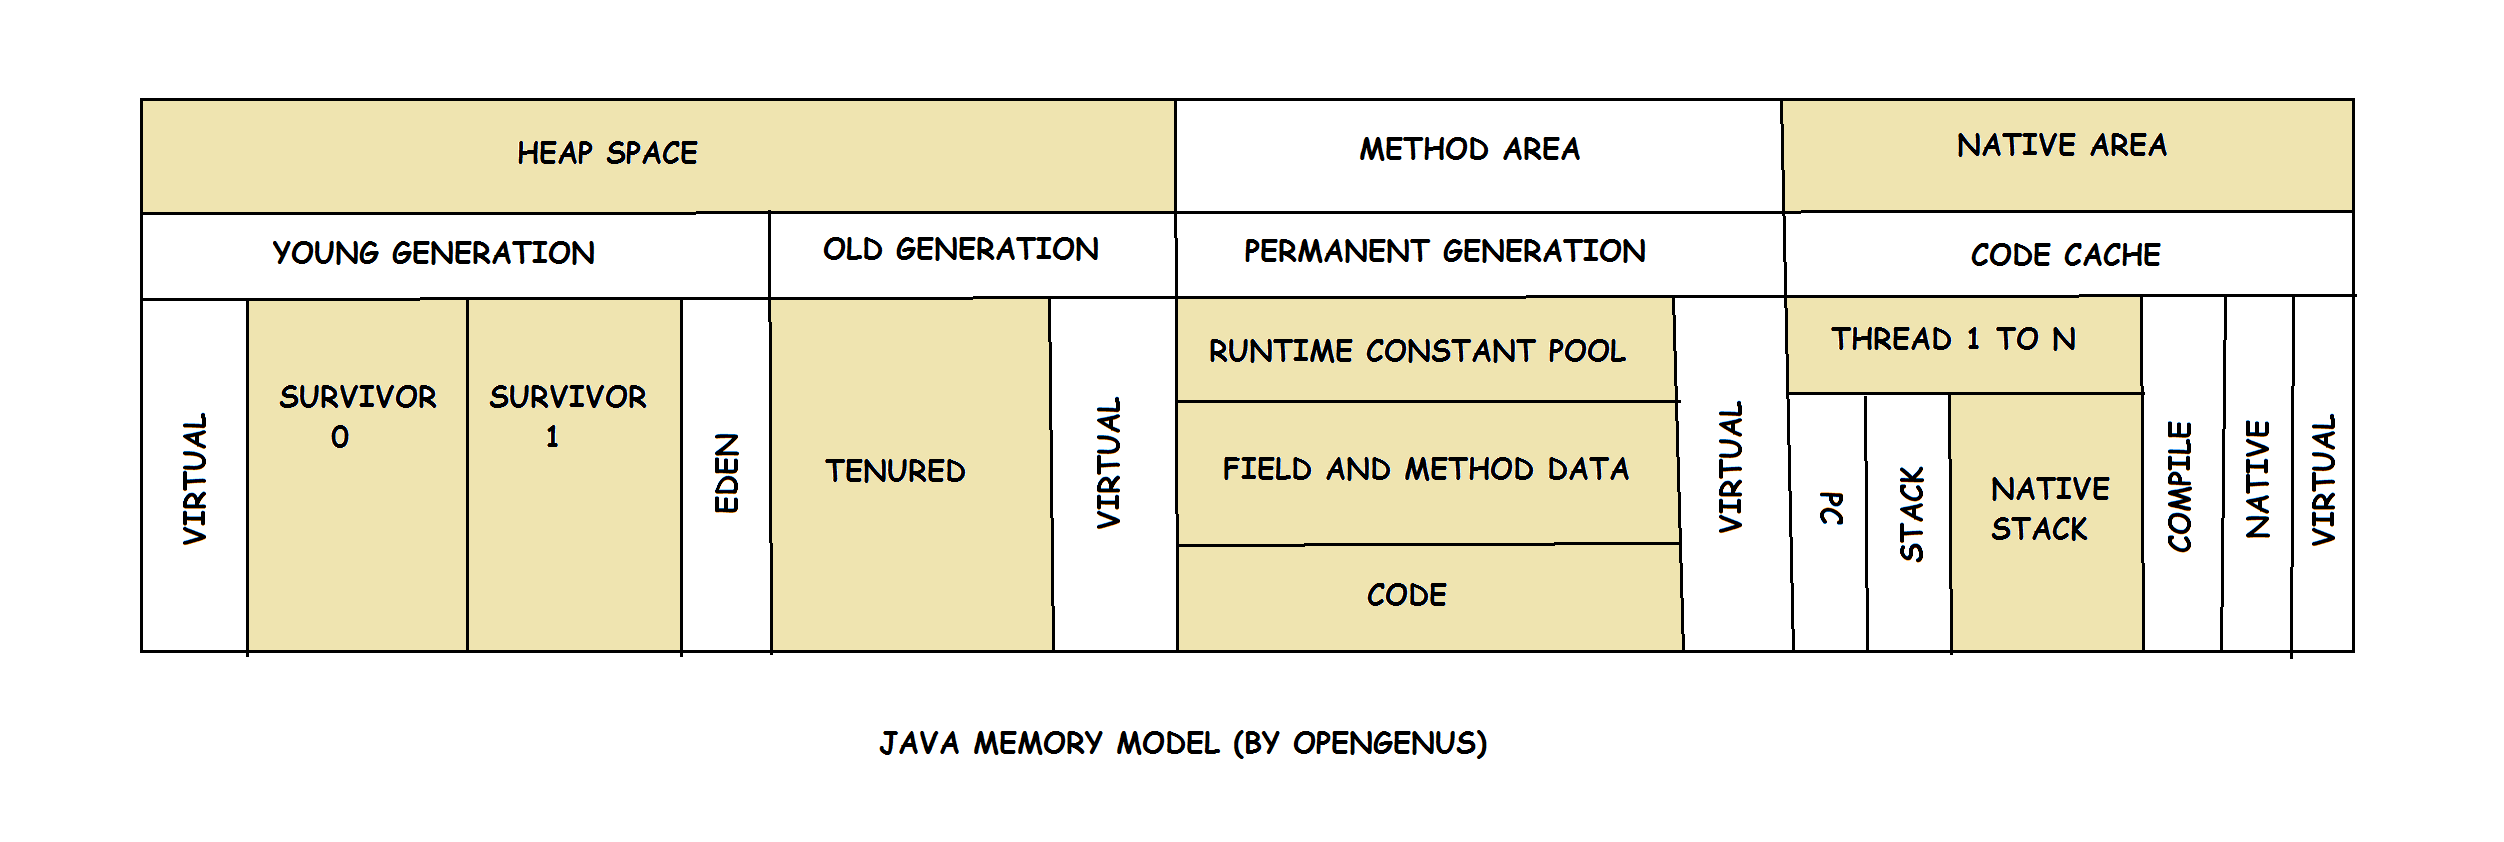
Following is the overview of the elegant Java Memory Model:
Do understand that it is one big chunch of memory which is physically uniform but has been distinctly splitted from a software perspective to ensure efficient usage and organization of memory. We will explore each section in detail in our quest of efficient memory management.
Generational Hypothesis
Doing a garbage collection entails stopping the application completely. The more objects there are, the longer it takes to collect all the garbage.
What if we would have a possibility to deal with less objects?
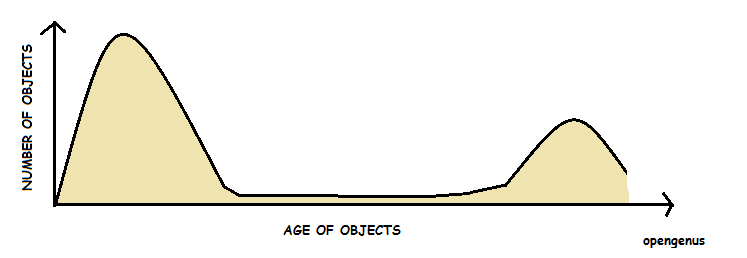
Investigating the possibilities, a group of researchers has observed that most allocations inside applications fall into two categories:
- Most of the objects become unused quickly
- The ones that do not usually, survive for a very long time
These observations come together in the form of Weak Generational Hypothesis. Based on this hypothesis, the memory inside the Virtual Machine is divided into the Young Generation and the Old Generation (Tenured).
Java Virtual Machine (JVM) Memory Model
Java Virtual Machine (JVM) memory is divided into separate parts to classify memory spaces based on usage. The key idea is to quickly identify the approximate usage of a particular object and consider objects only of a particular interest.
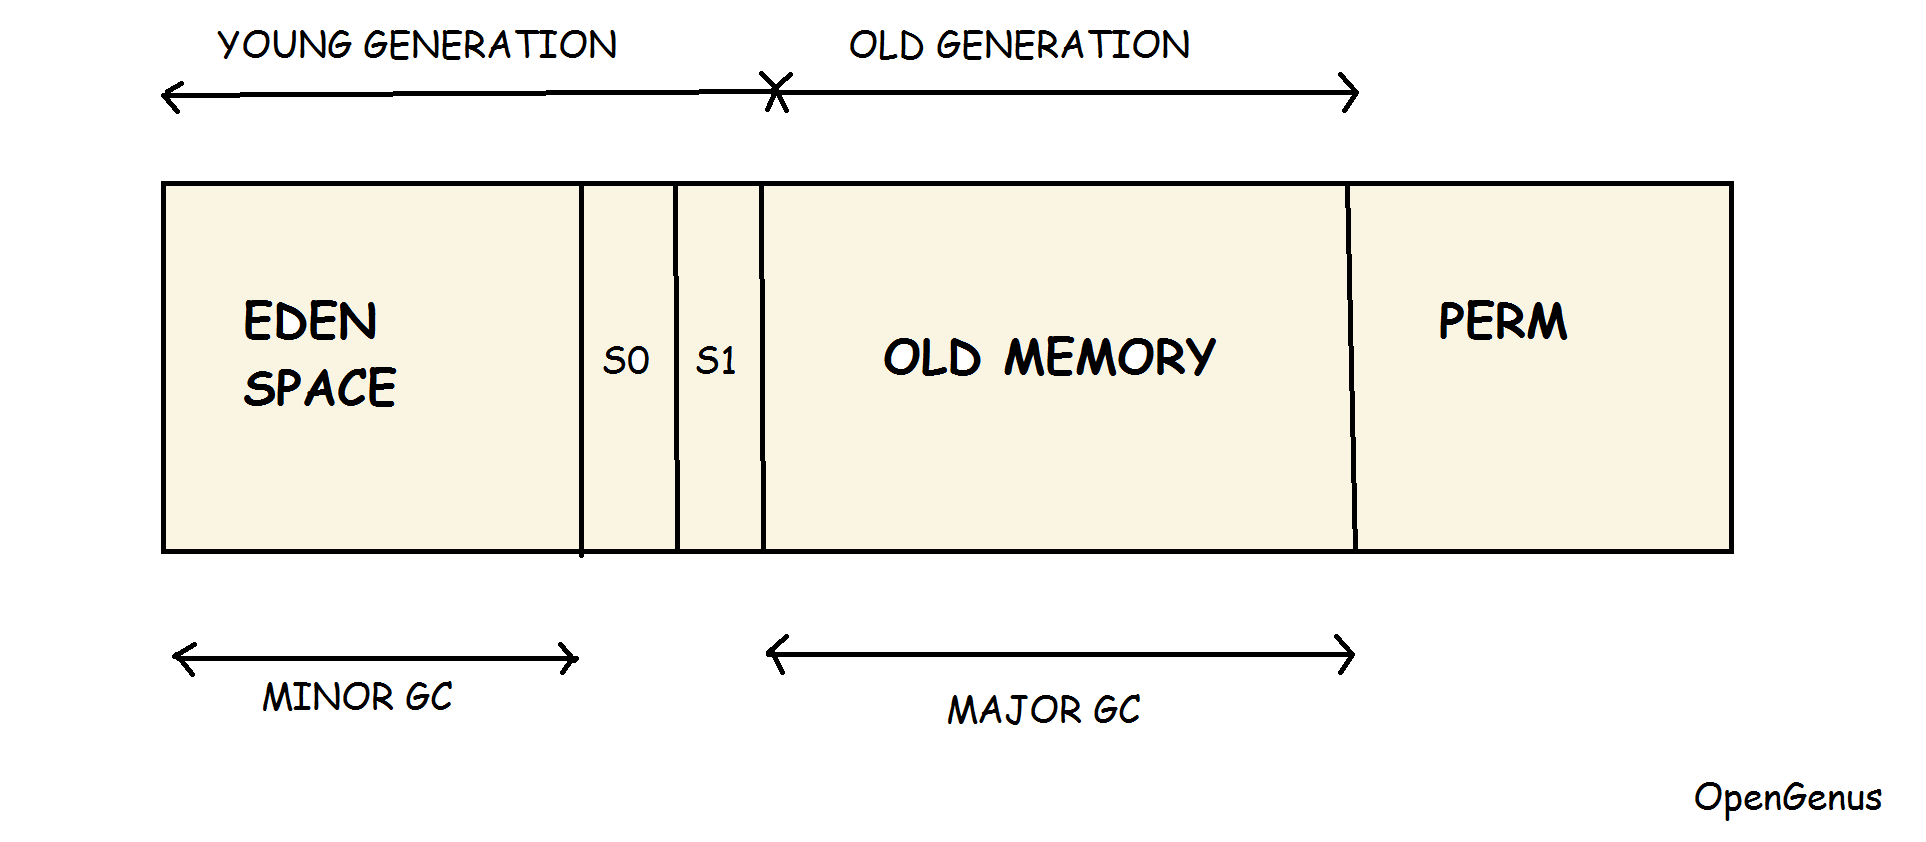
At broad level, JVM Heap memory is physically divided into two parts – Young Generation and Old Generation. The young generation is divided into Eden space and two survivor spaces (S0 and S1).
The user does not have much control over the third space PERM which we will explore further in our quest.
Young Generation memory space
Young generation is the memory space where all the new objects are created. When young generation is filled, a garbage collection is performed. Garbage collection in the Young Generation memory space is called Minor Garbage Collection.
Young Generation is divided into three parts namely Eden Memory space and two Survivor Memory spaces.
Keys points about Young Generation memory spaces:
-
Most of the newly created objects are located in the Eden memory space.
-
When Eden space is filled with objects, minor garbage collection is performed and all the survivor objects are moved to one of the survivor spaces.
-
Minor garbage collection checks the survivor objects and move them to the other survivor space. Thus, one of the survivor space is always empty.
-
Objects that are survived after many cycles of garbage collection, are moved to the Old generation memory space.
Old Generation memory space
Old Generation memory contains the objects that are long lived and survived after many rounds of Minor garbage collection. Usually garbage collection is performed in Old Generation memory when it is full.
Garbage Collection in the Old generation memory space is called Major garbage collection and usually takes much longer than Minor garbage collection.
Keys points about Old Generation memory spaces:
-
All long lived objects or objects that survived several minor garbage collections are located in the Old Generation memory space
-
When Old generation memory space is filled with objects, major garbage collection is performed
-
Number of Major garbage collections << Number of Minor garbage collections
-
Time taken by Major Garbage collection >> Time taken by Minor Garbage collection
-
Major garbage collections take a long time and makes applications unresponsive
Permanent Generation (PERM)
Prior to Java 8 there existed a special space called the ‘Permanent Generation’. This is where the metadata such as classes were located.
It is quite hard to predict how much space all of that would require. Result of these failed predictions took the form of java.lang.OutOfMemoryError: Permgen space. Unless the cause of such OutOfMemoryError was an actual memory leak, the way to fix this problem was to simply increase the permgen size similar to the following example setting the maximum allowed permgen size to 256 MB:
java -XX:MaxPermSize=256m com.opengenus.app
Keys points about Permanent Generation memory spaces:
-
Available in Java versions less than 8 only
-
Stores metadata of classes
-
Hard to predict memory usage
Metaspace
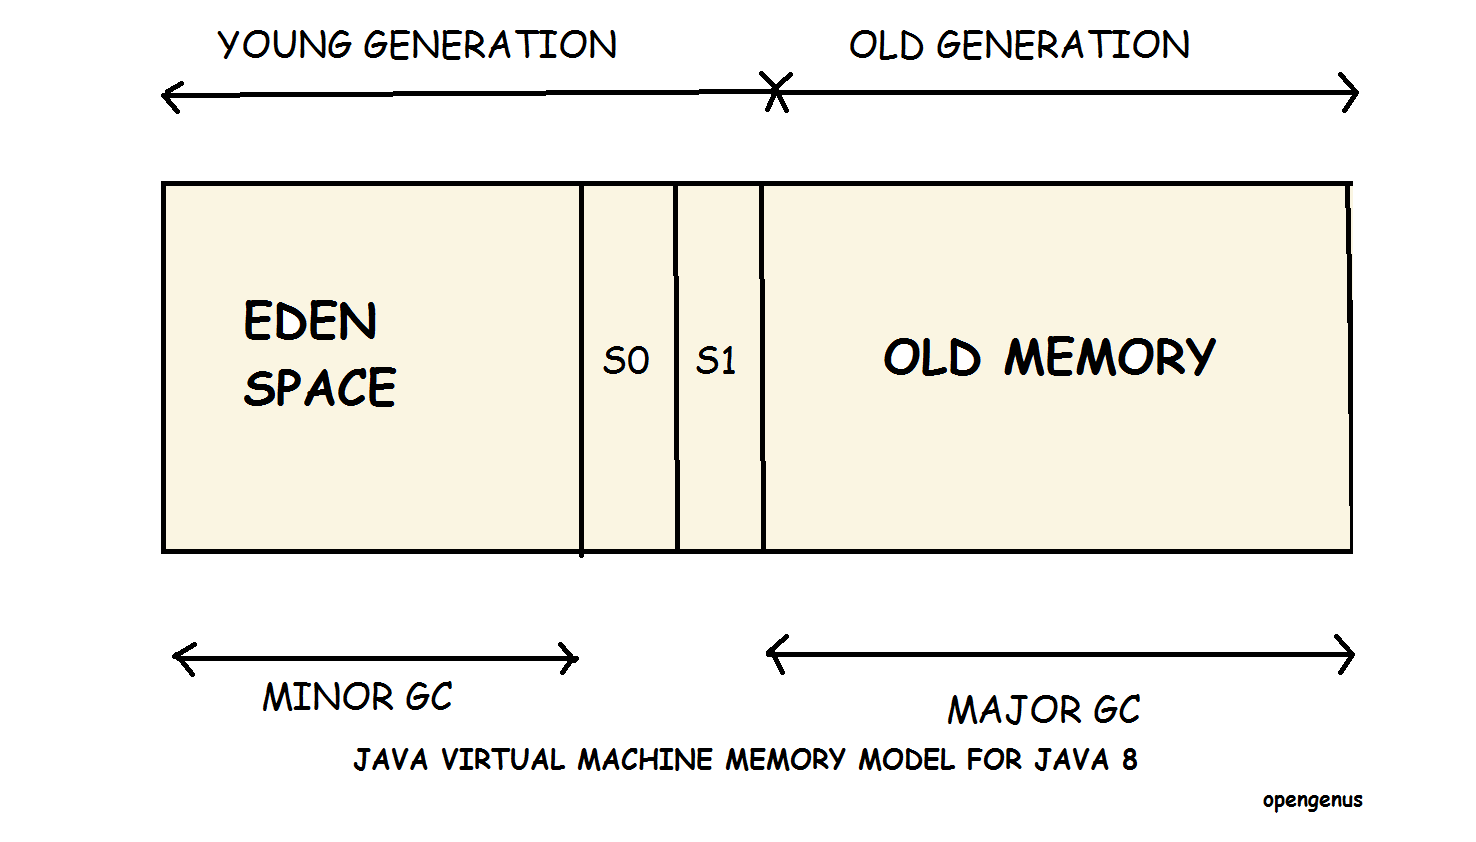
As predicting the need for metadata was a complex and inconvenient task, the Permanent Generation was removed in Java 8 in favor of the Metaspace. From this point on, most of the miscellaneous things were moved to regular Java heap.
The class definitions are loaded into Metaspace. It is located in the native memory and does not interfere with the regular heap objects. By default, Metaspace size is only limited by the amount of native memory available to the Java process. This saves developers from a situation when adding just one more class to the application results in the java.lang.OutOfMemoryError: Permgen space.
Keys points about Metaspace memory spaces:
- Letting the Metaspace to grow uncontrollably can introduce heavy swapping and reach native allocation failures.
In case you still wish to protect yourself for such occasions you can limit the growth of Metaspace similar to following, limiting Metaspace size to 256 MB:
java -XX:MaxMetaspaceSize=256m com.opengenus.app
Thus, currently, if you are using Java 8 or onwards, your memory space is divided such as:
Method Area
Method Area is:
-
A part of space in the Permanent Generation memory space
-
It is used to store class structure (runtime constants and static variables) and code for methods and constructors.
Memory Pool
Memory Pools are:
-
Created by JVM memory managers to create a pool of immutable objects. String Pool is an example of this kind of memory pool.
-
Memory Pool can belong to Heap or Permanent Generation memory space, depending on the JVM memory manager implementation.
Runtime Constant Pool
Runtime constant pool is:
-
A per-class runtime representation of constant pool in a class
-
It contains class runtime constants and static methods.
-
Runtime constant pool is the part of the method area.
Java Stack Memory
Java Stack memory is:
-
Used for execution of a thread.
-
They contain method specific values that are short-lived and references to other objects in the heap that are getting referred from the method.
Fragmenting and Compacting
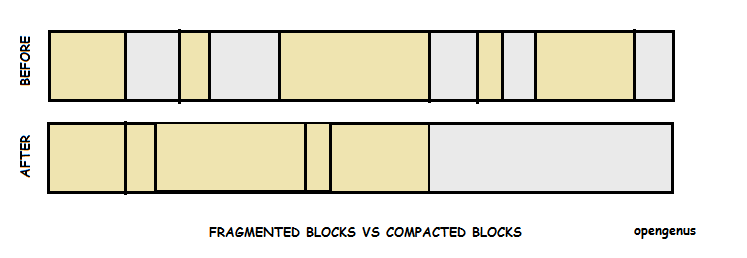
Whenever sweeping takes place, the JVM has to make sure the areas filled with unreachable objects can be reused. This can (and eventually will) lead to memory fragmentation which, similarly to disk fragmentation, leads to two problems:
Write operations become more time-consuming as finding the next free block of sufficient size is no longer a trivial operation.
When creating new objects, JVM is allocating memory in contiguous blocks. So if fragmentation escalates to a point where no individual free fragment is large enough to accommodate the newly created object, an allocation error occurs.
To avoid such problems, the JVM is making sure the fragmenting does not get out of hand. So instead of just marking and sweeping, a ‘memory defrag’ process also happens during garbage collection. This process relocates all the reachable objects next to each other, eliminating (or reducing) the fragmentation. Here is an illustration of that:
Now, you have a clear idea regarding how management and classification of memory can lead to better memory usage for client and server applications.
