Open-Source Internship opportunity by OpenGenus for programmers. Apply now.
Say you're planning to work on a regression problem with a given dataset, you know how to build a regression model that predicts your desired output variable, but you are unsure about the importance of each variable. This is where our topic of this article comes in! We will be learning about stepwise regression- a technique that will help us find the best set of variables to choose for our linear regression.
Table of contents:
- Introduction- Why use Stepwise Regression?
- Process: How does stepwise regression work?
- Alternative metrics: Adjusted R-squared, AIC, BIC
- Applications of Stepwise Regression
- Benefits and Limitations
- Test your knowledge
- Key Takeaways
Why stepwise regression?
Why not just use all variables?
The main goal of stepwise regression (sometimes called stepwise selection) is to select a set of variables that are statistically significant in terms of influencing the prediction of our dependent variable. This reduces the total number of variables in our regression model, which may improved performance due to:
- Overfitting: Higher number of variables (as number of independent variables approach n) can lead to overfitting- This is where the model learns noise in the data rather than an underlying pattern, leading to out-of-sample poor performance. Meaning, it will perform poorly on new, unseen data as it fails to generalise it's learnings from the data.
- Multicollinearity: Having a higher number of variables increases the risk of variables being correlated to one another. This leads to issues where it is difficult to distinguish individual independent variables x for statistical significance, even if an F-test result demonstrates overall significance for all variables. This makes interpreting independent variables in our model more difficult.
Both of these undermine the strengths of a linear regression approach- As it may render us with a model that both performs below it's full potential and negates the benefit of an interpretable model.
How does stepwise regression work?
Stepwise regression follows this general logic flow
Repeat until no change in model:
Perform an F-test to compute the p-values of each independent variable.
Based on the type of selection, add / remove a variable based on the selection method.
A more specific flowchart of this process can be seen below:
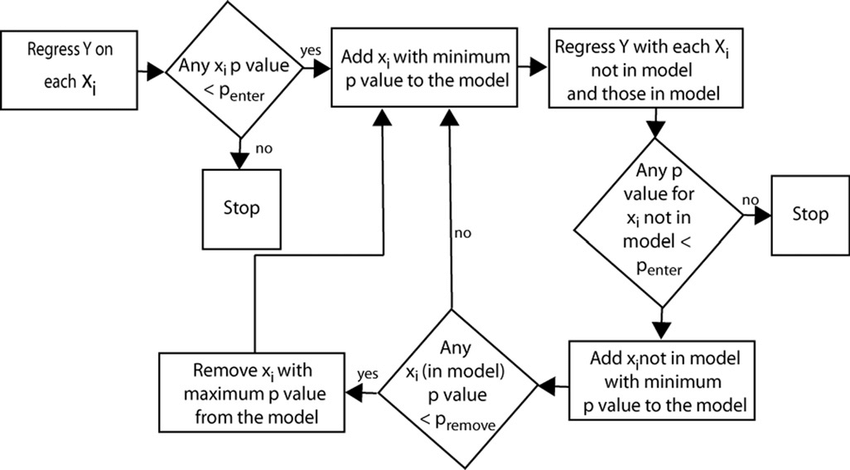
By repeating this process, we are ensuring only important variables are included in our final model.
Types of stepwise regression
Now that we know the general logic of a stepwise regression, we can go into specific variations:
Backwards Elimination
This is a variation of stepwise regression where we start with a full model with all independent variables and remove the variables that are not important.
- Run a statistical test to calculate p-values of each independent variable from an F-test.
- Choose the least significant variable, i.e. the one with the highest p-value
- Remove the variable from the model.
- Repeat steps 1-3, until all variables in the model are significant (I.e. p value > level of significance)
Forwards Selection
This is a variation of stepwise regression, this time we start with a null model with no independent variables, and add the most important variable we find.
- For each independent variable, calculate the effect of adding it to the model by calculating an p-value.
- Choose the most significant variable, i.e. the one with the lowest p-value.
- Add the variable to the model.
- Repeat steps 1-3, until no more significant variables are present (I.e. p-value > level of significance)
Biconditional Elimination
This is a combination of the forwards selection procedure combined with backwards elimination.
- Follow the process of Forwards Selection as described above.
- Then, perform a round of Backwards elimination as described above.
- Repeat until no more predictors are added or excluded from the models.
Alternative Metrics
So far, we've investigated the process of stepwise regression in the context of the p-values of each independent variable. However, we can also perform stepwise regression based on other performance indicators.
Adjusted R-squared
An R-squared value describes the proportion of variance in our dependent variable that can be explained by our regression model. Higher R-squared value generally indicates a better model. (Not always! You should always check for an appropriate fit by checking a residual plot)
The formula of R-squared can be computed with the following formula:
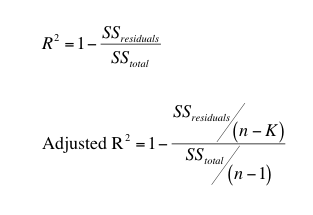
Our stepwise regression process then checks the effects of adding / removing variables.
- Add / remove the variable if it increases the Adjusted R-squared value.
- Repeat this process until the Adjusted R-squared of the model stops changing.
AIC- Akaike Information Criterion
One main issue of both the Adjusted R-squared approach and p-value approach is biased R-squared measures and misleadingly small p-values for significance. So, in 1973, Hirotogu Akaike proposed using AIC as a metric for the selection method.
AIC can be computed via the formula:
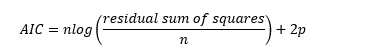
Where:
- n = Number of samples
- p = Number of parameters
The lower the AIC value, the better. Hence the stepwise regression will add/remove variables to minimise the value of AIC.
AIC is the most widely known and used model selection method. However this doesn't mean it's always the best method. For smaller sample sizes, AIC will have a substantially increased probability of overfitting the model.
BIC- Bayesian Information Criterion
Even though AIC is an improvement from our previous solutions, there still is more to be desired- AIC still tends to pick more variables than less. BIC addresses this increases the penalty of each variable during the process variable.
BIC can be computed via the formula:
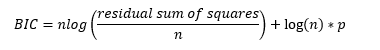
Applying a log(n) multiply will result in penalty multiplier higher than 2 as long as n > 8 (Verify this yourself!), leading to a higher penalty term.
Then, similarly to AIC, the stepwise regression process is performed by minimising the BIC.
Applications of Stepwise Regression
Stepwise Regression is most commonly used in educational and psychological research where there are many factors in play and the most important subset of factors must be selected.
Benefits and Limitations
Benefits:
- This is a procedure that is automated and makes the feature selection process for regression easier.
- Generally will select a model that performs well on your dataset.
- Useful tool when you lack domain knowledge in your problem.
- Reduces the number of variables of the model.
- Simple algorithm to understand.
Limitations:
- Performs worse when there is a large amount of independent variables.
- Depending on the metric, still has a tendency to overfit the model.
- Multiple pairwise comparisons on p-values results in biased regression coefficients, since the p-values generated are biased in nature.
- Stepwise Regression by definition is a greedy method of generating a model- Greedy models generally don't generate the global optimal solution.
Test your knowledge
1) In linear regression, which option best describes why it's sometimes better to include less variables in our model?
2) What does overfitting mean?
3) The type of stepwise regression chosen I.e. forward or backwards does not affect the final model.
4) If we wish to perform a stepwise regression which minimises the number of variables, which metric would be the most suitable?
Key Takeaways
- Stepwise Regression is a technique that can be used to automate the process of feature selection in linear regression.
- The three methods of stepwise regression are forwards, backwards and bidirectional.
- Stepwise regression can be performed using various metrics, select the most appropriate one according to your problem.
- Whilst this can be useful when there is a lack of domain knowledge, stepwise regression has it's limitations in regards to selecting the most optimal model. I.e. It can still overfit, biased R-squared values, etc.
Code
import pandas as pd
from sklearn.feature_selection import SequentialFeatureSelector
from sklearn.linear_model import LinearRegression
from sklearn import metrics
First of, we load in our data,
data = pd.read_csv('insurance.csv')
print(data.head())
We are working with this structure:
age     sex   bmi  children smoker     region  expenses
0   19  female  27.9         0    yes  southwest  16884.92
1   18    male  33.8         1     no  southeast   1725.55
2   28    male  33.0         3     no  southeast   4449.46
3   33    male  22.7         0     no  northwest  21984.47
4   32    male  28.9         0     no  northwest   3866.86
Since we are working with categorical variables- We need to change these into dummy variables before we continue with our regression!
data = pd.get_dummies(data, columns = ['sex','smoker','region'])
print(data.head())

Out:
age   bmi  children  expenses  sex_female  sex_male  smoker_no  smoker_yes
0   19  27.9         0  16884.92        True     False      False        True  \
1   18  33.8         1   1725.55       False      True       True       False
2   28  33.0         3   4449.46       False      True       True       False
3   33  22.7         0  21984.47       False      True       True       False
4   32  28.9         0   3866.86       False      True       True       False

   region_northeast  region_northwest  region_southeast  region_southwest
0             False             False             False              True
1             False             False              True             False
2             False             False              True             False
3             False              True             False             False
4             False              True             False             False
Next, we can begin creating our regressors, we will compare a full model, a forward selection model and a backwards elimination model. In this example, I will be using R-squared as my metric.
# Create a Regressor
lin_regress = LinearRegression()
# The direction is forward by default, we will compare forward and backward
stepwise_forward = SequentialFeatureSelector(estimator = lin_regress, direction ='forward', scoring = 'r2')
stepwise_back = SequentialFeatureSelector(estimator = lin_regress, direction ='backward', scoring = 'r2')

# We then fit the SequentialFeatureSelector to get our variables as dictated by stepwise regression.
forward_fit = stepwise_forward.fit(data.loc[:, data.columns != 'expenses'], data['expenses'])
back_fit = stepwise_back.fit(data.loc[:, data.columns != 'expenses'], data['expenses'])
step_forward_features = forward_fit.get_feature_names_out()
step_backward_features = back_fit.get_feature_names_out()
# Print out our feature names:
print(f"Forward Selection features: {step_forward_features}")
print(f"Backwards Selection features: {step_backward_features}")

Forward Selection features: ['age' 'bmi' 'children' 'smoker_no' 'region_northeast']
Backwards Selection features: ['age' 'bmi' 'children' 'smoker_no' 'region_southeast' 'region_southwest']
Finally, we can get a comparison in terms of R-squared values:
forward_lin = LinearRegression().fit(data[step_forward_features], data['expenses'])
backward_lin =  LinearRegression().fit(data[step_backward_features], data['expenses'])
full_lin = LinearRegression().fit(data.loc[:, data.columns != 'expenses'], data['expenses'])

print(forward_lin.score(data[step_forward_features], data['expenses']))
print(backward_lin.score(data[step_backward_features], data['expenses']))
print(full_lin.score(data.loc[:, data.columns != 'expenses'], data['expenses']))

Out:
Forward R2: 0.75
Backward R2: 0.75
Full model R2: 0.75