
In binary classification issues, the metrics AUC (Area Under the Curve) and ROC (Receiver Operating Characteristics) are frequently employed. AUC is a numerical metric that measures the performance of the classifier, whereas ROC is a graphical plot that shows the performance of a binary classifier.
ROC Curve:
The true positive rate (sensitivity) vs the false positive rate (specificity) for various threshold values of a binary classifier is plotted graphically using the ROC curve. It demonstrates how effectively the classifier can differentiate between the positive and negative classifications.
The receiver operating characteristic curve (ROC curve) is a graph that displays how well a classification model performs across all categorization levels. Two parameters are plotted on this curve:
- True Positive Rate
- False Positive Rate
True Positive Rate
The percentage of actual positives that the classifier properly classifies as positives is known as the true positive rate (TPR). Additionally known as sensitivity.
Recall is a synonym for true positive rate (TPR), which is defined as follows:
TPR = TP / (TP + FN)
False Positive Rate
The percentage of genuine negatives that are mistakenly labeled as positives is known as the false positive rate (FPR). The equation is 1 - specificity.
False Positive Rate (FPR) is defined as follows:
FPR = FP / (FP + TN)
The TPR vs. FPR graphic at various threshold values makes up the ROC curve. The ability of the classifier to differentiate between positive and negative classes is indicated by the area under the ROC curve (AUC). A perfect classifier has an AUC value of 1, whereas a random classifier has an AUC value of 0.5. More items are classified as positive when the classification threshold is lowered, which raises the number of both False Positives and True Positives. A typical ROC curve is shown in the accompanying figure.
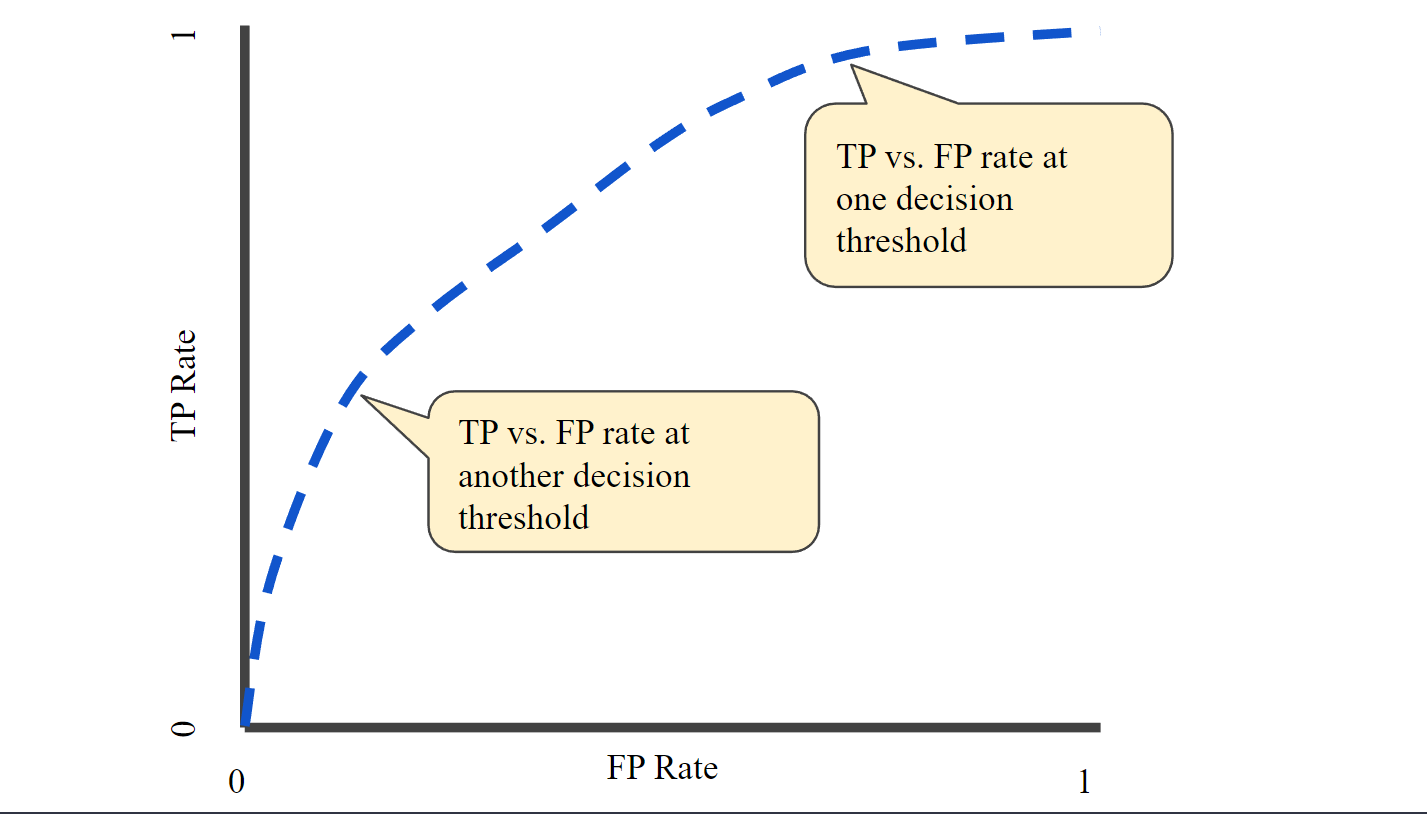
Figure- TP vs. FP rate at different classification thresholds
We might analyze a logistic regression model repeatedly with various classification criteria to generate the points on a ROC curve, but this would be inefficient. Fortunately, the efficient sorting-based method known as AUC can give us this information.
AUC: Area Under the ROC Curve
A binary classifier's performance is quantified by the AUC metric. It is the ROC curve's area under the curve. AUC has a range of 0 to 1, with 1 denoting a perfect classifier and 0.5 denoting a random classifier.
AUC, on the other hand, takes into account both true positives and false positives and is less affected by imbalanced data. In cases where the data is imbalanced and the positive and negative classes have different costs or benefits, accuracy can be deceiving because it can be high even if the classifier is biased towards the majority class.
Think about integral calculus while calculating the AUC; it measures the full two-dimensional region beneath the entire ROC curve from (0,0) to (1,1).
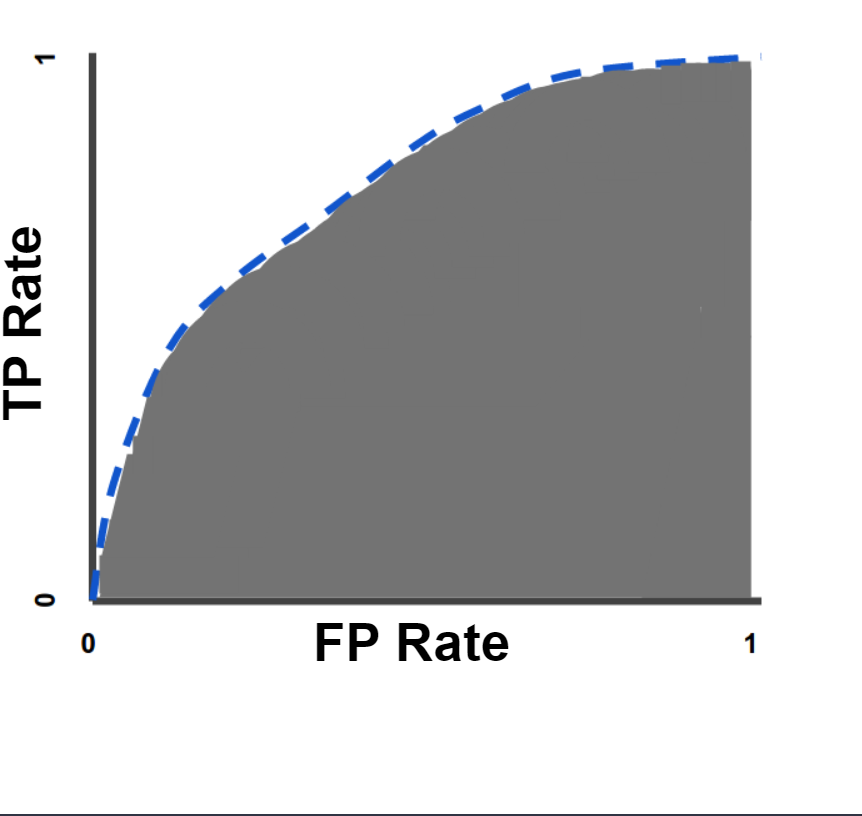
Figure- AUC (Area under the ROC Curve).
An overall measure of performance across all potential classification criteria is provided by AUC. AUC can be seen as the likelihood that the model values a randomly chosen positive example higher than a randomly chosen negative example. As an illustration, consider the cases below, which are listed in ascending order of logistic regression predictions from left to right:.
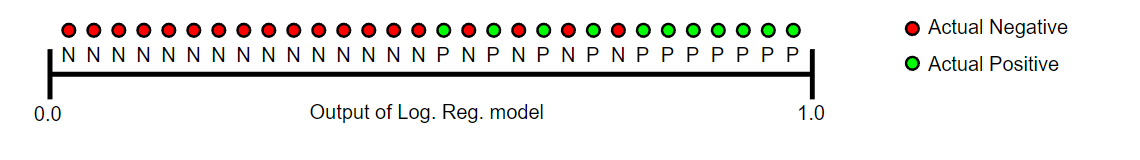
Figure- Predictions ranked in ascending order of logistic regression score.
The likelihood that a random positive (green) example will be placed in front of a random negative (red) example is represented by AUC.
AUC has a value between 0 and 1. A model with 100% incorrect predictions has an AUC of 0.0, while a model with 100% correct predictions has an AUC of 1.0.
AUC is desirable for the following two reasons:
- AUC is independent of scale. It rates predictions rather than evaluating the absolute values of the predictions.
- Thresholds for classification have no impact on AUC. It assesses the precision of the model's predictions regardless of the categorization threshold that is employed.
However, there are limitations to each of these arguments that may reduce the applicability of AUC in specific use cases:
- Scale invariance is not always useful. AUC, for example, won't warn us when we actually need outputs with precise probabilities.
- It is not always desirable for the classification-threshold to be constant. When false positives and false negatives have such disparate consequences, it might be imperative to eliminate one type of classification error. For instance, while performing email spam detection, you probably want to prioritize reducing false positives. (even if that results in a significant increase of false negatives). AUC is not a useful measure for this type of optimization.
In conclusion, the ROC curve and AUC are two helpful measures to assess a binary classifier's performance. While the AUC is a numerical measure that shows the classifier's overall performance, the ROC curve gives a graphical picture of the classifier's performance at various threshold values.
| AUC (Area Under the Curve) | ROC (Receiver Operating Characteristics) |
|---|---|
| AUC is a metric that summarizes the overall performance of a binary classification model based on its ROC curve. | ROC is a graphical representation of the relationship between the TPR and FPR. |
| AUC provides a single number that summarizes the quality of the model's predictions. | ROC can be used to visualize the tradeoff between sensitivity and specificity at different decision thresholds. |
With this article at OpenGenus, you must have the complete idea of AUC (Area Under The Curve) and ROC (Receiver Operating Characteristics).