
htop is a Linux application used for real-time process monitoring. Unlike top command, it comes with many features which makes process management easier. In this article we discuss htop commands, options, shortcuts.
Table of contents.
- Introduction.
- Syntax.
- Output.
- Shortcuts.
- Commands
- Summary.
- References.
Pre-requisites:
Introduction.
htop is a linux application used for real-time process monitoring.
It can be used as an alternative to the top command since it comes with great features such as, horizontal and vertical scrolling to view full command lines, ability to kill multiple processes without using the PID, no need enter a number to re-nice a process, quick startup since it doesn't fetch data, mouse friendly i.e selecting list items and much more, which are not possible with the top command.
Professionally, htop command is used to:
- See how well a given process/ benchmark utilizes the available CPU cores.
- This is used to check how processes scale as the input size increases. It can happen that a process utilizes near 100% core for small data size but for larger data, utilization goes down.
htop is a must command to know for Software Developers.
Syntax.
The syntax is as follows,
htop
You can also use options such as,
-C or --no-color, to use a monochrome color scheme.
-d --delay=DELAY, to delay updates - since it is real time.
-F --filter=FILTER, to filter out commands matching a filter.
-H --highlight-changes=[=DELAY], to highlight new and old processes.
-M or --no-mouse, to disable the mouse.
-p --pid=[PID, PID...], to display only specified PIDs.
-s --sort-key=[COLUMN] to sort by column in the list view.
-t or --tree, to show the tree view.
-u --user=USERNAME to show processes for a given user.
Output.
In this section we cover the output of htop command.
CPU usage
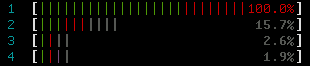
Blue, displays percentage of CPU used by low priority processes, i.e these have a nice value > 0.
Green, represent percentage of CPU used by processes owned by normal users.
Red, represents percentage of CPU used by system processes.
Orange, CPU percentage for processes used by IRQ time.
Magenta, CPU percentage for soft IRQ time processes.
Gray, percentage of CPU consumed by I/O wait time.
Cyan, CPU percentage consumed by steal time.
The numbers on the left represent CPU cores. In this case we have 4 processor cores.
Memory usage

Green, percentage of RAM consumed by memory pages.
Blue, RAM consumed by buffer pages.
Orange/Yellow, RAM consumed by cache pages.
Tasks, Threads, Processes, Load Average, Uptime
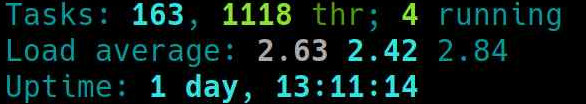
From the image above, we have 163 tasks which are divided among 1118 threads and from these 4 are in a running state.
States can be running, traced/stopped, zombie/defunct or sleeping, we have discussed Linux processes in another article, link provided in the references section.
Load average refers to the average load of the system, from the image we have the load average for the last minute, the last five minutes and for the last 15 minutes.
Uptime is the systems uptime since the last reboot.
Process information

PID, is the process ID.
USER, is the owner of the process.
PRI, is the priority of a process.
NI, is the process priority reset by the user of root.
VIRT, is the virtual memory a process is consuming.
RES, is the physical memory a process is consuming.
SHR, is the shared memory a process is consuming.
S, the current state of the process, S for sleeping, R for running, etc.
CPU%, processor percentage consumed by a process.
MEM%, memory percentage consumed by a process.
TIME+, time since process execution started.
Command, full command execution parallel to each process.
Shortcuts.
Arrow keys are used to scroll, i.e top, right, bottom, left.
u displays processes by a particular user. After pressing u, select a user and press enter, all processes pertaining to that user will remain after filtering.
P, sorts processes according to CPU consumption(highest first).
M, sorts them according to memory consumption(highest first).
T, sorts according to time period.
K, to display kernel threads.
H to display user threads.
l, to display files related to processes.
h, for help.
esc to escape e.g h, u
Ctrl+l, to refresh process related information.
Ctrl+c to exit htop.
Other shortcuts.

- f1 for help while in htop.
- f2 is used for setting up the screen whereby we can configure meters which is are at the top of the screen containing CPU usage and task statistics, display options which define how processes information is being viewed, colors defining the coloring scheme, columns used for removing and adding columns in relation to processes.
- f3 for searching for a process, after pressing f3, you just type in the processes you want to search for. As you type matched processes will be highlighted and you can cycle through found matches using f3.
- f4 for filtering processes, after pressing f4, type in the filter you want to filter by and the processes will be filtered in real time.
- f5 which switches between the tree and list display of processes.
- f6 provides options to sort the processes by. You can move through the list, using the arrow keys, and press enter when you select a sorting mechanism.
- f7 and f8 increase and decrease the niceness value of a process respectively. This action is only possible by a super user, therefore if one is not a super user, Ctrl+c to quit htop the sudo htop to execute with super user rights. Select a process either by mouse or arrow keys, the fn+f7 to increase process niceness value and fn+f8 to decrease process niceness value. Note that a -ve means we are increasing process priority and a +ve means we are decreasing it.
- f9 is used to kill a process, first you make sure a process is selected then fn+f9 to kill it.
- f10 is used to quit htop.
To use function keys, you might have to press fn together with the function number key, e.g fn+f5 for switching between tree and list view.
Commands.
We can also execute htop at the command line and pass options, for example,
To delay the updating of processes by a one second delay, we write,
htop -d 10
To filter by PID, we write,
htop -p 13, 1481, 34
The above command will return processes with the PIDs 13, 1481 and 34.
To sort by time, we write,
htop -s TIME
Summary.
With htop one can monitor, increase or decrease priority, kill, sort processes and much more.
A use case for htop is identifying processes consuming a high amount of system resources such as memory or CPU and killing them or incrementing or decrementing a process's priority by super users to limit normal users from taking up alot of system resources.
References.
- Linux process management.
- Execute the command htop --help or man htop for its manual page.