
Reading time: 20 minutes | Coding time: 5 minutes
Logistic Regression is an efficient regression algorithm that aims to predict categorical values, often binary. It is widely used in:
- the medical field to classify sick and healthy individuals
- areas that need to determine a client's risk, such as insurance and financial companies.
In statistics, the logistic model is a widely used statistical model that, in its basic form, uses a logistic function to model a binary dependent variable
We encounter a lot of problems in today's world, which involve categorical data. One such widely popular example is right in your inbox. Out of all the emails, a classification model can classify each email as either spam, or not spam. In such algorithms, there is a target variable, which is binary, for binary classification problems.
This implies, that the target variable (Y), can be thought of as either 1 or 0. An email, is always going to be one of either spam (Y=1) or not spam (Y=0).
Such problems are called binary classification problems. Classification algorithms can also be applied to Multi-Class Classification problems, where the target variable can have more than two different categories.
Need for logistic regression
Let's assume a simple problem, with our Input feature (X) on the X axis, and the Target variable (Y) on the Y axis. We need to train a model, with the dataset as given as:
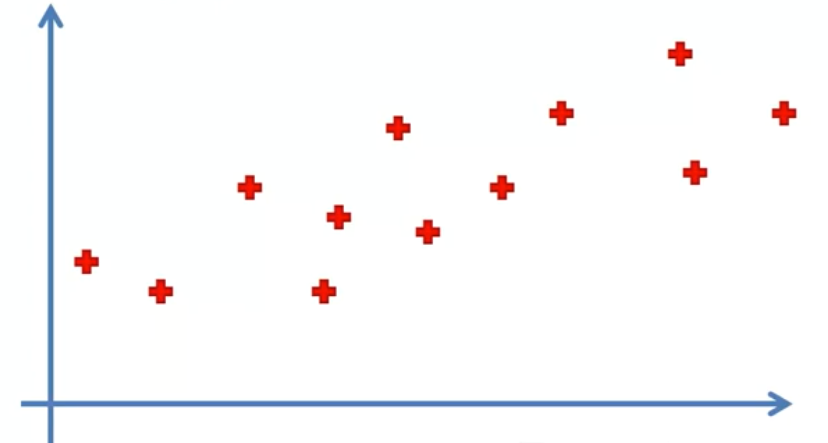
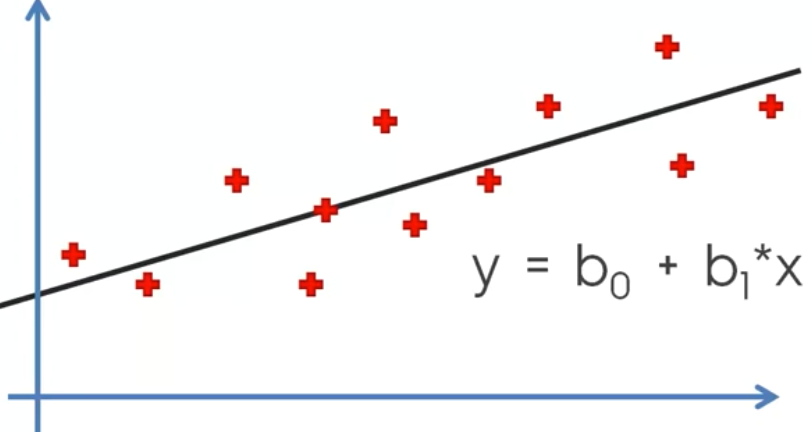
Now, this is a fairly simple regression problem, and can be easily fitted by a linear regression line as shown here:
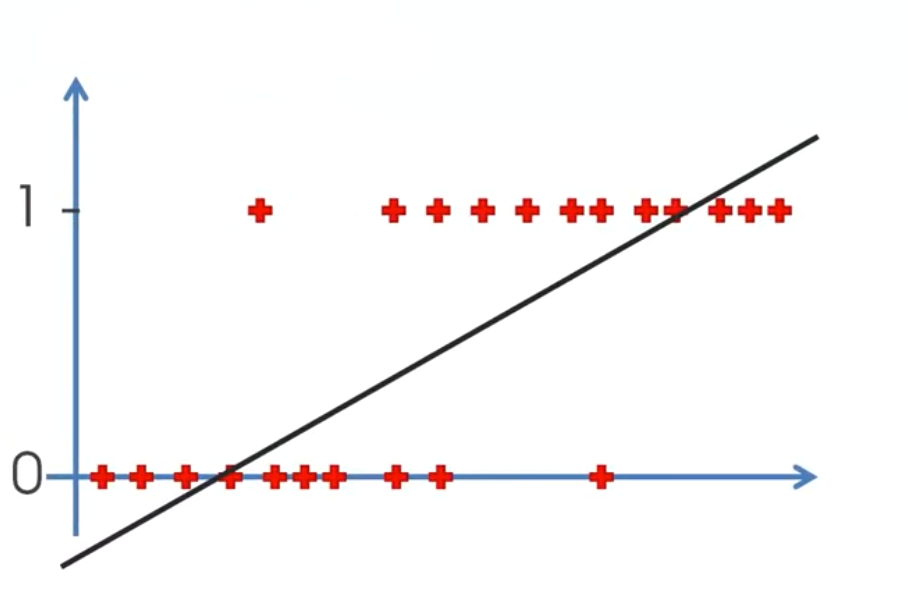
Now, let's take a different dataset, with the points distributed in such a way, that they seem to form two categories, Y=0 and Y=1.
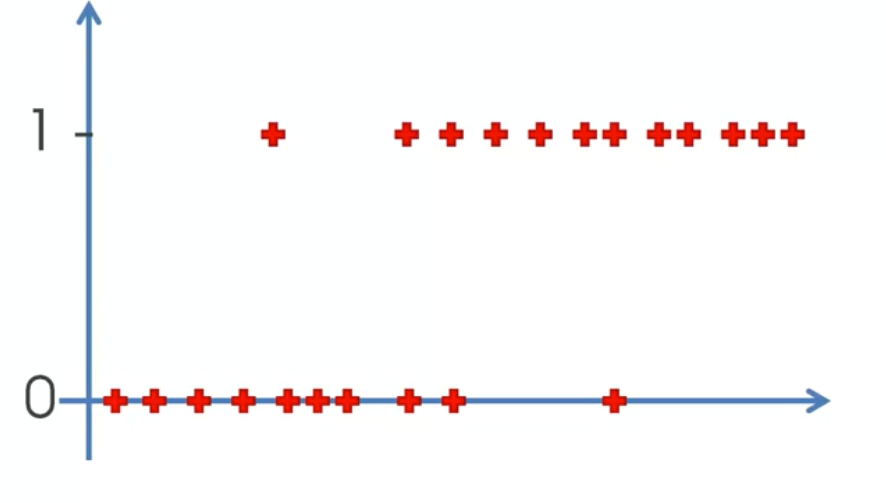
In such cases, it becomes difficult to fit a good regression model. This is because we need a model that can output values that lie between 0 and 1. A regression line will incorporate values even lesser than 0, and greater than 1. This does not logically make sense. Regression also changes drastically to accommodate outliers in our dataset. That change, due to one or two outliers, may affect the predictions on all the other points. Also, a regression line will have a high loss function, as it is not passing close to all the points, as clearly shown.
Hence, we need such an algorithm, that is:
1. Non linear, so as to fit all the points in such a way that they seem to belong to the decision boundary.
2. Restricted between 0 and 1, as our output target variable lies only between 0 and 1.
3. Is robust to the presence of outliers
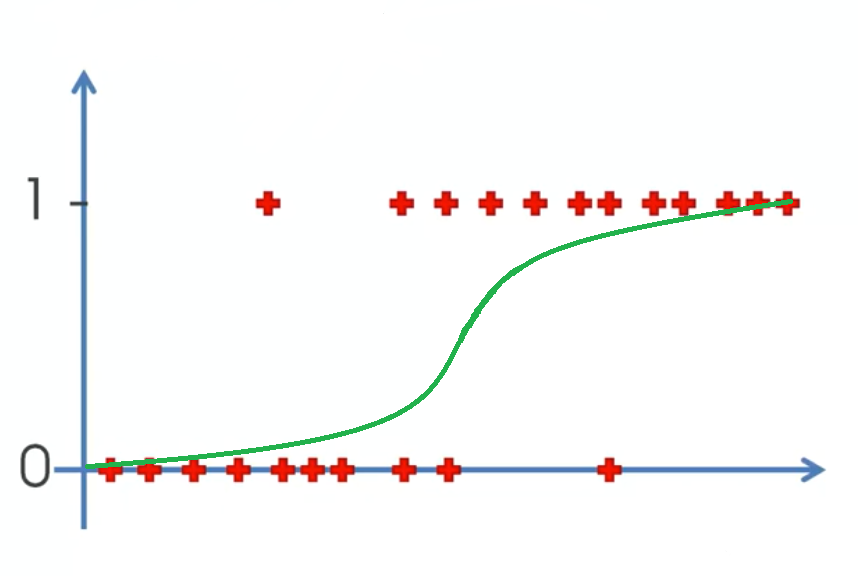
Logistic Regression, is very useful here, as it used a sigmoid function in order to calculate the probabilities of each point lying in either of the 2 classes.
Sigmoid function
In the previous section, we talked about logistic regression solving a lot of issues by using a 'sigmoid' function.
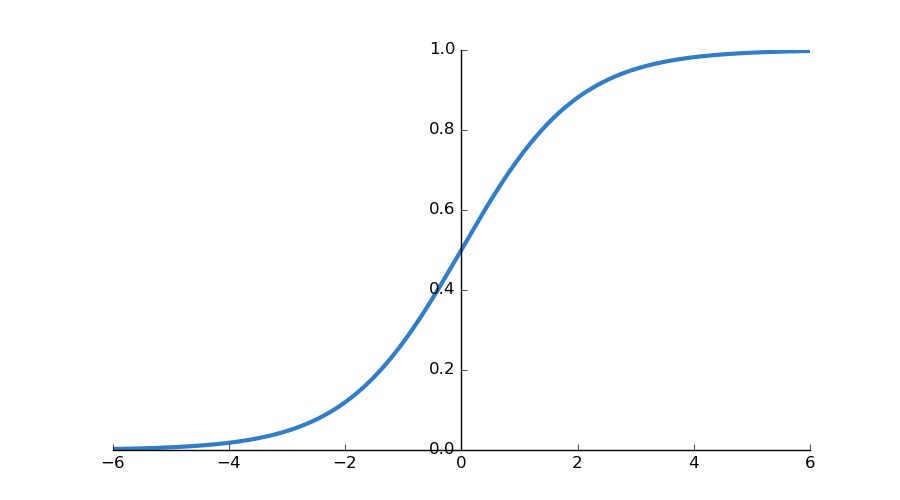
A sigmoid function is written as: Y = 1 / (1 + e^(-x)).
We can immediately notice from the definition of the function, that no matter what the value of x, Y will be between 0 and 1. This is a very important property of the sigmoid function for logistic regression.
The use of a sigmoid function helps in fitting a better model, also because it is non-linear, so it can have a gradual curve, thus fitting categorical data better as we saw in the above example.
Logistic Regression equation
We realized earlier, that logistic regression calculates the probabilities of a point lying in either class, and not the fixed result that it will lie in either one of the classes.
Therefore, the output prediction (Y), will be expressed as probability P.
This idea works well partly because of the fact that the sigmoid function used, outputs the value of Y to be strictly between 0 and 1, and the same restriction is applied on probability as well, that the probability of anything must lie between 0 and 1.
Logistic Regression can be understood by the equation given below, where the LHS represents the 'logit' function.

This equation is basically another representation of
Y = sigmoid(theta), something we understand logistic regression as. It is important to note here, that the logit equation and the sigmoid form equation are equivalent, and derivable from each other.
Here,
Y = Target variable
theta = Input features
B0, B1 .. Bk are the parameters to be trained
X1, X2 ... Xk are the input features of the model
Input features are represented as:
theta = B0 + B1X1 + B2X2 + ...... BkXk,
Advantages
- Easy to handle independent variables categorical;
- Provide results in terms of probability;
- Ease of classification of individuals in categories;
- Requires small number of assumptions;
- High degree of reliability.
Code
Applying logistic regression to a dataset in Python is made really simple by using the Logistic Regression class present in the scikit learn library. This, like most other Machine Learning algorithms, follows a 4-step approach to building the model.
STEP 1: Import the model we need:
from sklearn.linear_model import LogisticRegression
STEP 2: Define the model: Create an instance of the class
model = LogisticRegression()
STEP 3: Train the model: Fit input features (X) and target variable (Y)
model.fit(x_train, y_train)
STEP 4: Make predictions based on the model: Use test input features to predict values
y_test = model.predict(x_test)