
Get this book -> Problems on Array: For Interviews and Competitive Programming
Reading time: 30 minutes | Coding time: 10 minutes
In this article, we will implement polynomial regression in python using scikit-learn and create a real demo and get insights from the results.
First of all, we shall discuss what is regression.
Regression
The statistical methods which helps us to estimate or predict the unknown value of one variable from the known value of related variable is called regression.
Determing the line of regression means determining the line of best fit.
Polynomial Regression
Polynomial Regression is a form of linear regression in which the relationship between the independent variable x and dependent variable y is not linear but it is the nth degree of polynomial.
The equation for polynomial regression is:

In simple words we can say that if data is not distributed linearly, instead it is nth degree of polynomial then we use polynomial regression to get desired output.
Let us see an example of how polynomial regression works!
We are using the same dataset, in which we want to predict the salary for a new employee whose level of experience is 6.5 and he said that the previous company paid him 160000 and he wants a higher salary and we have got some data which has three columns- Position, Level and Salary. then here we will use polynomial regression to predict his salary based on the data we have.
In this example we will apply linear regression as well as polynomial regression on the same dataset and will see the results of both the models.
#importing the libraries
import numpy as np
import pandas as pd
import matplotlib.pyplot as plt
%matplotlib inline
Importing the libraries numpy for linear algebra matrices, pandas for dataframe manipulation and matplotlib for plotting and we have written %matplotlib inline to view the plots in the jupyter notebook itself.
Now we will import the dataset.
#importing the dataset
dataset=pd.read_csv('Position_Salaries.csv')
you can get more information on dat by typing
dataset.info
The datset is:
   Position            Level  Salary
0   Business Analyst      1    45000
1  Junior Consultant      2    50000
2  Senior Consultant      3    60000
3            Manager      4    80000
4    Country Manager      5   110000
5     Region Manager      6   150000
6            Partner      7   200000
7     Senior Partner      8   300000
8            C-level      9   500000
9                CEO     10   1000000
Now we divide the dataset into X and y,where X is the independent variable and y is the dependent variable.
X=dataset.iloc[:,1:2].values
y=dataset.iloc[:,2].values
Now, we will fit the linear regression model to the dataset.
#fitting the linear regression model to the dataset
from sklearn.linear_model import LinearRegression
lin_reg=LinearRegression()
lin_reg.fit(X,y)
Now we will fit the polynomial regression model to the dataset.
#fitting the polynomial regression model to the dataset
from sklearn.preprocessing import PolynomialFeatures
poly_reg=PolynomialFeatures(degree=4)
X_poly=poly_reg.fit_transform(X)
poly_reg.fit(X_poly,y)
lin_reg2=LinearRegression()
lin_reg2.fit(X_poly,y)
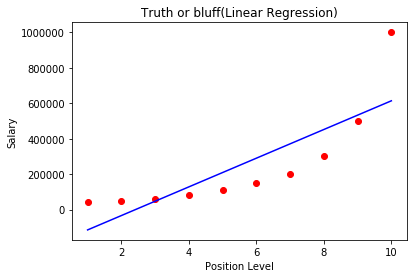
Now let's visualize the results of the linear regression model.
#Visualisng the linear regression model results
plt.scatter(X,y,color='red')
plt.plot(X,lin_reg.predict(X),color='blue')
plt.title('Truth or bluff(Linear Regression)')
plt.xlabel('Position Level')
plt.ylabel('Salary')
plt.show()
The output of the above code:
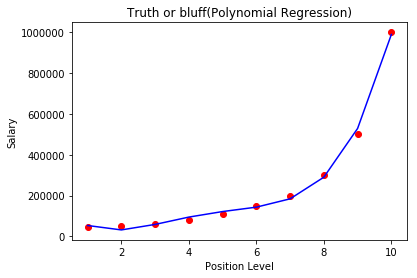
Now let's visualize the results of polynomial regression model.
#Visualising the pollynomial regression model results
X_grid=np.arange(min(X),max(X),0.1)
X_grid=X_grid.reshape((len(X_grid),1))
plt.scatter(X,y,color='red')
plt.plot(X,lin_reg2.predict(poly_reg.fit_transform(X)),color='blue')
plt.title('Truth or bluff(Polynomial Regression)')
plt.xlabel('Position Level')
plt.ylabel('Salary')
plt.show()
The output of above code:
Now let's predict the result of linear regression model.
#predictig the result of linear regression model.
lin_reg.predict( array([ [6.5] ]) )
Output of the above code:
array([330378.78787879])
It predicts 330378, which is not even close to what the person said.
Now let's predict the result of polynomial regression model.
#predicting the result of polynomial regression.
lin_reg2.predict( poly_reg.fit_transform(array([ [6.5] ]) ))
Output of the above code:
array([158862.45265153])
It predicts 158862.452, which is quite close to what the person said. This means that the polynomial regression models gives us a much more accurate prediction.