
In this article, we will go over how do we design a navigation application like Google Maps.
Table of contents:
- What is Google Maps?
- Primary requirements
- Designing the system
- Using a Quad-tree
- Sub-systems involved
- Low-level design of Google Maps
- Technologies used in building Google Maps
- Limitations in design
- Storage Server
What is Google Maps?
Google Maps is a web-based tool that provides precise knowledge on geographic areas and locations all over the world. Aerial and satellite views of numerous locations are available on Google Maps in addition to traditional road maps. Google Maps provides street views based on images obtained from automobiles in several cities.
Google Maps has undoubtedly made our lives easier. Whether you're looking to discover a new city, plan a road trip, locate the shortest route to the airport, or escape traffic on your way to work, Google Maps can help. Simply key in your destination and you'll be taken to the ideal path. It appears to be really straightforward. However, everything that happens in the background, from inputting your destination to determining your route, is far from easy. So, let's take a closer look at what goes into designing the Google Maps.
The design of Google Maps is one of the most challenging system designs since so many factors must be taken into account when creating such a large system. We'll start with the fundamentals and look at the Google map's primary requirements.
Primary requirements
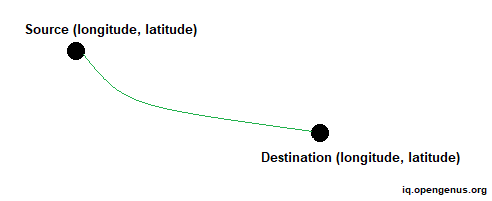
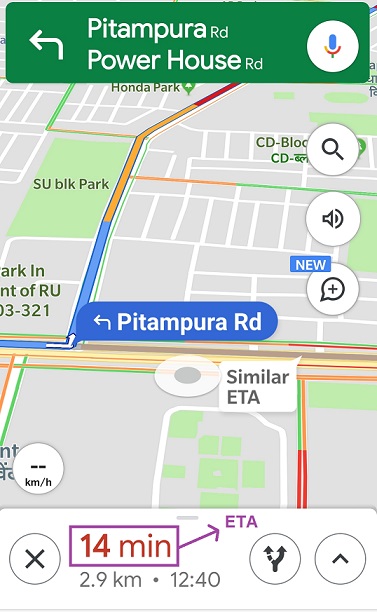
- While using the map, the user will select a destination and according to the longitude and latitude of the source and destination that the user selected in their system, the map should suggest some path, which is the optimal path to reach the destination. If a user needs to go from point A to point B, the system should offer information on the route they should take, how much distance they must cover, and how long it will take, i.e. the ETA (Estimated Time of Arrival) from point A to point B. It should offer two or three routes in the enhanced version, and the user should be able to pick between the shortest distance and the shortest time.
- The ETA between the source and the destination is affected by a variety of factors such as traffic, weather conditions, and road work. All of these things must be taken into account while constructing our system. It should be created without any traffic data and have a very pluggable model. Adding traffic, weather, an accident, or a roadblock afterwards should be quick and easy.
- It should request data from the government to establish road routes. Although the government may not have all of the information, it is an excellent place to begin. It should even employ user data to improve current route data to determine whether a road is single lane, double lane, and so on. Basically, it should always track the user's location and movement. Let's imagine we're on the road; map can use real-time data to calculate the time it will take to go from places to places.
High availability, good accuracy, decent speed, and scalability (up to 1 billion active users per month and 5 million business users) are some of the additional requirements. Weather conditions, road quality, accidents, and roadblocks should all be considered when calculating the ETA.
The estimated arrival time should not differ significantly from the actual arrival time. This system should never fail. We don't want our consumers to become disoriented. Because a service like Google Maps generates a large number of requests per second, it must be structured in such a way that it can manage these demands as well as any spikes in demand.
Finally, the purpose is to discover an efficient path between two spots.
Designing the system
Consider the following scenario. We want to find the distance between locations A and B on our map. One obvious answer is that each unique point on the map has a unique longitude and latitude value, therefore we can use any technique to calculate the distance between two locations, i.e. source and destination. However, this approach will not work in the real world because the application will be used by millions of users and there are billions of different routes present around the world, and the users will be using these roads at the same time, so these mathematical computations will not work in the real world.
One possible option is to cache all distances and ETAs between significant junctions and use them as needed. However, in this situation as well, a massive cache will be required to hold the distance and ETA information between significant intersections. Also, amid traffic, the ETA changes every ten minutes, making it hard to store. If a new route between source and destination is constructed, the map must discover an efficient path and update the route if the user deviates. We'll go over each of these issues one by one.
Using a Quad-tree
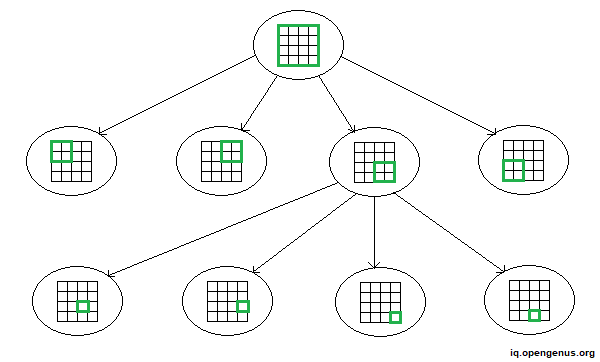
Assume that we need to discover the best path between two spots in our scaled map. We may currently disregard elements such as traffic, weather, and so on. The quad-tree approach is used for this. In scenarios where we need to determine the time or distance between two locations on a map, we employ quad-tree. The root of the quad-tree symbolizes the global map, while all of the branches represent distinct areas. So, basically, the world map is broken into sub-regions until we reach a specified region, such as one with length and width of one kilometer. This area is recognized as the quad-tree leaf.
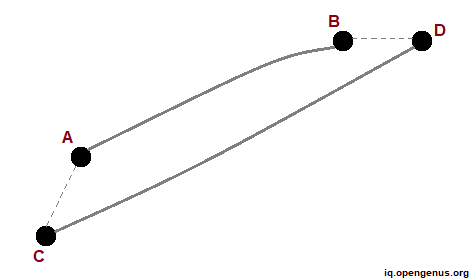
Assume we need to calculate the distance across two points A and B within the leaf area. One apparent option is to employ a distance algorithm to calculate the distance between A and B and save the result in our cache. Consider points C and D. To get the distance between C and D, we may compute the distances AC and BD and utilize the distance AB.
To summarize, if we need to find the distance between two places, we may utilize distance algorithms as well as data from cache.
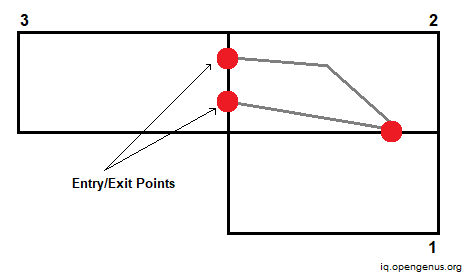
Now what if the user wishes to go from one region to another? We'll utilize what's known as entrance and exit points (denoted by red dots). There are specific places of entry and exit between two regions or leaves. We compute and save the distance between these two points. We may then utilize this distance to determine the most effective path.
Assume we need to compute the distance between points X and Y. We can accomplish this by utilizing the cache to determine the distance between entry/exit points e1 and e3, and then calculating the distance between X and Y and their corresponding entry/exit points.
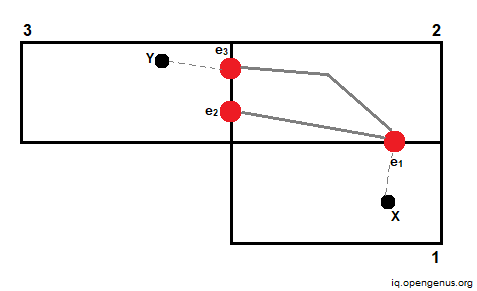
We cache the shortest distance to cross the region and then the entire distance across the region.
What about ETA now? The ETA is difficult to determine since it is influenced by a variety of factors. We must consider traffic, weather conditions, crowded places, and other factors when calculating the ETA between two sites on a map. One way is to collect real-time data from various users and then compute ETA based on it. Consider computing ETA between two points. We leverage user data to compute standard deviations, analytics, and so on to generate an approximate ETA between the provided places.
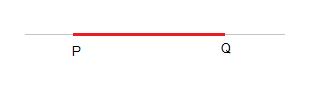
We must display quantifiable data on the map. As a result, we generate a table in which we calculate the ETA. The traffic is represented by this table. Assume we compute the ETA between locations P and Q to be 60 minutes. Because the journey takes a long time, it will be indicated in red. Similarly, we may color-code different routes based on the value of ETA. In this way, we can quantify our data and plot it on a map.
Sub-systems involved
Let's have a look at which services are involved in our system.
-
User Location Service - It is primarily employed for user profiling. The user device provides the user's continuous location, which is recorded in a virtual database for later analysis. We need to conduct a lot of real-time data streaming and analytics in a Google Maps sort of service. As a result, it is preferable to employ a technology such as Spark streaming or Kafka in our system.
-
Route Update Service - Our map recommends a single path to the user. Assume the user takes a new path, then we add this new route in our system depending on its location. We constantly upgrade our map system in this manner.
-
Find Location Service - This service provides longitude and latitude information for each point on the map. For these sorts of search queries, we often employ elastic search, where we maintain all geographical locations as well as their accompanying latitude and longitude coordinates.
-
Get Historical Info Service - To determine the ETA, we can utilize previous traffic data at a certain location or at a specific time. Suppose on a Friday night, there is significantly more traffic between two points. We can run some analytics and then deliver the ETA to the user based on this previous data.
-
Traffic Update Service - As the name implies, this service obtains real-time ETA data in the routes depending on traffic, and then updates the details in the associated NoSQL database. It also updates all of the pathways that cross the high-traffic path.
-
Route Processing Service - This is the most crucial service. When a user sends a query, it computes the distance between two places. It calculates distance using data stored in the database's tables, or it does computations using various techniques when the information is not present in the database.
-
Navigation Tracking Service - This service monitors users in real time. It also recommends a path to them. If the user deviates from the advised path, this is also recorded. If we advise a route from point A to point B to the user and the user deviates from the route and takes another route, the service will monitor that path and notify the user that they have deviated from the route. This service handles all contact with the user.
Low-level design of Google Maps
In our design, we will make advantage of all of the services mentioned above.
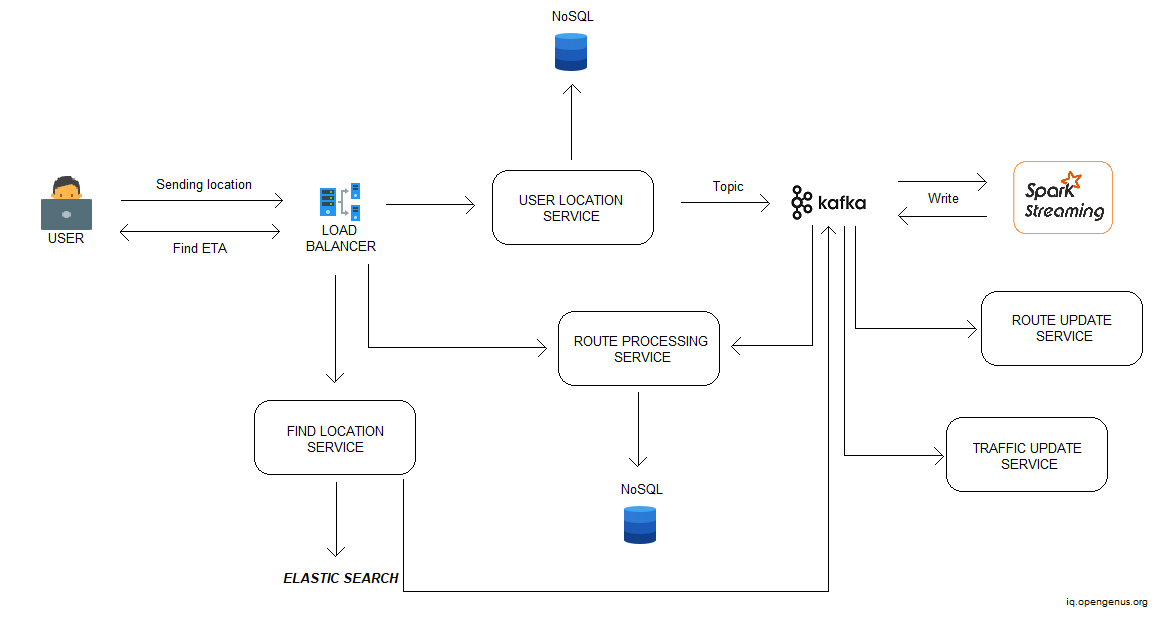
The user is utilizing a device such as a cell phone to access the map service. The application sends the user's location to the load balancer on a constant basis.
The information will then be sent to the service (User Location Service) via the load balancer. This service will profile users and update all of their information in the database (like Cassandra or MongoDB).
Now, the User Location Service will transmit that information to a specific topic in Kafka, and then to spark streaming, which will read that data. This module is in charge of all analytics. Spark streaming is used to analyze live data streams in a scalable, high-throughput, and fault-tolerant manner. It computes using complicated algorithms. If a user asks an ETA, the computation is performed using spark streaming using data contained in the database.
When the data is processed in this module, it may then send the processed data to a distributed file system such as Hadoop and apply machine learning techniques to it. We may also return the data and write it to a specific topic in Kafka. The data is then read by the Route Update Service and the Traffic Update Service.
Let's look at another scenario. Assume the user searches the map for the ETA between his current position and a desired destination. This request will also be sent to the load balancer, which will forward it to the Find Location Service. Using elastic search, this service will retrieve the destination's longitude and latitude. This data will then be pushed to the Kafka queue for further processing. All computations are then performed using the Route Processing Service and the latitude and longitude. It returns to the user the optimum route.
In the situation of disputed territories, the system displays a different map depending on the nation from which you are coming.
Technologies used in building Google Maps
Kafka - Kafka is a distributed publish-subscribe messaging system designed to be a quick, scalable, and long-lasting replacement for existing alternatives. It's made to handle massive message streams on cloud platforms for extremely low-latency analysis. It's very helpful when working with real-time data. Kafka maintains track of message feeds inside topics. Producers produce the data inside the topics, which are then consumed by consumers. Kafka is used over other alternatives like RabbitMQ, ActiveMQ, etc. because it is highly scalable, long-lasting, and dependable, with excellent performance.
Spark Streaming - Spark Streaming is a feature of the Spark API that allows data engineers and scientists to handle real-time data via Kafka, Flume, and Amazon Kinesis (Kafka in our case).
Spark Streaming's quick acceptance is due to the convergence of heterogeneous data processing capabilities. It allows developers to utilize a single framework to meet all of their processing needs. They can train models offline and then use them to score live data in Spark Streaming using Spark's machine learning framework.
NoSQL - A non-relational, distributed, flexible, and scalable database is known as a NoSQL database. The lack of a database schema, data clustering, replication support, and eventual consistency, as opposed to the conventional ACID (atomicity, consistency, isolation, and durability) transaction consistency of relational and SQL databases, are all frequent NoSQL database properties.
Cassandra - Cassandra is a distributed database management system designed to handle enormous volumes of data dispersed over numerous data centers and the cloud. It features a high scalability, high availability, and no single point of failure, which makes it unique. The User Location Service will profile users and update the Cassandra database with all of their information.
Hadoop - Hadoop is an open source platform for storing and processing huge datasets with sizes ranging from gigabytes to petabytes of data. Hadoop allows clustering multiple computers to analyze massive datasets in parallel, rather than using a single large computer to store and process the data. Because it was built to duplicate data across numerous nodes, Hadoop is extremely fault-tolerant. Each file is divided into blocks and copied many times across multiple machines, guaranteeing that the file can be recreated from other blocks if one system fails. Its high speed is what makes it popular. Google map sends its processed data to Hadoop for further analysis.
Elastic Search - Elastic Stack is a combination of software packages that can take and store data in any format and conduct search, analysis, and visualization in milliseconds or less. The Elastic Stack is built for developers to utilize directly to power a range of use cases. Humans produce 2.5 quintillion bytes of data per day, and an individual generates 1.7MB of data in a second, according to data. It is now a data-driven world. As a result, we require a system that analyses our data. There are two terms to be aware of:
- Analysis - In this step, you'll receive findings from previous data or data that you already have.
- Analytics - You want graphs-based visualization . and patterns in data for improved business clarity and to understand customer requirements when you wish to forecast them
All geographical locations, as well as their associated latitude and longitude data, are stored in elastic search. The Find Location Service will obtain the longitude and latitude of the destination using elastic search.
Limitations in design
The Earth's surface area is around 500 million km square. After eliminating 70% of the water and other unimportant areas, we are left with 10% of the area that should be mapped (50 million km square = 5 million km square).
Assume we have one image for each 10m x 10m block, and each image is 1 MB in size. Assuming two road-names and one building-name per image: 300 bytes per image. We'll have 100 x 100 such blocks per km square, which translates to 10,000 MB of photos per km square. We will require 5x10^(11) MB space for 5 million km square, which is 10^(12) MB = 1000 PB.
We also need to keep track of zoom levels. Assuming a zoom factor of 3.3, we must compute picture data at the following scale:
- 1000 PB/3.3 = 330 PB
- 330 PB/3.3 = 100 PB
- 100 PB/3.3 = 33 PB
- 33 PB/3.3 = 10 PB
So, 1500PB is the total upper bound.
Storage Server
Assuming that a single machine can manage around 15 TB of space, we would require 1500 PB/ 15 TB = 100,000 database shards. To manage read traffic and provide fail-tolerance, we would require some replicas for each shard. Assuming one master and two replicas per shard system, we'd require 300,000 database nodes, each with 15 TB of storage.
Managing 300,000 database nodes might quickly result in disaster. So, instead of depending just on horizontal scaling, we may also employ some vertical scaling. Let's look at how much memory a 64-bit system can address theoretically.
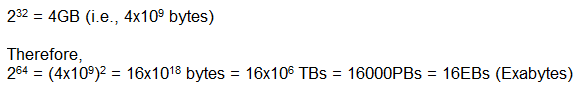
Thus, a 64-bit system may theoretically address 16 EBs of space and host all 1500 PBs of data on a single machine. In practice, however, computers with such large amounts of memory become prohibitively costly. So we don't know how to escape this problem of 300,000 servers, and to continue our investigation, we'd suppose that such a large number of servers are truly in operation.
This is how Google Maps' end-to-end processing works. With this article at OpenGenus, you must have the complete idea of System Design of Google Maps.