
Get this book -> Problems on Array: For Interviews and Competitive Programming
We use the vmstat command for system performance monitoring in Linux. It reports statistics about threads, system calls, CPU activity, memory, disks, and more.
We look at commonly used vmstat commands.
Table of contents.
- Introduction.
- Syntax.
- Commands.
- Summary.
- References.
Introduction.
We use the vmstat command to monitor system performance in Linux. With it, we get statistics about threads, virtual memory, processor activity, disk utilization, and more. We discuss commonly used vmstat commands and analyze their output.
Installation.
On CentOS and RHEL:
$ sudo dnf install sysstat
On Debian and Ubuntu:
$ sudo apt-get install syststat
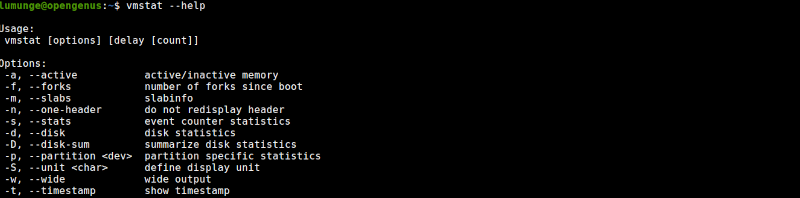
Syntax.
We write vmstat command in the following format:
$ vmstat --help
Commands.
To make sure vmstat was successfully installed we can execute it without any command options and analyze its output:
$ vmstat

From the output we have 6 columns:
- procs: This is where process statistics are listed: The r represents active processes and the b is for sleeping processes.
- memory: This is where memory statistics are listed. We have swpd - which is the total virtual memory, free - the total free memory, buff - memory used as a data buffer, cache - total cache memory.
- swap: Lists statistics involving swap space. We have si which represents the rate of swapping-in memory from the disk and so represents the rate of swapping-out memory to disk.
- io: List statistics about Input/Output. Here we have bi - which specifies the number of blocks received from a block device per second and bo - the blocks sent to a block device per second.
- System: Statistics involving scheduling. We have in representing the number of system interrupts and cs for the number of context switches.
- CPU: Lists statistics involving the processor. We have us - the percentage of processor time spent on non-kernel processes, sy - the processor percentage spent on kernel processes, id - the processor percentage when idle, wa - percentage on I/O waiting, and st - percentage on processor time stolen by virtual memory.
We define active memory as the memory that is currently being used by a running process while inactive memory is that that is allocated to a sleeping or inactive process.
To view active memory we use the -a option:
$ vmstat -a

Notice in the output that the buff and cache columns are replaced with inact and active columns listing inactive and active memory.
To list scheduling statistics we use the -s option:
$ vmstat -s
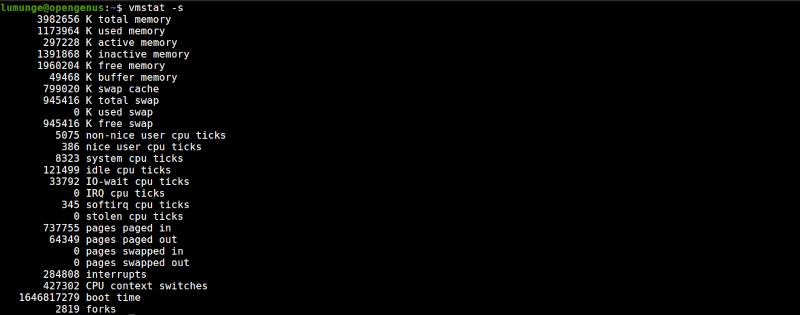
From the output we have the following sections:
- The first deals with the amount of memory used, here we have statistics for the total physical memory, currently used memory, active memory, inactive memory, free memory, buffer memory, cache memory, swap memory.
- The second section lists statistics involving the processor. Here we have:
** non-nice user cpu ticks: times the processor was used for high priority processes.
** nice user cpu ticks: times it was used for low priority processes.
** system cpu ticks: times used for kernel processes.
** idle cpu ticks: times it was idle.
** IO-wait cpu ticks: times used for I/O management.
** IRQ cpu ticks: times it received for interrupt requests.
** softirq cpu ticks: times it received software interrupts.
** stolen cpu ticks: times the virtual machine stole processor time. - The third section has values that are related to memory paging: Here we have the total pages paged in from virtual memory, the pages paged out to virtual memory, the number of pages reads from swap memory and the total pages written to swap memory respectively.
- The final section specifies various event counters. we have the number of interrupts since boot, the number of context switches, boot timestamps, and the number of forks.
For example, to list the number of forks since the host was booted, we write:
$ vmstat -f

The -D option is used to print out a summary of the statistics involving a disk:
$ vmstat -D
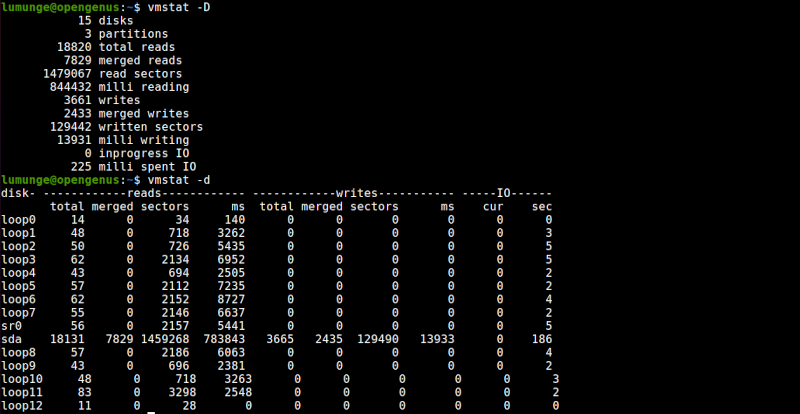
The -d option on the other hand gets us detailed statistics on a disk.:
$ vmstat -d
From the output of the above command we have four columns:
The first lists the disk.
The second column lists statistics involving reads. We have other four sub-columns, total is the number of disk reads, merged - the number of grouped reads, sectors - the number of sectors reads in, ms - the number of time taken to read data from the disk in milliseconds.
The third column lists statistics about writes, here we have total - the total number of disk writes, merged - the total number of grouped writes, sectors - the total number of sectors written to, and ms - time in milliseconds it took to write data to the disk.
Finally, we have disk statistics involving IO, here we have cur which is the total number of disk reads and writes, and sec the time spent for any -in-progress reads or writes.
To print out statistics about a single partition we use the -p option:
$ vmstat -p [partition name]

The -t option prints output along with its timestamps:
$ vmstat -t

A slab is a set of contiguous pages of memory set aside by a slab allocator for an individual cache. Slab allocation efficiently allocates memory to various data objects that are handled by the Linux kernel.
We can view slab statistics using the -m option with vmstat:
$ sudo vmstat -m
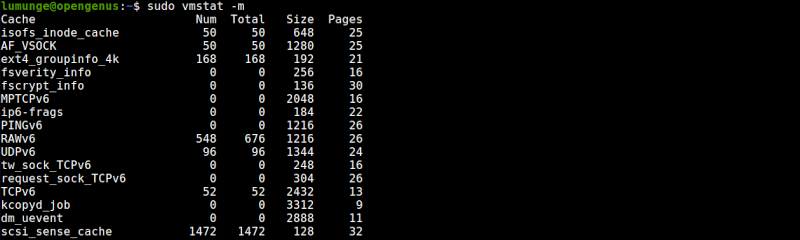
From the output we have the following columns:
- Cache, lists all cached data names.
- Num is the total objects in the Num cache.
- Total, is the total number of available objects in a specified cache.
- Size represents the size of each cached object.
- Pages are the number of memory pages with a cached object.
We can also list output in a human-readable format. The default sizes are listed in kilobytes to change it to megabytes we use the -S option followed by M standing for 1048576 bytes:
$ vmstat -S M

We can also use m which is 1000000 bytes, k for 1000 bytes, and K for 1024 bytes.
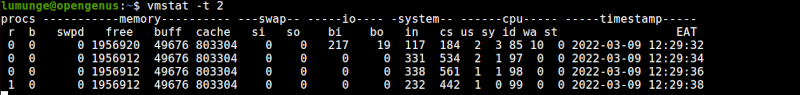
System statistics change frequently, to view statistics at specific time intervals we use the -t option followed by the number of seconds. For example, to vmstat output every two seconds we write:
$ vmstat -t 2
We can cancel this by pressing CTRL+C.
We can also specify a count value so that vmstat can know how many updates to perform before it exits. For example to update every 5 seconds 3 times we write:
$ vmstat 5 3
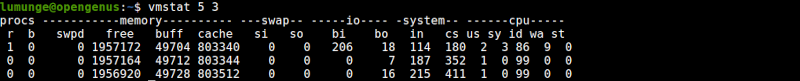
Now the updates will stop automatically after three are done.
Summary.
Linux apart from using RAM to manage memory also uses space on the disk - swap space to help manage this application memory as if it is an extension of RAM. This is what we call virtual memory. We use the vmstat command to monitor all things involving virtual memory, cpu, and disk. From the kernel writing memory into swap space to free it for another process, to the reads and writes to the disk.
References.
For the manual page for vmstat command, we write: $ man vmstat.