
In this article, we have explored what is Dapper, key concepts in Dapper and how Dapper is used in System Design.
Table of contents:
- Introduction to Dapper
- Design Principles
- Distributed tracing in Dapper
- Trace collection process
- General purpose Dapper tools
- Usage of Dapper
Introduction to Dapper
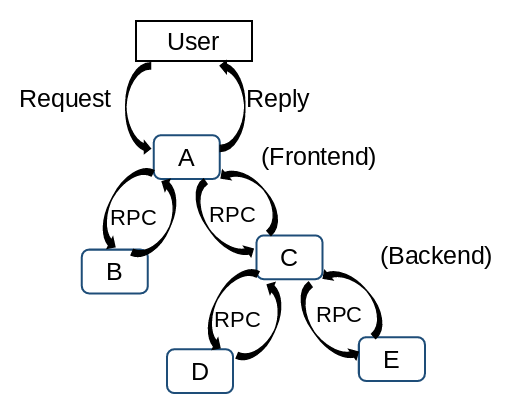
Dapper is a distribution tracing solutions developed by Google to provide their developers with more information about the behavior of complex distributed systems. Distributed systems are difficult to observe, not all problems could be pinpointed based on logs and statistics. For instance, a simple search query through the frontend server will be sent to multiple servers in the backend for processing. This include searching within its own index, specific category of results such as images, news, video and retrieving related advertising. One of these servers in the backend could be performing poorly which result in the delay in the overall response. It would be hard to pinpoint which service is causing the issue and the reason behind it.
Design Principles
These three design principles seek to fulfill the Ubiquitous deployment and continous monitoring requirements of Dapper.
Low overhead
In order to ensure the application team uses the tracing system, there should be negligible performance impact on the running services.
Application-level transparency
The tracing system should minimise the intrusive modifications in order to fulfil the ubiquity requirement.
Scalable
The tracing system should be able to scale with the growth of the applications over the next few years.
Distributed tracing in Dapper
Dapper traces is modeled using trees, spans and annotations. Spans are the basic unit of a Dapper trace tree. For each span, there is a human-readable span name, span-id and parent id. In a Dapper trace, there usually is a single span for each RPC and each level of infrastructure translate to an additional level in the trace tree.
The application team performing the Dapper trace could marked the trace with its own annotation. It can include value such as time stamps to help to analyze the time consumed at the application service level. It can also be other value or data which can help to investigate an incident.
Whenever a thread processes a traced control path, Dapper insert the trace context to the thread local storage. Trace context is a small, easy to copy container of trace id and span id
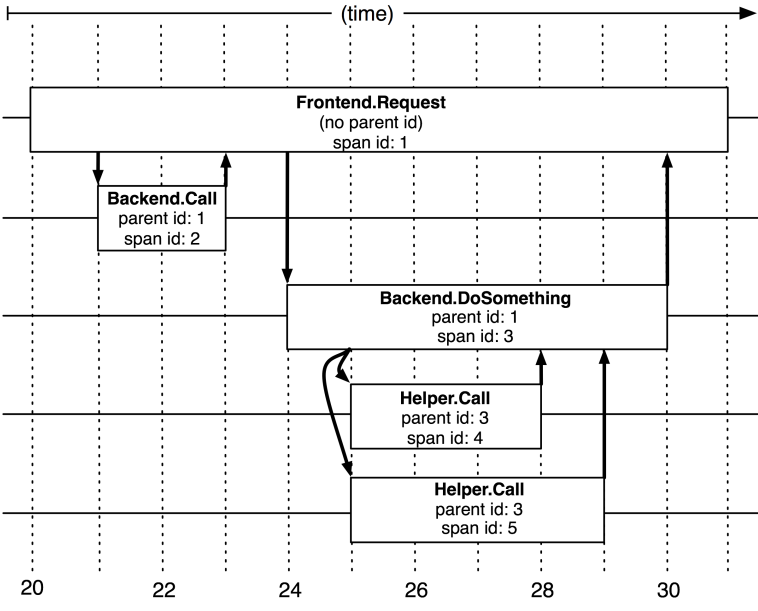
Dapper trace tree (Dapper a Large-Scale Distributed Systems Tracing Infrastructure, Google Technical Report dapper 2010)
Trace collection process
The logging process is divided into three steps. Firstly, the Span data is written to a local log file. Secondly, Dapper collectors daemon retrieve them from the production host machines. Lastly, the Collectors record the trace to a single Bigtable repository.
Instead of using Dapper, an alternative is to use RPC to collect information in the interface. However they are unable to handle non-nested distributed execution patterns such as asynchronous processes.
General purpose Dapper tools
Depot API
The Dapper Depot API (DAPI) provide directed access to the raw data contained within the Dapper trace repositories. Access can be performed via unique trace id or bulk access by leveraging on MapReduce. Furthermore, using Indexed access, whereby it map commonly requested trace feature to distinct dapper traces.
Dapper user Interface
Using the web-based user interface, the user selects the service, time window and the relevant metric value (such as time delay) for their investigation. A table of all performance summaries that meet this condition pattern will be retrieved. Next, the user can select a single distributed execution pattern for further examination. It will show the detailed timestamp distribution of the selected trace.
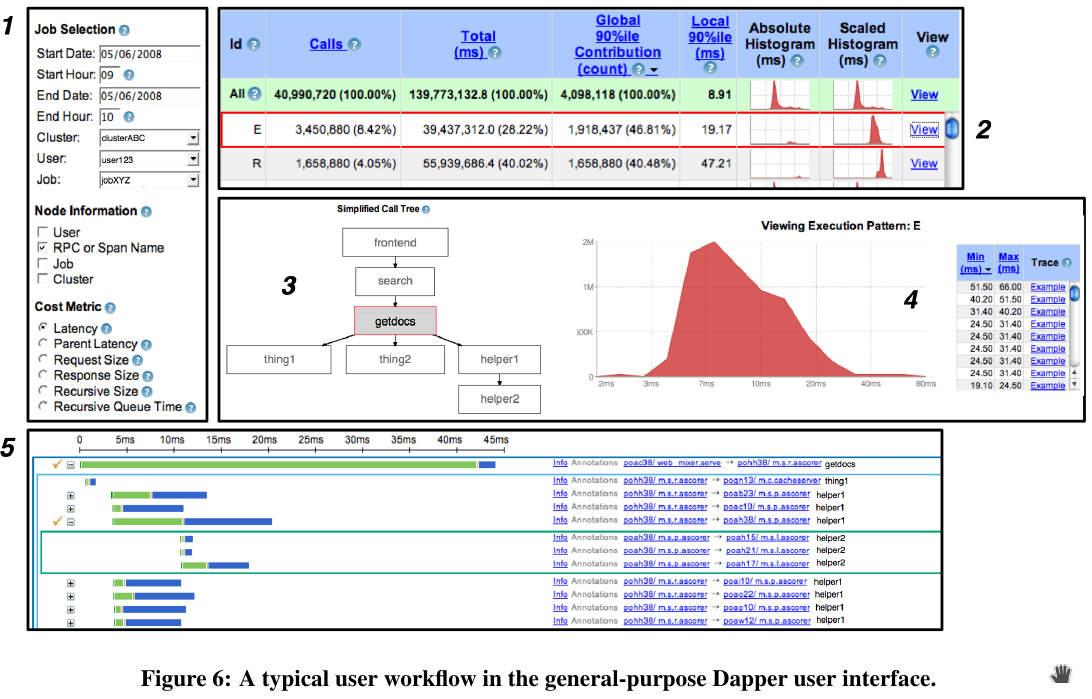
Dapper user interface (Dapper a Large-Scale Distributed Systems Tracing Infrastructure, Google Technical Report dapper 2010)
Usage of Dapper
Some example of Dapper usage are as follow. Dapper can be used during development to track progress against latency target and identified opitmization opportunities. In terms of addressing long tail latency, Dapper is able to validate critical path for universal search request and provide data to conclude performace issues.
Using Dapper core instrumentation and the trace annotations, we able to infere service dependencies between individual jobs and software infrastructures.
Dapper can be used to provide information with regards to the network usage of different services. The Dapper user interface can group and consolidate trace performace information across layered and shared storage systems.
Firefighting with Dapper can performed during catastrophic failure or services that experience high latency during normal workload. This is done by accessing the Dapper daemon directly to gather and look at fresh data to identify the root causes.
With this article at OpenGenus, you must have the complete idea of Dapper in System Design.