Open-Source Internship opportunity by OpenGenus for programmers. Apply now.
In this article, we have investigated the distinction between K-means and K-means++ algorithms in detail. Both K-means and K-means++ are clustering methods which comes under unsupervised learning. The main difference between the two algorithms lies in:
- the selection of the centroids around which the clustering takes place
- k means++ removes the drawback of K means which is it is dependent on initialization of centroid
centroids: A centroid is a point which we assume to be the center of the cluster.
cluster: A cluster is defined as a group or collection of data instances categorized together because of some similarities in there properties. algorithm which is used to solve unsupervised clustering problems.
We will go through K means Algorithm first, then explore the disadvantage of K means Algorithm and see how K means++ resolves this.
K-means Algorithm
K-means is one of the most straightforward algorithm which is used to solve unsupervised clustering problems.
In these clustering problems we are given a dataset of instances and the dataset is defined with the help of some attributes. Each instance in the dataset has some relevant values corresponding to those attributes. Our goal is to categorize those instances into different clusters with the help of k-mean algorithm.
Algorithm:
- The first step involves the random initialization of k data points which are called means.
- In this step we cluster each data point to it's nearest mean and after that we update the mean of the current clusters. mean: is the average of a group of values.
- This cycle continues for a given number of repetitions and after that we have our final clusters.
K-means Algorithm Example:
In this example we will be taking a dataset having two attributes A and B and 10 instances.
A Values: 13 , 14 , 2 , 5 , 23 , 27 , 66 , 1 , 69 , 62
B Values: 9 , 29 , 15 , 24 , 70 , 71 , 45 , 42 , 22 , 10
Note: In K-means we always have to predefine the number of clusters we want. In this example we will be taking k=3.
from pandas import DataFrame
import matplotlib.pyplot as plt
from sklearn.cluster import KMeans

points = {'A': [13,14,2,5,23,27,66,1,69,62],
        'B': [9,29,15,24,70,71,45,42,22,10]
       }

data = DataFrame(points,columns=['A','B'])

kpoints = KMeans(n_clusters=3, init='random').fit(data)
center = kpoints.cluster_centers_
print(center)

plt.scatter(data['A'], data['B'], c= kpoints.labels_.astype(float), s=50, alpha=0.5)
plt.scatter(center[:, 0], center[:, 1], c='black', s=50)
plt.show()
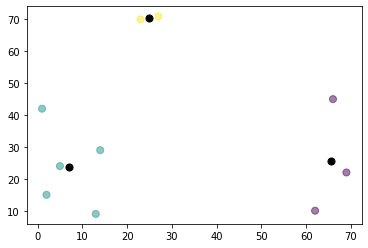
The Centroids are as follows:
| S.No | A | B |
|---|---|---|
| 1 | 65.66666667 | 25.66666667 |
| 2 | 7. | 23.8 |
| 3 | 25. | 70.5 |
Scatter Plot Representation:

Drawback of K-means Algorithm
The main drawback of k-means algorithm is that it is very much dependent on the initialization of the centroids or the mean points.
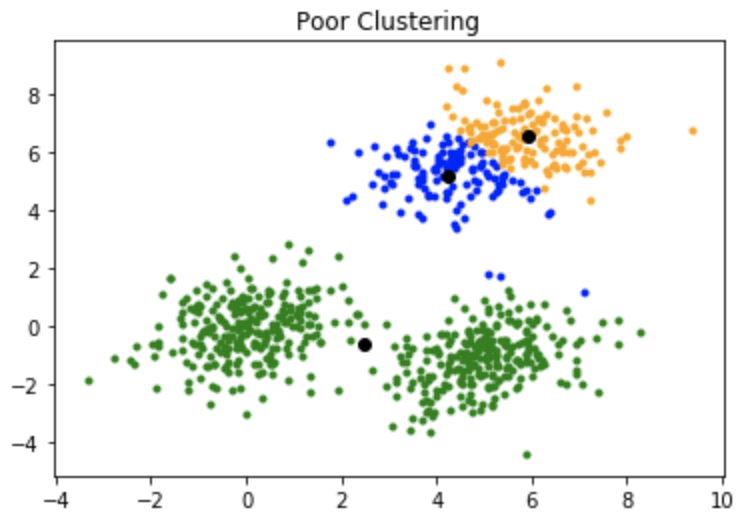
In this way, if a centroid is introduced to be a "far away" point, it may very well wind up without any data point related with it and simultaneously more than one cluster may wind up connected with a solo centroid. Likewise, more than one centroids may be introduced into a similar group bringing about poor clustering.
Example of poor clustering:

How K-means++ Algorithm overcomes the drawback of k-mean Algorithm ?
K-means++ is the algorithm which is used to overcome the drawback posed by the k-means algorithm.
This algorithm guarantees a more intelligent introduction of the centroids and improves the nature of the clustering. Leaving the initialization of the mean points the k-means++ algorithm is more or less the same as the conventional k-means algorithm.
Algorithm:
- In the starting we have to select a random first centroid point from the given dataset.
- Now for every instance say 'i' in the dataset calculate the distance say 'x' from 'i' to the closest, previously chosen centroid.
- Select the following centroid from the dataset with the end goal that the likelihood of picking a point as centroid is corresponding to the distance from the closest, recently picked centroid.
- Last 2 steps are repeated until you get k mean points.
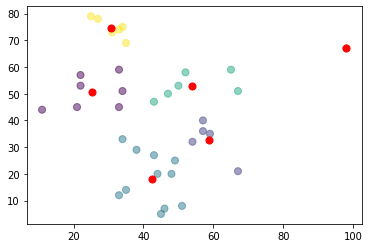
K-means++ Algorithm Example:
from pandas import DataFrame
import matplotlib.pyplot as plt
from sklearn.cluster import KMeans

Data = {'x': [25,34,22,27,33,33,31,22,35,34,67,54,57,43,50,57,59,52,65,47,49,48,35,33,44,45,38,43,51,46,33,67,98,11,34,21],
        'y': [79,51,53,78,59,74,73,57,69,75,51,32,40,47,53,36,35,58,59,50,25,20,14,12,20,5,29,27,8,7,45,21,67,44,33,45]
       }

df = DataFrame(Data,columns=['x','y'])

kmeans = KMeans(n_clusters=4, init='k-means++').fit(df)
centroids = kmeans.cluster_centers_
print(centroids)

plt.scatter(df['x'], df['y'], c= kmeans.labels_.astype(float), s=50, alpha=0.5)
plt.scatter(centroids[:, 0], centroids[:, 1], c='red', s=50)
plt.show()
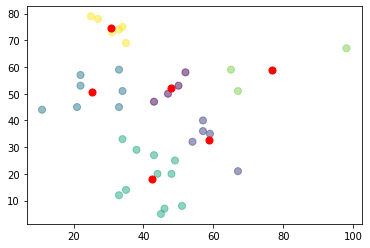
Contrast between K-means and K-means++:
K-means++

K-means

By following the above system for introduction, we get centroids which are far away from each other. This expands the odds of at first getting centroids that lie in various clusters.
