Open-Source Internship opportunity by OpenGenus for programmers. Apply now.
In this article, we have explored the difference between MaxPool and AvgPool operations (in ML models) in depth. In short, in AvgPool, the average presence of features is highlighted while in MaxPool, specific features are highlighted irrespective of location.
Pooling layer is an important building block of a Convolutional Neural Network. Max pooling and Average Pooling layers are some of the most popular and most effective layers. We shall learn which of the two will work the best for you!
Pooling layers are a part of Convolutional Neural Networks (CNNs). What makes CNNs different is that unlike regular neural networks they work on volumes of data.
Inputs are multichanneled images. Eg. RGB valued images have three channels
Features from such images are extracted by means of convolutional layers.
To know which pooling layer works the best, you must know how does pooling help.
Pooling
Convolutional layers represent the presence of features in an input image. But they present a problem, they're sensitive to location of features in the input.
This gives us specific data rather than generalised data, deepening the problem of overfitting and doesn't deliver good results for data outside the training set.
So we need to generalise the presence of features. This is done by means of pooling layers.
Here, we need to select a pooling layer.
In this article we deal with Max Pooling layer and Average Pooling layer.
Max Pooling - The feature with the most activated presence shall shine through.
Average Pooling - The Average presence of features is reflected.

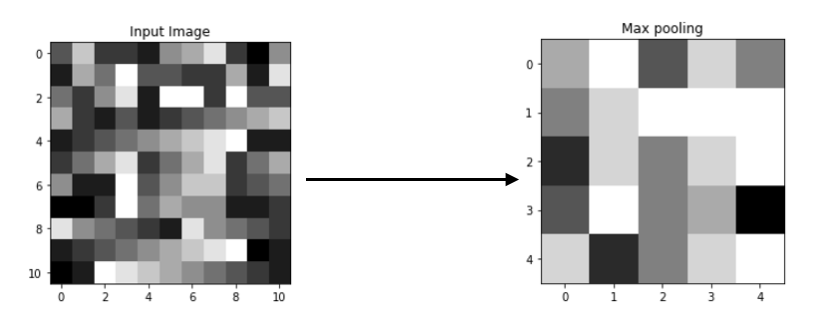
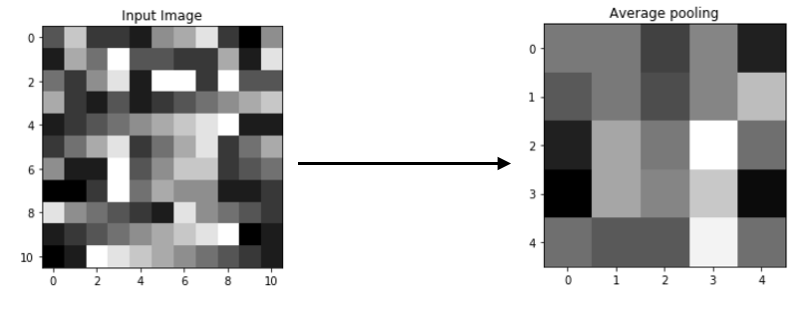
As you may observe above, the max pooling layer gives more sharp image, focused on the maximum values, which for understanding purposes may be the intensity of light here whereas average pooling gives a more smooth image retaining the essence of the features in the image.
Max Pooling
Pooling with the maximum, as the name suggests, it retains the most prominent features of the feature map.
Below is an example of the same, using Keras library
import numpy as np
from keras.models import Sequential
from keras.layers import MaxPooling2D
import matplotlib.pyplot as plt

# define input image
image = np.array([[3, 7, 2, 2, 1, 5, 6, 8, 2, 0, 5],
                  [1, 6, 4, 9, 3, 3, 2, 2, 6, 1, 8],
                  [4, 2, 5, 8, 1, 9, 9, 2, 9, 3, 3],
                  [6, 2, 1, 3, 1, 2, 3, 4, 5, 6, 7],
                  [1, 2, 3, 4, 5, 6, 7, 8, 9, 1, 1],
                  [2, 4, 6, 8, 2, 4, 6, 8, 2, 4, 6],
                  [5, 1, 1, 9, 3, 5, 7, 7, 2, 3, 4],
                  [0, 0, 2, 9, 4, 6, 5, 5, 1, 1, 2],
                  [8, 5, 4, 3, 2, 1, 8, 5, 4, 3, 2],
                  [1, 2, 3, 4, 5, 6, 7, 8, 9, 0, 1],
                  [0, 1, 9, 8, 7, 6, 5, 4, 3, 2, 1]])

#for pictorial representation of the image
plt.imshow(image, cmap="gray")
plt.show()

image = image.reshape(1, 11, 11, 1)

# define model containing just a single average pooling layer
model = Sequential(
    [MaxPooling2D (pool_size = 2, strides = 2)])

# generate pooled output
output = model.predict(image)

# print output image matrix
output = np.squeeze(output)
print(output)

# print output image
plt.imshow(output, cmap="gray")
plt.title('Average pooling')
plt.show()
Output Matrix
You may observe the greatest values from 2x2 blocks retained. This is maximum pooling, only the largest value is kept.
[[7. 9. 5. 8. 6.]
 [6. 8. 9. 9. 9.]
 [4. 8. 6. 8. 9.]
 [5. 9. 6. 7. 3.]
 [8. 4. 6. 8. 9.]]
The transition
The matrix used in this coding example represents grayscale image of blocks as visible below.

Average Pooling
Pooling with the average values. as the name suggests, it retains the average values of features of the feature map.
Below is an example of the same, using Keras library
import numpy as np
from keras.models import Sequential
from keras.layers import AveragePooling2D
import matplotlib.pyplot as plt

# define input image
image = np.array([[3, 7, 2, 2, 1, 5, 6, 8, 2, 0, 5],
                  [1, 6, 4, 9, 3, 3, 2, 2, 6, 1, 8],
                  [4, 2, 5, 8, 1, 9, 9, 2, 9, 3, 3],
                  [6, 2, 1, 3, 1, 2, 3, 4, 5, 6, 7],
                  [1, 2, 3, 4, 5, 6, 7, 8, 9, 1, 1],
                  [2, 4, 6, 8, 2, 4, 6, 8, 2, 4, 6],
                  [5, 1, 1, 9, 3, 5, 7, 7, 2, 3, 4],
                  [0, 0, 2, 9, 4, 6, 5, 5, 1, 1, 2],
                  [8, 5, 4, 3, 2, 1, 8, 5, 4, 3, 2],
                  [1, 2, 3, 4, 5, 6, 7, 8, 9, 0, 1],
                  [0, 1, 9, 8, 7, 6, 5, 4, 3, 2, 1]])

#for pictorial representation of the image
plt.imshow(image, cmap="gray")
plt.title('Input Image')
plt.show()

image = image.reshape(1, 11, 11, 1)

# define model containing just a single average pooling layer
model = Sequential(
    [AveragePooling2D (pool_size = 2, strides = 2)])

# generate pooled output
output = model.predict(image)

# print output image matrix
output = np.squeeze(output)
print(output)

# print output image
plt.imshow(output, cmap="gray")
plt.title('Average pooling')
plt.show()
Output Matrix
You may observe the average values from 2x2 blocks retained. This is average pooling, average values are calculated and kept.
[[4.25 4.25 3.   4.5  2.25]
 [3.5  4.25 3.25 4.5  5.75]
 [2.25 5.25 4.25 7.25 4.  ]
 [1.5  5.25 4.5  6.   1.75]
 [4.   3.5  3.5  7.   4.  ]]
The transition
The matrix used in this coding example represents grayscale image of blocks as visible below.

Both of these efficiently pool the data. When to use what?
While selecting a layer you must be well versed with:
- Your data
- How does pooling work, and how is it beneficial for your data set.
Expectations
Average pooling retains a lot of data, whereas max pooling rejects a big chunk of data The aims behind this are:
- Max pooling extracts only the most salient features of the data.
- Average pooling smoothly extracts features
Hence,
- Average pooling sometimes cannot extract the important features because it takes everything into account, and gives an average value which may or may not be important.
Max pooling focuses only on the very important features.
But this also means,
- Average pooling encourages the network to identify the complete extent of the object, whereas max pooling restricts that to only the very important features, and might miss out in some details.
Hence, Choice of pooling method is dependent on the expectations from the pooling layer and the CNN
Type of image

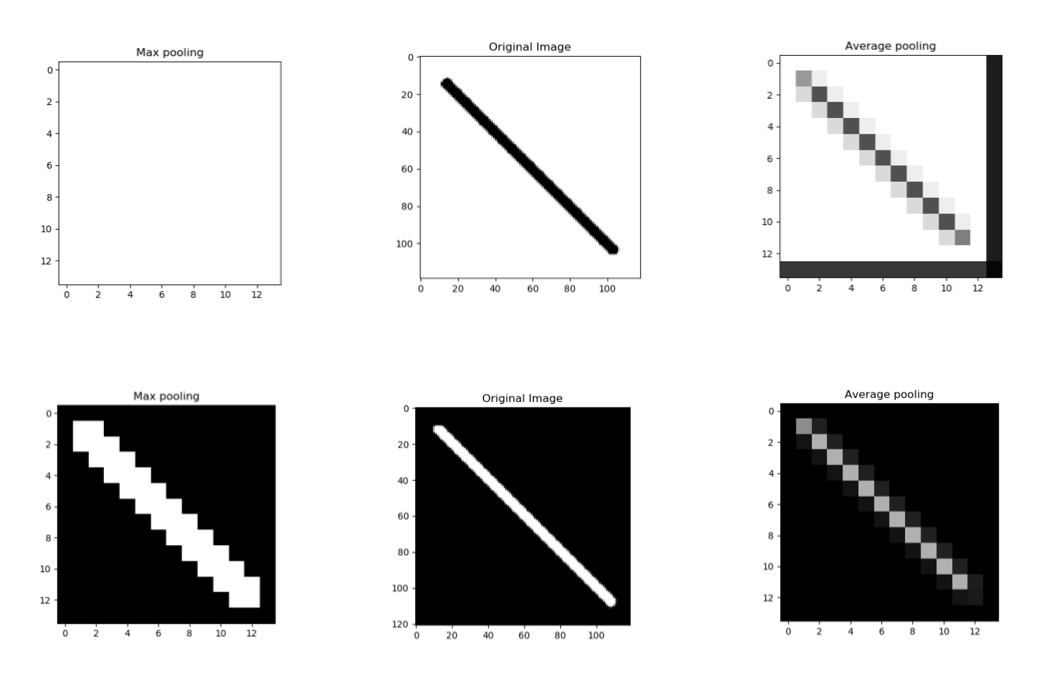
You may observe by above two cases, same kind of image, by exchanging foreground and background brings a drastic impact on the effectiveness of the output of the max pooling layer, whereas the average pooling maintains its smooth and average character.
Max pooling worked really well for generalising the line on the black background, but the line on the white background disappeared totally!
Average pooling can save you from such drastic effects, but if the images are having a similar dark background, maxpooling shall be more effective.
Max pooling works better for darker backgrounds and can thus highly save computation cost whereas average pooling shows a similar effect irrespective of the background
Therefore,
We may conclude that, layers must be chosen according to the data and requisite results, while keeping in mind the importance and prominence of features in the map, and understanding how both of these work and impact your CNN, you can choose what layer is to be put.
It doesn't end with choosing your filter.
Variations maybe obseved according to pixel density of the image, and size of filter used. Hence, this maybe carefully selected such that optimum results are obtained.

Above is variations in the filter used in the above coding example of average pooling. Similar variations maybe observed for max pooling as well. You may observe the varying nature of the filter.
Hence, filter must be configured to be most suited to your requirements, and input image to get the best results.
And there you have it!
No, CNN is complete without pooling layers,
No knowledge of pooling layers is complete without knowing Average Pooling and Maximum Pooling!
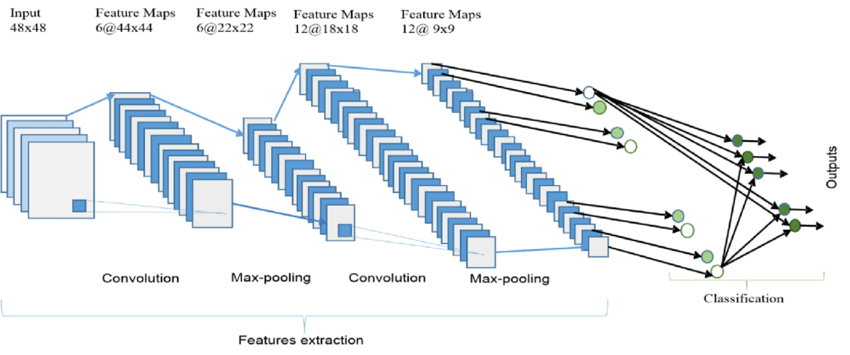
Below is an image of a general CNN.

Go ahead, and build your CNN now!
