
Get this book -> Problems on Array: For Interviews and Competitive Programming
In machine learning field,sometime,we have to work with large-scale data with not only many number of data points but also huge amount of feature dimension. This problem charged us much time, memory spaces and make difficult for our models to work with until PCA and LDA was born. In this article, we're going to discuss about how these 2 algorithms work and the differences between them.
Table of contents
- Introduction to dimensionality reduction
- PCA
- LDA
- Comparision table
- Implementation
1. Introduction to dimensionality reduction
Many machine learning problems involve thousands or even millions of features for each training instance. Not only do these high-dimension data make training extremely slow but they also make our models hard to find good solutions. Fortunately, scientists created PCA and LDA which helped us solve these troubles.This article explains their mechanism and some mathematical concepts.After that, I'll compare their effect and in which cases we should use them.
2. PCA
Principle Component Analysis ( or PCA for short ) is an Unsupervised Learning algorithms which is used for dimensionality reduction. Working directly with high-dimension data can cause training slow, so applying PCA as a preprocessing step makes training faster. By the way, we all know that both human brain and computer are only able to plot chart in 3D or 2D space and they apparently can not visualize greater-than-three-dimension data. PCA allows us to do it by decreasing data dimension to less than 4, so the second purpose for applying PCA is for visualization.
So, how does PCA work? Well, the core idea of PCA is: finding a set of unit vectors which define a new space.The number of axes of the new space are less than the original ones's.Therefore, when we project our original data onto it, we get a new dataset whose dimension was reduced.However, reducing the number of features means losing information of data which might cause bad performace for our ML models.The next question we have to answer is : how do we preserve as much information as we want?
2.1.Variance
First step, we need to understand : what is information of data? If you know probability , it actually is variance.Variance of each data point along one axis is its coordinate on that axis.
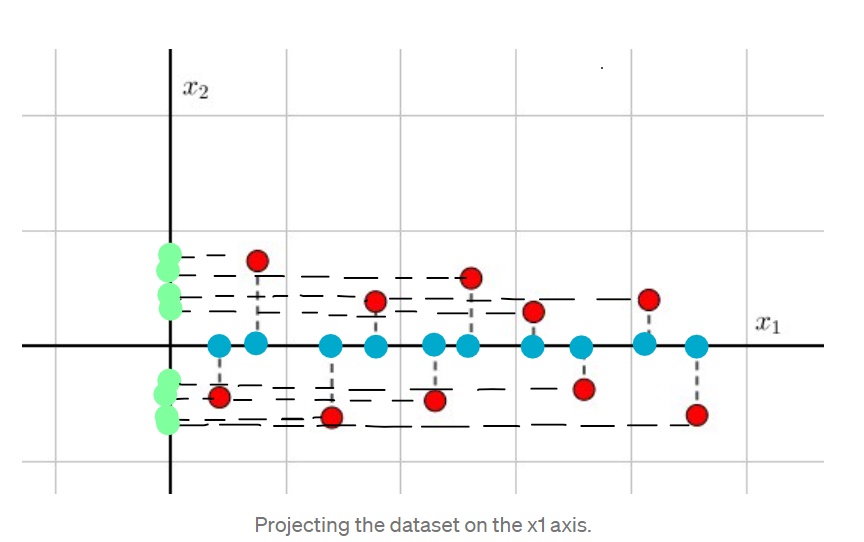
See the example above. We have original dataset( red points).If we project them onto x1 axis, we still preserve their x1 values and the number of points( blue points). But if we project them onto x2 axis,guess what? Now new data ( green points) has very low quality. Many points overlapped because they have the same x2 values, so projected data lost much information.This observation results in one conclusion: It's a good thing to have higher variance data since they will be more informative and important.
2.2.Covariance and correlation
Covariance is a metric which measures how much pairs of variable vary together.
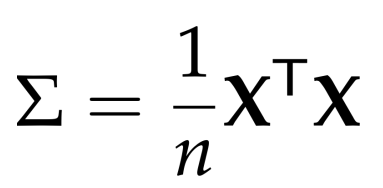
The express above is Covariance matrix after centering data.After getting covariance matrix of the dataset, this leads us to the constraint optimization problem :
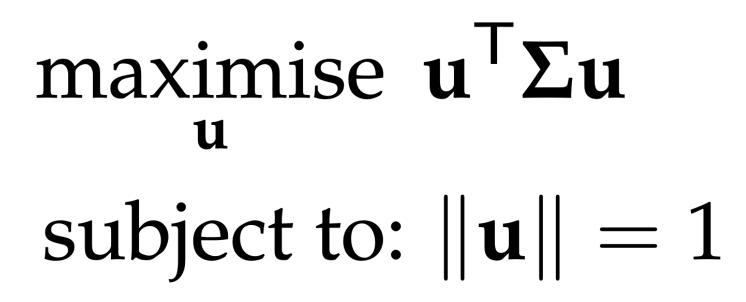
The first term is exactly our dataset's variance in new space,we need to maximize it as disscussed above. The u are orthonormal vectors which form our projective space.By using Lagrangian multiplier, they proved that solution of this problem are eigenvectors corresponding to k maximum eigenvalues of covariance matrix. What an interesting result! So all we need to do is to find maximum eigenvalues.
After that, you can keep k maximum components which are k maximum eigenvalues. Their eigenvectors form our new space and the rest is simple: projecting original data onto new axes gives us new data which has less dimension than the former's.
3. LDA
Linear Discriminant Analysis(or LDA for short) was proposed by Ronald Fisher which is a Supervised Learning algorithm. It means that you must use both features and labels of data to reduce dimension while PCA only uses features. Another key point : the purpose of LDA is to find a new space in which reduced-dimension dataset is good for classification task.
To meet this goal, LDA uses 2 metrics: Within-class variance and Between-class variance.
The core idea is quite straightforward: finding vectors w which maximize the distance between mean vectors of 2 classes and minimize the variance within each class.
A little bit explaination: within-class variance stands for scatter. The smaller this quantity, the lower data points scatter and vice versa. We want to classify classes, ofcourse we have to maximize the distance between each class, that's why maximizing distance between mean vectors. However, we also need to take into account the scatter of data.The greater the within-class variance, the more data points of 2 classes overlap and it culminates in bad result for classification.Now you know why we need to minimize the scatter.
Based on those arguments, optimization problem of LDA becomes maximizing this term:
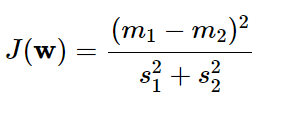
The denominator is total variance within each class and the numerator is the between-class variance.Solving this problem is quite complicating,I'll leave it in the article above. But one noticeble thing is that the number of dimensions of the new space are less than or equal to C-1 ( C is the number of classes). It seems that we get a good result with the number of axes are decreased significantly.
4. Comparison table
To compare differences between PCA and LDA, I'll create a summary table :
| Property | PCA | LDA |
|---|---|---|
| Type | Unsupervised | Supervised |
| Goal | -Training faster | - Good for classification |
| -Visualization | ||
| Dimension of | -Less than or equal to the | -Less than or equal to the result |
| the new data | original one's | when subtracting 1 from the number |
| classes | ||
| Method | Maximize the variance | Maximize between-class variance and |
| minimize within-class variance |
Some similarities between PCA and LDA :
- They both try to reduce dimension of data by projecting onto new space which has less dimension than the former's.
- They both rank new axes in order of importance.This importance is measured by eigenvalues.
- From both, we can know that which features are important and contributing more in creating new axes.
5.Implementation.
This is the code using PCA and LDA for Irish Flower dataset. Note that we use sklearn library instead of building each algorithm from scratch.
import matplotlib.pyplot as plt
from sklearn import datasets
from sklearn.decomposition import PCA
from sklearn.discriminant_analysis import LinearDiscriminantAnalysis
iris = datasets.load_iris()
X = iris.data
y = iris.target
target_names = iris.target_names
pca = PCA(n_components=2)
X_r = pca.fit(X).transform(X)
lda = LinearDiscriminantAnalysis(n_components=2)
X_r2 = lda.fit(X, y).transform(X)
# Percentage of variance explained for each components
print(
"explained variance ratio of PCA (first two components): %s"
% str(pca.explained_variance_ratio_)
)
print("explained variance ratio of LDA : %s"
%str(lda.explained_variance_ratio_))
plt.figure()
colors = ["navy", "turquoise", "darkorange"]
lw = 2
for color, i, target_name in zip(colors, [0, 1, 2], target_names):
plt.scatter(
X_r[y == i, 0], X_r[y == i, 1], color=color, alpha=0.8, lw=lw, label=target_name
)
plt.legend(loc="best", shadow=False, scatterpoints=1)
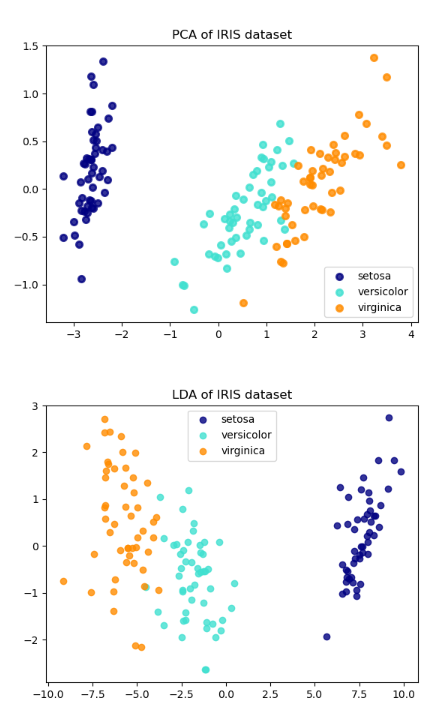
plt.title("PCA of IRIS dataset")
plt.figure()
for color, i, target_name in zip(colors, [0, 1, 2], target_names):
plt.scatter(
X_r2[y == i, 0], X_r2[y == i, 1], alpha=0.8, color=color, label=target_name
)
plt.legend(loc="best", shadow=False, scatterpoints=1)
plt.title("LDA of IRIS dataset")
plt.show()
And after running this cell, we get the result:
explained variance ratio of PCA (first two components): [0.92461872 0.05306648]
explained variance ratio of LDA :[0.9912126 0.0087874]
You can see 2 pictures below. They are visualization of our dataset after projecting to new space.
This article at OpenGenus described the differences and sililarities between PCA and LDA. Hope that it can help you understand more about these algorithms.Thanks for reading and please share if you find it useful!