

Introduction
In this article at OpenGenus, we have explained a Data Mining approach (with source code) to predict employee attrition.
Employee attrition is the process of employees leaving an organization for various reasons. It can be voluntary or involuntary and is often seen as a sign of low morale, a lack of job satisfaction, or difficulty in finding qualified replacements. Predicting employee attrition can help organizations anticipate staffing needs, reduce costs associated with recruitment and training, and take corrective measures to improve employee engagement and retention. Predictive models allow employers to identify potential candidates for departure using data from existing sources such as HR records, performance reviews, surveys etc., which helps them make better decisions regarding hiring practices and talent management strategies. By leveraging predictive analytics techniques such as descriptive analytics, machine learning algorithms and survival analysis organizations are able to gain insight into factors that could lead to high levels of employee turnover in their workforce.
With the development of big data and machine learning in recent years, many businesses have used predictive analytics to help identify staff members who may be leaving. Organizations can create models that accurately predict which employees are most likely to leave and take proactive measures to retain them by analyzing data on factors like employee performance, satisfaction, and engagement.
Machine learning algorithms are trained on historical data in this process to discover patterns and correlations that can be used to forecast employee attrition rates in the future. Organizations can use machine learning to enhance their capacity to recognize and address potential retention issues, which will lower turnover rates and boost employee happiness and productivity.
Need of Employee Attrition prediction
1.Cost savings: Because it necessitates the hiring and training of new employees, turnover can be a significant expense for businesses. Organizations can take proactive measures to retain valuable talent and lower recruitment costs by forecasting employee attrition.
2.Increased productivity: When employees leave a company, knowledge and expertise can be lost, which can lower productivity. Organizations can identify potential retention issues and take proactive measures to keep key employees, maintaining productivity levels, by predicting employee attrition.
3.Talent management: By determining which employees are most likely to leave an organization, predicting employee attrition can help organizations manage their talent pool more effectively. As a result, businesses may be able to create targeted retention strategies, such as providing more opportunities for training and growth or modifying compensation packages.
4.Organizational stability: High employee turnover rates can cause instability within an organization because they may make workers fearful for their futures and reduce productivity. Organizations can reduce turnover rates and maintain a stable workforce by foreseeing employee attrition.
How to prepare dataset
The dataset used to predict employee attrition may vary depending on the specific needs and characteristics of the organization. However, some common data sources that are often used to develop predictive models for employee attrition include:
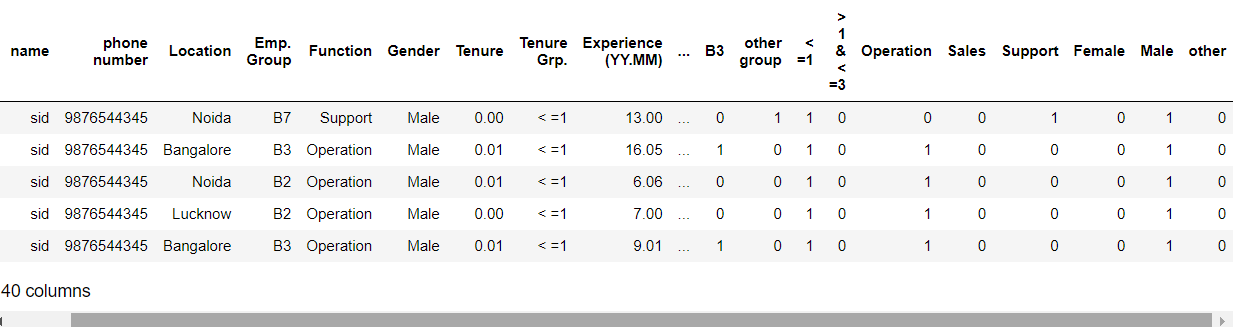
The dataset you have provided includes several key variables that are commonly used to predict employee attrition:
Employee name: This variable is not typically used to predict employee attrition, but may be useful for identifying individual employees and tracking their progress over time.
Phone number and location: These variables are not typically used to predict employee attrition, but may be useful for identifying the physical location of the employee and contacting them if necessary.
Tenure: This variable measures the length of time the employee has been with the organization. Employees who have been with the organization for a longer period of time may be less likely to leave, while those with shorter tenures may be more likely to leave.
Experience: This variable measures the amount of relevant work experience the employee has. Employees with more experience may be less likely to leave, while those with less experience may be more likely to leave.
Marital status and gender: These variables may be used to identify any demographic patterns associated with employee attrition. For example, if female employees are found to be leaving the organization at a higher rate than male employees, this may suggest the need for targeted retention strategies.
Hiring source: This variable measures the source from which the employee was recruited. Employees who were recruited through a referral program or who were previously employed by the organization may be less likely to leave, while those who were recruited through job boards or other external sources may be more likely to leave.
Promoted/not promoted: This variable measures whether the employee has been promoted or not. Employees who have been promoted may be less likely to leave, as they may feel more invested in the organization and its goals.
Job role: This variable measures the specific role the employee occupies within the organization. Certain job roles may be associated with higher turnover rates, while others may be associated with lower turnover rates.
Overall, the dataset you have provided includes several key variables that can be used to develop a predictive model for employee attrition. By analyzing these variables and identifying patterns and correlations, organizations can develop effective retention strategies to retain valuable employees and reduce turnover rates.
Methods of Predicting Employee Attrition
1.Utilizing statistical analysis: It is possible to spot trends and correlations in employee data that might be related to turnover. For instance, businesses can use regression analysis to determine the factors that are most strongly linked to attrition or employee survey data to spot trends in satisfaction levels.
2.Machine learning: Patterns and correlations that can be used to forecast future attrition rates can be found using machine learning algorithms that have been trained on historical data. These models can identify employees who are at risk of leaving by taking into account a wide range of variables, including employee demographics, job characteristics, and performance metrics.
3.Social network analysis: Social network analysis can be used to find employees who are well-connected within the company and may have more influence over other employees' attitudes and behaviours. Organizations can lower the risk of turnover by identifying these people and taking action to ensure that they are satisfied and engaged.
4.Developing mathematical models :They can be used to predict future employee attrition rates is known as predictive modeling. To provide a more precise forecast of future turnover rates, these models can take into account a wide range of variables, including economic conditions, industry trends, and organizational changes.
5.Using text analytics :It is possible to find patterns and trends that might be connected to attrition by examining unstructured data, such as employee emails and chat logs. For instance, businesses may use sentiment analysis to find staff members who are complaining about their jobs or the company.
Ultimately, the most effective approach will depend on the specific needs and characteristics of the organization. A combination of these methods may be required to develop a comprehensive and accurate model for predicting employee attrition.
Steps involved in predicting employee attrition
1.Importing libraries
2.Data cleaning
3.Splitting data (train test split)
4.Model development applying 6-ML algorithms: Logistic Regression, Decision tree, KNN, SVM, Random Forest, Naive Bayes
5.Saving model
Let's see the code :
import pandas as pd
import numpy as np
import matplotlib.pyplot as plt
from sklearn.model_selection import train_test_split
from sklearn.metrics import confusion_matrix
from sklearn import datasets
from sklearn.metrics import accuracy_score
attrdata = pd.read_csv("Table_1.csv")
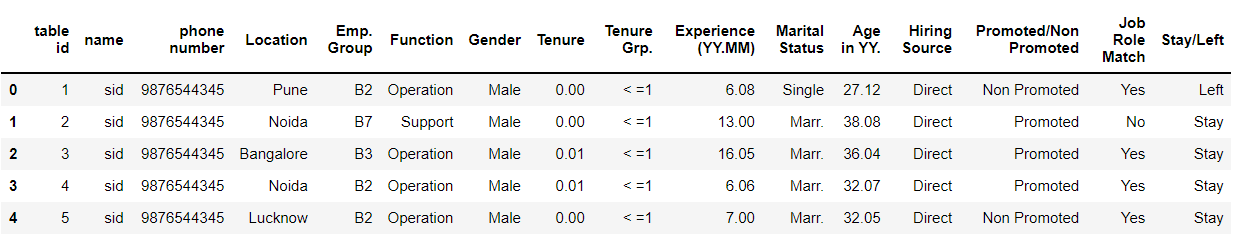
Build a new dictionary (location) to be used to categorize data columns after values are encoded. Here, in location_dict_new we are using integer values instead of the actual region name so that our machine learning model could interpret it.
location_dict = attrdata["Location"].value_counts()
print(location_dict)

location_dict_new = {
    'Chennai':       7,
    'Noida':         6,
    'Bangalore':     5,
    'Hyderabad':     4,
    'Pune':          3,
    'Madurai':       2,
    'Lucknow':       1,
    'other place':   0,
}

print(location_dict_new)
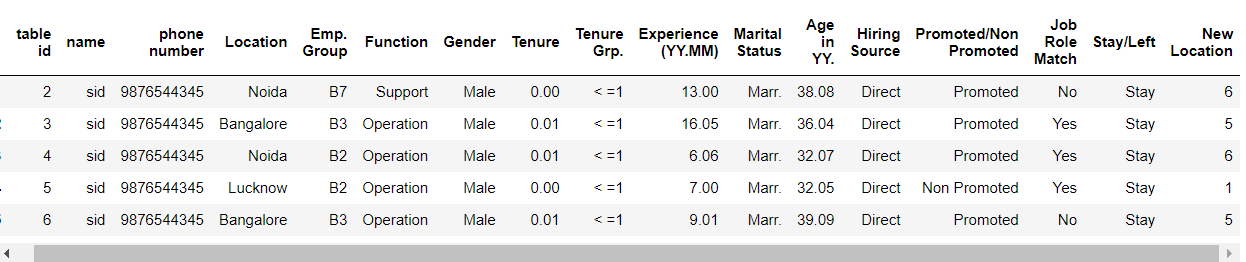
Now we will make a function for the location column to make a new column where encoded location values will be there because our machine learning algorithm will only understand int/float values.
def location(x):
    if str(x) in location_dict_new.keys():
        return location_dict_new[str(x)]
    else:
        return location_dict_new['other place']

data_l = attrdata["Location"].apply(location)
attrdata['New Location'] = data_l
attrdata.head()
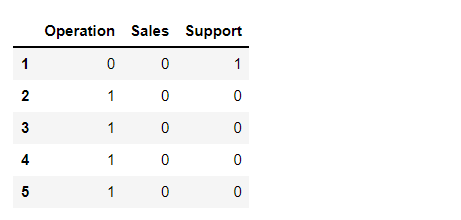
Pandas get_dummies() function is used for manipulating data, this function is used to convert the categorical values to dummy variables:
gen = pd.get_dummies(attrdata["Function"])
gen.head()
Here, in Mar() function we are using Maritial dictionary keys to convert those categorical values into acceptable type values for our ML models.
def Mar(x):
    if str(x) in Marital_dict.keys() and Marital_dict[str(x)] > 100:
        return str(x)
    else:
        return 'other status'

data_l = attrdata["Marital Status"].apply(Mar)
attrdata['New Marital'] = data_l
attrdata.head()
Mr = pd.get_dummies(attrdata["New Marital"])
Mr.head()
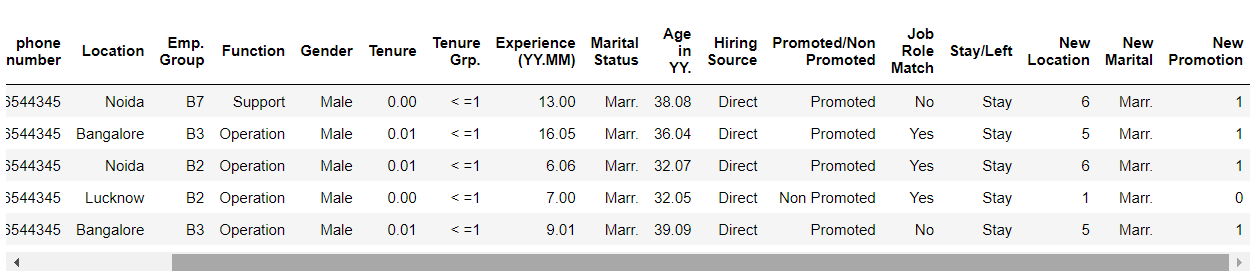
Here, with the help of Promoted function, we are converting Promoted and Non promoted values into 1 and 0 respectively for encoding purposes.
def Promoted(x):
    if x == 'Promoted':
        return int(1)
    else:
        return int(0)

data_l = attrdata["Promoted/Non Promoted"].apply(Promoted)
attrdata['New Promotion'] = data_l
attrdata.head()
Here, we are using the Job() function where categorical values are Yes and No which needs to be converted into integer values i.e. 1/0 then we are assigning the New Job Role Match. we are using the Gen() function using gender_dict (dictionary) which will be encoded first using the dictionary keys, and then the changes will be applied to the dataset based on changes that are done.
def Job(x):
    if x == 'Yes':
        return int(1)
    else:
        return int(0)

data_l = attrdata["Job Role Match"].apply(Job)
attrdata['New Job Role Match'] = data_l
attrdata.head()

def Gen(x):
    if x in gender_dict.keys():
        return str(x)
    else:
        return 'other'

data_l = attrdata["Gender "].apply(Gen)
attrdata['New Gender'] = data_l
attrdata.head()
gend = pd.get_dummies(attrdata["New Gender"])
gend.head()
Now, let’s concatenate the columns which are being cleaned, sorted, and manipulated by us as processed data.
dataset = pd.concat([attrdata, hr, Mr, emp, tengrp, gen, gend], axis = 1)
dataset.head()
Let’s drop the columns which are not important anymore:
dataset.drop(["table id", "name", "Marital Status","Promoted/Non Promoted","Function","Emp. Group","Job Role Match","Location"
              ,"Hiring Source","Gender ", 'Tenure', 'New Gender', 'New Marital', 'New EMP'],axis=1,inplace=True)

dataset1 = dataset.drop(['Tenure Grp.', 'phone number'], axis = 1)
dataset1.columns
Let's see target column:
# Target
"""
def Target(x):
    if x in "Stay":
        return False
    else:
        return True

data_l = dataset1["Stay/Left"].apply(Target)
dataset1['Stay/Left'] = data_l
"""
dataset1['Stay/Left'].head()
Saving the cleaned dataset into another CSV file
dataset1.to_csv("processed table.csv")
Now, from the processed data we have to separate the features and target column again.
dataset = pd.read_csv("processed table.csv")
dataset = pd.DataFrame(dataset)
y = dataset["Stay/Left"]
X = dataset.drop("Stay/Left",axis=1)
Splitting data – Train test split
X_train,X_test,y_train,y_test = train_test_split(X,y,test_size=0.2,random_state=4)
X_train.head()
Model Development:
from sklearn.linear_model import LogisticRegression
from sklearn.tree import DecisionTreeClassifier
from sklearn.ensemble import RandomForestClassifier
from sklearn.naive_bayes import GaussianNB
from sklearn.neighbors import KNeighborsClassifier
from sklearn import svm
Initializing the models:
1.Logistic Regression : C: Inverse of regularization strength (float), random state: (int), solver: sag,saga,liblinear (Here, we are using liblinear).
2.Decision trees: Default parameters
3.Random forest: Default parameters
4.Gaussian Naive Bayes: Default parameters
5.K-nearest neighbors: n_neighbors=3 – we can have another number of neighbors too.
lr=LogisticRegression(C = 0.1, random_state = 42, solver = 'liblinear')
dt=DecisionTreeClassifier()
rm=RandomForestClassifier()
gnb=GaussianNB()
knn = KNeighborsClassifier(n_neighbors=3)
svm = svm.SVC(kernel='linear')

for a,b in zip([lr,dt,knn,svm,rm,gnb],["Logistic Regression","Decision Tree","KNN","SVM","Random Forest","Naive Bayes"]):
    a.fit(X_train,y_train)
    prediction=a.predict(X_train)
    y_pred=a.predict(X_test)
    score1=accuracy_score(y_train,prediction)
    score=accuracy_score(y_test,y_pred)
    msg1="[%s] training data accuracy is : %f" % (b,score1)
    msg2="[%s] test data accuracy is : %f" % (b,score)
    print(msg1)
    print(msg2)
Model Scores (accuracy):
model_scores={'Logistic Regression':lr.score(X_test,y_test),
             'KNN classifier':knn.score(X_test,y_test),
             'Support Vector Machine':svm.score(X_test,y_test),
             'Random forest':rm.score(X_test,y_test),
              'Decision tree':dt.score(X_test,y_test),
              'Naive Bayes':gnb.score(X_test,y_test)
             }
model_scores
Here, we can see that Logistic regression and Random forest have the best accuracy.
Visualize the accuracy of model:
model_compare.T.plot(kind='bar') # (T is here for transpose)
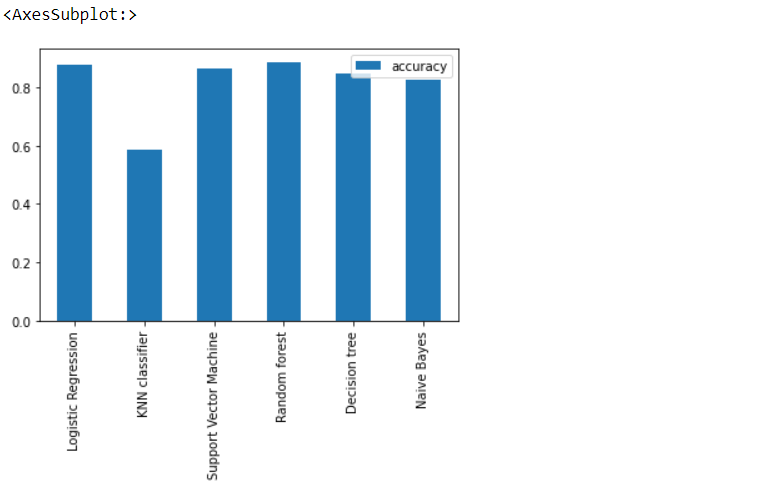
Yes, we can see that Random Forest has 1% better accuracy than Logistic regression but Random Forest is an overfitted model hence we will select Logistic regression.
Feature importance
These “coef’s” tell how much and in what way did each one of them contribute to predicting the target variable
Logistic regression
feature_dict=dict(zip(dataset.columns,list(lr.coef_[0])))
feature_dict
This is a type of Model-driven Exploratory data analysis.
Saving the best model
Logistic Regression model because it has the best accuracy as well it is neither overfitted nor under fitted
import pickle
1.Save the trained model as a pickle string.
saved_model = pickle.dumps(lr)
2.Load the pickled model
lr_from_pickle = pickle.loads(saved_model)
3.Use the loaded pickled model to make predictions
lr_from_pickle.predict(X_test)
Why logistic regression is suitable ?
For a number of reasons, logistic regression is an effective algorithm for forecasting employee attrition.
In the context of employee attrition, linear regression can be used to predict the probability of an employee leaving the organization based on their tenure, experience, job role, marital status, and other relevant factors. The dependent variable in this case would be a binary variable indicating whether the employee has left the organization or not.
Linear regression can be applied to employee attrition data in the following ways:
1.Simple linear regression: In simple linear regression, a single independent variable is used to predict the dependent variable. For example, we could use an employee's tenure as the independent variable to predict whether they will leave the organization.
2.Multiple linear regression: In multiple linear regression, two or more independent variables are used to predict the dependent variable. For example, we could use an employee's tenure, experience, and job role as independent variables to predict whether they will leave the organization.
Linear regression can be a useful tool for analyzing the relationship between various factors and employee attrition. However, it is important to note that linear regression assumes a linear relationship between the independent variables and the dependent variable. If the relationship is non-linear, other machine learning algorithms such as logistic regression or decision trees may be more appropriate.
Overall, logistic regression is a reliable, flexible, easy-to-implement, and interpretable algorithm for predicting employee attrition.
Why logistic regression is not suitable ?
Linear regression may not be suitable for predicting employee attrition in some cases. There are a few reasons why:
1.Non-linear relationships: Linear regression assumes that there is a linear relationship between the independent variables and the dependent variable. However, in the case of employee attrition, there may be non-linear relationships between the variables. For example, the relationship between job satisfaction and employee attrition may not be linear, and a non-linear model such as a decision tree or a neural network may be more appropriate.
2.Categorical variables: Linear regression assumes that the independent variables are continuous. However, in the case of employee attrition, there may be categorical variables such as gender or job role that are important predictors of attrition. In such cases, a regression model that can handle categorical variables, such as logistic regression, may be more appropriate.
3.Outliers: Linear regression is sensitive to outliers, which are data points that are significantly different from the rest of the data. In the case of employee attrition, there may be outliers in the data that can significantly affect the regression line. In such cases, robust regression methods or other machine learning algorithms that are less sensitive to outliers, such as decision trees or random forests, may be more appropriate.
Why random forest is suitable ?
Random forest is an ensemble learning method that combines multiple decision trees to improve prediction accuracy and reduce overfitting. It works by randomly selecting a subset of the features and the training data for each tree, and then averaging the predictions of all the trees to produce the final prediction.
Random forest can be applied to employee attrition data by using it as a classification algorithm to predict whether an employee is likely to leave the organization or not. The algorithm works by constructing multiple decision trees on randomly selected subsets of the training data and features, and then combining the results of these trees to make the final prediction.
Each decision tree in the random forest model learns to split the data based on a different set of features, which helps to reduce the variance and overfitting of the model. By combining the predictions of multiple trees, the model can achieve higher accuracy and reduce the risk of overfitting.
The features that can be used to predict employee attrition include tenure, experience, job role, gender, marital status, performance ratings, and others. The model can be trained on historical data to learn the patterns and relationships between these features and the likelihood of employee attrition. Once trained, the model can be used to predict the probability of an employee leaving the organization based on their individual characteristics.
Random forest is a powerful algorithm that can achieve high accuracy in predicting employee attrition by combining the predictions of multiple decision trees, handling non-linear relationships, handling missing data, and handling categorical data.
Why random forest is not suitable ?
Random forest may not be suitable for predicting employee attrition in some cases for the following reasons:
1.Limited interpretability: While random forest is an effective machine learning algorithm, it can be difficult to interpret and understand the reasons for its predictions. This can be a problem if you need to explain the results to stakeholders or if you need to understand the underlying reasons for employee attrition.
2.Overfitting: Random forest can be prone to overfitting if the number of trees in the forest is too high or if the trees are too deep. This can result in a model that performs well on the training data but poorly on new data.
3.High computational cost: Random forest can be computationally expensive to train, especially when there are a large number of features in the data.
4.Bias: If the data used to train the random forest model is biased, the model will inherit that bias and make biased predictions.
How decision tree is suitable ?
Decision trees can be applied to employee attrition data as a classification algorithm to predict whether an employee is likely to leave the organization or not. The algorithm works by recursively splitting the data into smaller subsets based on the values of the features until a stopping criterion is met.
The decision tree model learns the patterns and relationships between the features and the target variable by recursively splitting the data based on the most informative feature at each node. The most informative feature is chosen based on a criterion such as information gain or Gini impurity.
In the case of employee attrition, the features that can be used to predict attrition include tenure, experience, job role, gender, marital status, performance ratings, and others. The decision tree model can learn which features are most informative for predicting attrition and use this information to make predictions on new data.
Decision tree models can have low accuracy in predicting employee attrition due to overfitting, limited predictive power, handling of missing data, bias, and sensitivity to small changes in data. To improve the accuracy of decision tree models, techniques such as pruning, ensemble methods, and regularization can be used to reduce overfitting and improve generalization to new data.
How KNN is suitable ?
K-Nearest Neighbors (KNN) is a machine learning algorithm that can be suitable for predicting employee attrition in certain situations. KNN works by identifying the K closest data points in the training set to a given test point and using the average or majority vote of the outcome variable for those K data points as the predicted outcome for the test point.
KNN can be suitable for predicting employee attrition in the following situations:
When there are clear clusters of employees who are likely to stay or leave: If there are clear groups of employees who are likely to stay or leave based on their job roles, tenure, experience, marital status, and other factors, KNN may be able to accurately predict the outcome for new employees based on their similarity to existing employees in the dataset.
When there are a relatively small number of predictor variables: KNN can be computationally expensive with large datasets or high-dimensional data, so it may be more suitable for datasets with a relatively small number of predictor variables. In the case of employee attrition, there are typically only a few factors that are relevant for predicting whether an employee is likely to stay or leave, so KNN may be an appropriate algorithm.
KNN can have both high and low accuracy in predicting employee attrition depending on the specific dataset and parameters used.
How Naive-Bayes is suitable ?
Naive Bayes is a machine learning algorithm that can be suitable for predicting employee attrition in certain situations. Naive Bayes works by calculating the probability of each possible outcome given the values of the predictor variables, and then selecting the outcome with the highest probability.
Naive Bayes can be suitable for predicting employee attrition in the following situations:
1.When there are a relatively small number of predictor variables: Naive Bayes is a relatively simple algorithm that works well when there are a small number of predictor variables. In the case of employee attrition, there are typically only a few factors that are relevant for predicting whether an employee is likely to stay or leave, such as job role, tenure, experience, and marital status.
2.When there is a clear relationship between predictor variables and the outcome variable: Naive Bayes assumes that the predictor variables are conditionally independent given the outcome variable, meaning that the value of each predictor variable is not influenced by the value of any other predictor variable. This assumption may not hold in all cases, but if there is a clear relationship between the predictor variables and the outcome variable, Naive Bayes can be a suitable algorithm.
3.When there are categorical predictor variables: Naive Bayes works well with categorical predictor variables, as it can calculate the probability of each possible outcome given the values of the predictor variables.
In some cases, Naive Bayes can give high accuracy for predicting employee attrition, particularly when there are categorical predictor variables and a clear relationship between predictor variables and the outcome variable. However, in other cases, Naive Bayes may not perform as well as other machine learning algorithms, such as logistic regression or random forests.
Conclusion
Organizations can predict employee attrition rates with the help of predictive models, which are a powerful tool. It is possible to produce precise predictions about which employees may leave their organization in the near future based on trends in job satisfaction, salary levels, or any other relevant metrics they deem important for retention purposes by utilizing advanced analytics techniques, such as machine learning algorithms and survival analysis. Employer must gather and clean data from various sources, define analysis parameters, and choose characteristics that are most likely to be related to employee turnover in order to ensure an effective model.