
Get this book -> Problems on Array: For Interviews and Competitive Programming
In Machine Learning Data Preprocessing is one of the most important steps to gain key insights from Data. According to Senior Data Scientists, Data Science is 90% data cleaning and rest creating and training Machine Learning Models. Some of the buzz words mentioned above are statistical terms used for cleaning Numerical Data so that different ML models can predict efficiently. After cleaning come the part where we have to optimize the model to get accurate results this and avoid overfitting which is another topic all-together !
Key Differences
- Standardization and Normalization are data preprocessing techniques whereas Regularization is used to improve model performance
-
- In Standardization we subtract by the variable mean and divide by the standard deviation
- In Normalization we subtract by the minimum value divided by the variable range
- In Regularization we tune the function by adding additional penalty term in the error function
- After performing Standardization and Normalization most of the data will lie between a given range,whereas Regularization doesn't affect the data at all
- In Standardization distribution changes to Normal whereas in Normalization and Regularization distribution remains the same
- Standardization must be used when data is normally distributed, Normalization when data is not normal and Regularization when data is very noisy
Let's discuss each of them in detail
Why clean Numerical Data?
You may have heard of Data Cleaning for categorical data to easily interpret the results, but what about Numerical Data. Aren't we just supposed to feed Numerical data and get results from the model. This is not the case always.A simple reason is this : A given Dataset contains data from various distributions and ranges, which which may or may not be equal. While applying some ML Algorithms,we have certain assumptions about the distributions which when not met can give inaccurate results. Coming to the Range, huge differences in data values of different variable can falsely influence a variable due to its large values even leading to not getting a feasible solution, therefore we clean the numerical data through Standardization, Regularization and Normalization. Let's discuss them in detail !
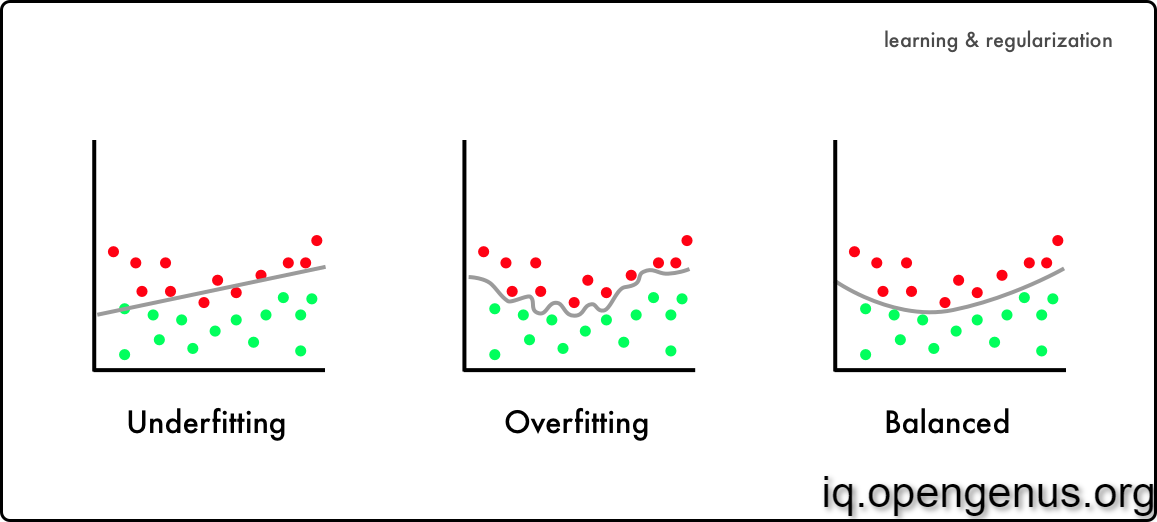
What is Overfitting?
In ML we have preprocess the data, and we train the model. We have a training data and a testing data. In cases when we don't have the testing data, we split the training data for the test data. The more we train the better results we get, right ? Machine Learning isn't that simple. Here comes the concept of Overfitting and Underfitting. In ML we try to find a function which resembles the relation between independent variables and dependent variables. In terms of Machine Learning we call our Predicted function a model.
Your model is underfitting the training data when the model performs poorly on the training data. This is because the model is unable to capture the relationship between the input examples (often called X) and the target values (often called Y). Your model is overfitting your training data when you see that the model performs well on the training data but does not perform well on the evaluation data. This is because the model is memorizing the data it has seen and is unable to generalize to unseen examples.
Standardization
In statistics, standardization is the process of putting different variables on the same scale. This process allows you to compare scores between different types of variables. Typically, to standardize variables, you calculate the mean and standard deviation for a variable. Then, for each observed value of the variable, you subtract the mean and divide by the standard deviation.
This process produces standard scores that represent the number of standard deviations above or below the mean that a specific observation falls. For instance, a standardized value of 2 indicates that the observation falls 2 standard deviations above the mean. This interpretation is true regardless of the type of variable that you standardize.
We use the following formula to Standardize a Variable value

where,
Z = Standardized Value
x = Variable Value
μ = Variable Mean
σ = Variable Standard Deviation
The standardized value is also known as Z-Score
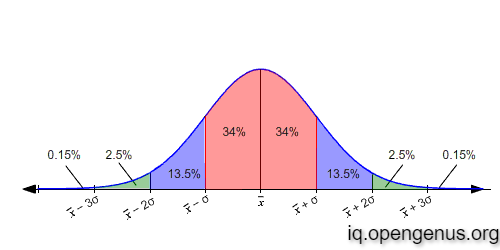
Standardization works best when the variable follows a Normal Distribtion
This is due to the fact that in a Normal Distribution 68% of data lies within 1 standard deviation from the mean, 95% within 2 standard deviation and 99.7% within 3 standard devations from the mean. So it is highly unlikely that a variable value is greater than +-3
When to Standardize a Variable?
Standardization assumes that your data has a Gaussian (bell curve) distribution. This does not strictly have to be true, but the technique is more effective if your attribute distribution is Gaussian. Standardization is useful when your data has varying scales and the algorithm you are using does make assumptions about your data having a Gaussian distribution, such as linear regression, logistic regression, and linear discriminant analysis.
Example in code
import numpy as np
import matplotlib.pyplot as plt
import seaborn as sns
mean = 128
std = 11
data = np.random.normal(mean,std,1000)
from sklearn.preprocessing import StandardScaler
scaled_data = StandardScaler().fit_transform(data)
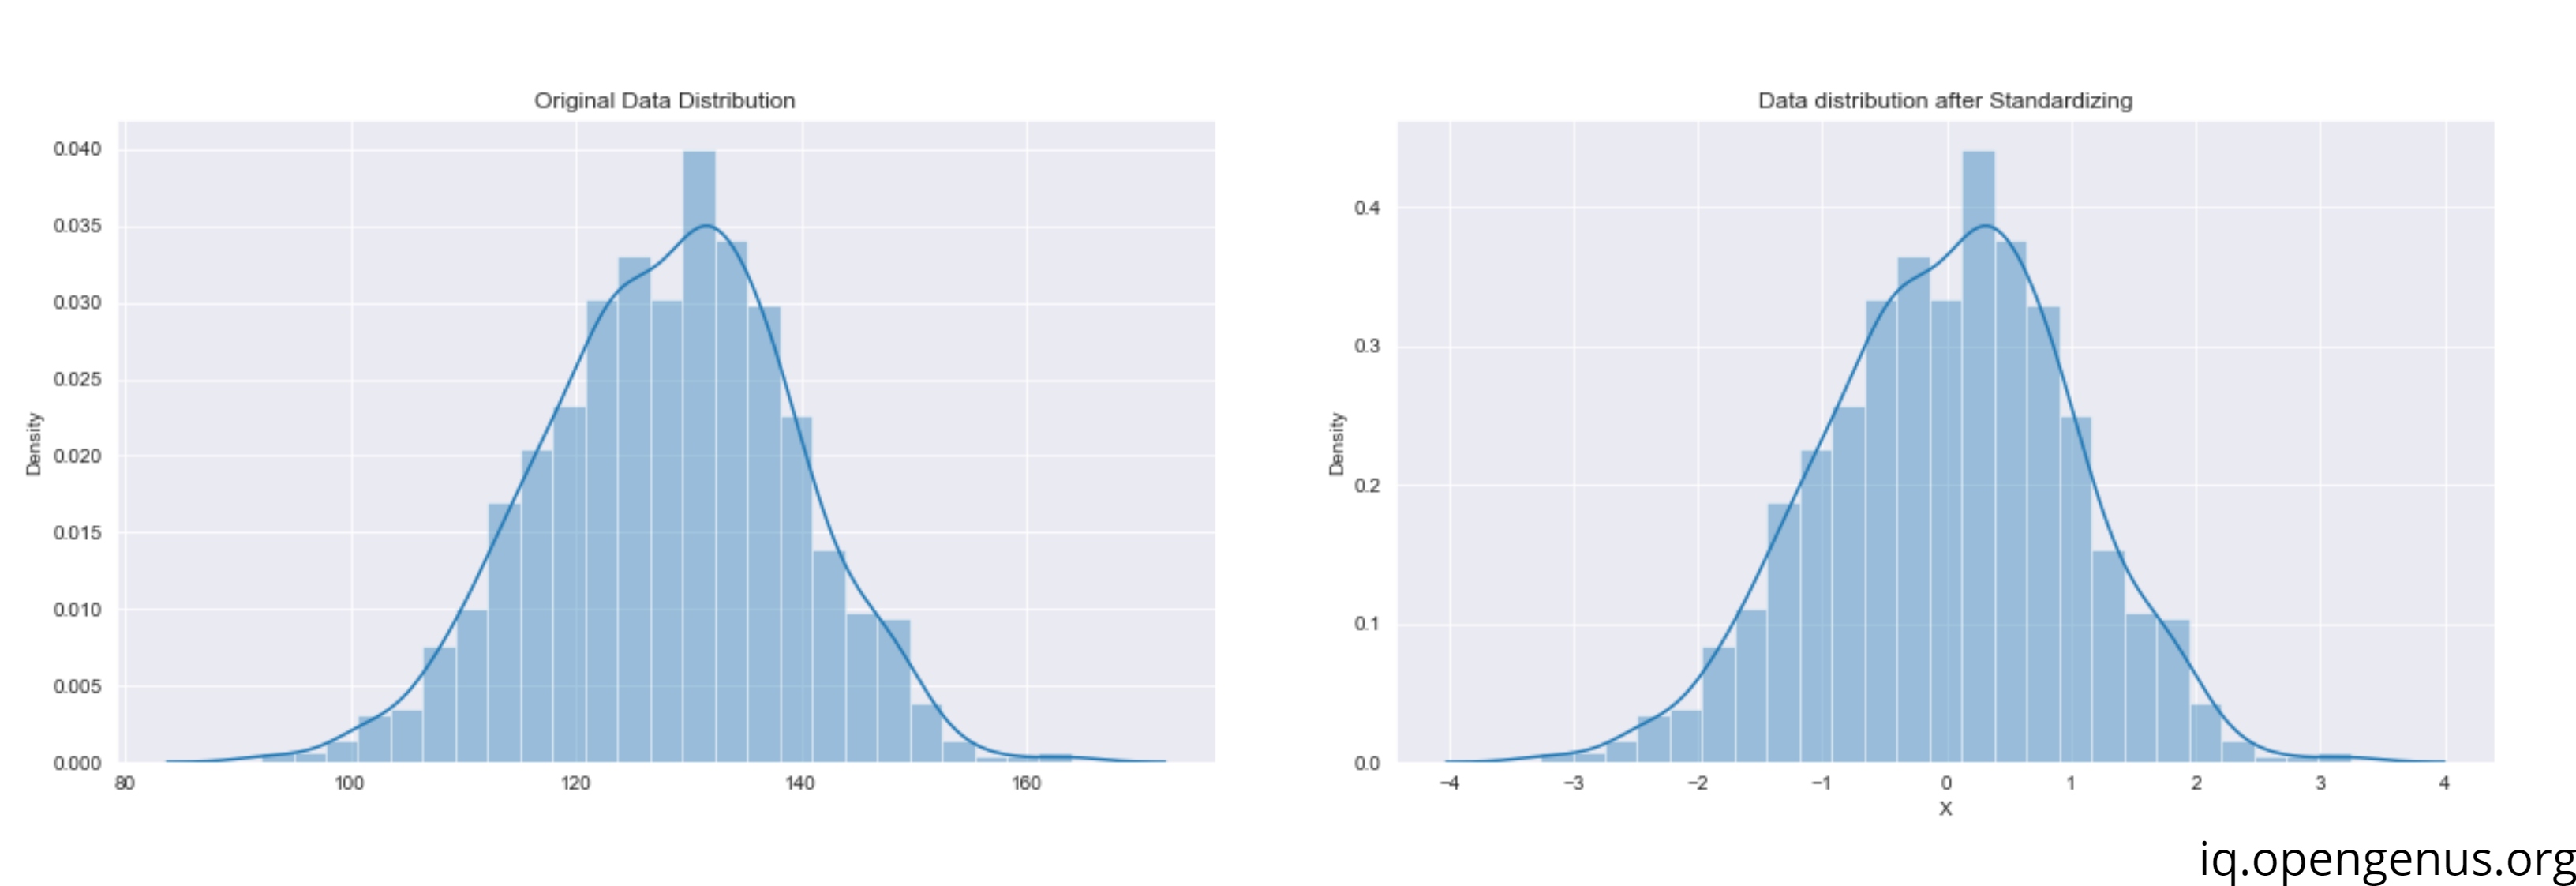
We can see that the distribution remains the same !
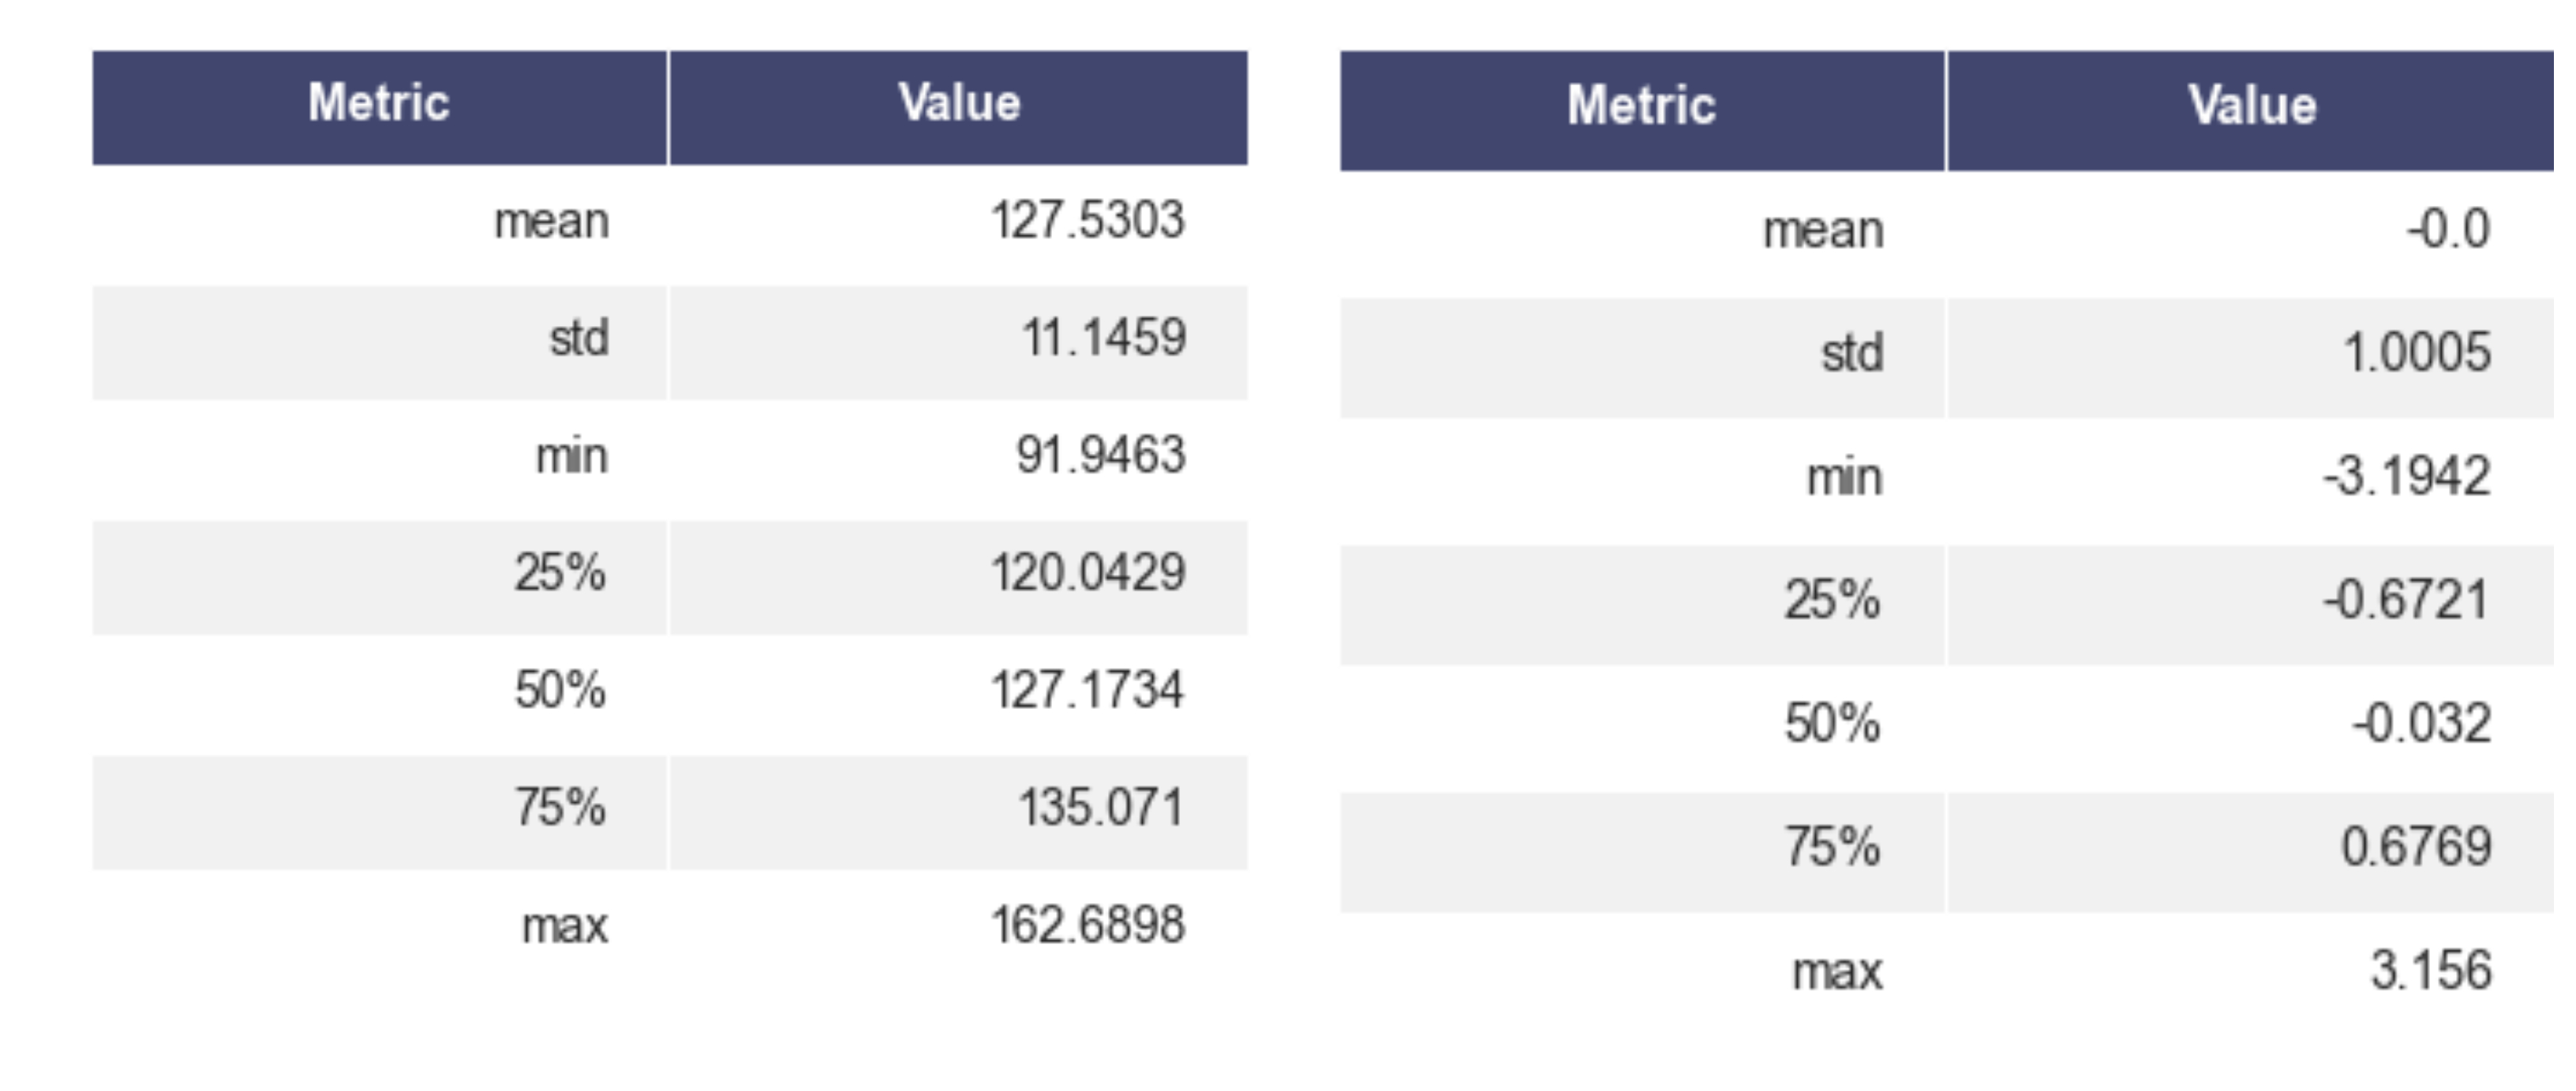
Approximately our mean and standard deviations are the same as specified. Also after Standardization, our mean and standard deviations are approximately 1 and 0 respectively
Normalization
The terms normalization and standardization are sometimes used interchangeably, but they usually refer to different things. Normalization usually means to scale a variable to have a values between a desired range (like [-1,1] or [0,1]) while standardization transforms data to have a mean of zero and a standard deviation of 1. Advantage of Normalization over Standardization is that we are not bound to any specific distribution. In addition to that Normalization also suppresses the effect of outliers to some extent.
The most common method of Normalization is as follows:
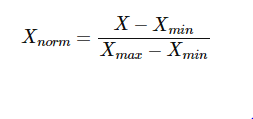
where,
Xnorm = Normalized Variable
X = Variable X's value
Xmin = minimum value of variable X
Xmax = maximum value of variable X
When to Normalize a Variable?
Normalization is a good technique to use when you do not know the distribution of your data or when you know the distribution is not Gaussian (a bell curve). Normalization is useful when your data has varying scales and the algorithm you are using does not make assumptions about the distribution of your data, such as k-nearest neighbors and artificial neural networks.
Example in Code
Unlike previous example we are going to take data from Exponential Distribution
import numpy as np
import matplotlib.pyplot as plt
import seaborn as sns
mean = 187
data = np.random.exponential(mean,1000)
from sklearn.preprocessing import MinMaxScaler
scaled_data = MinMaxScaler().fit_transform(data)
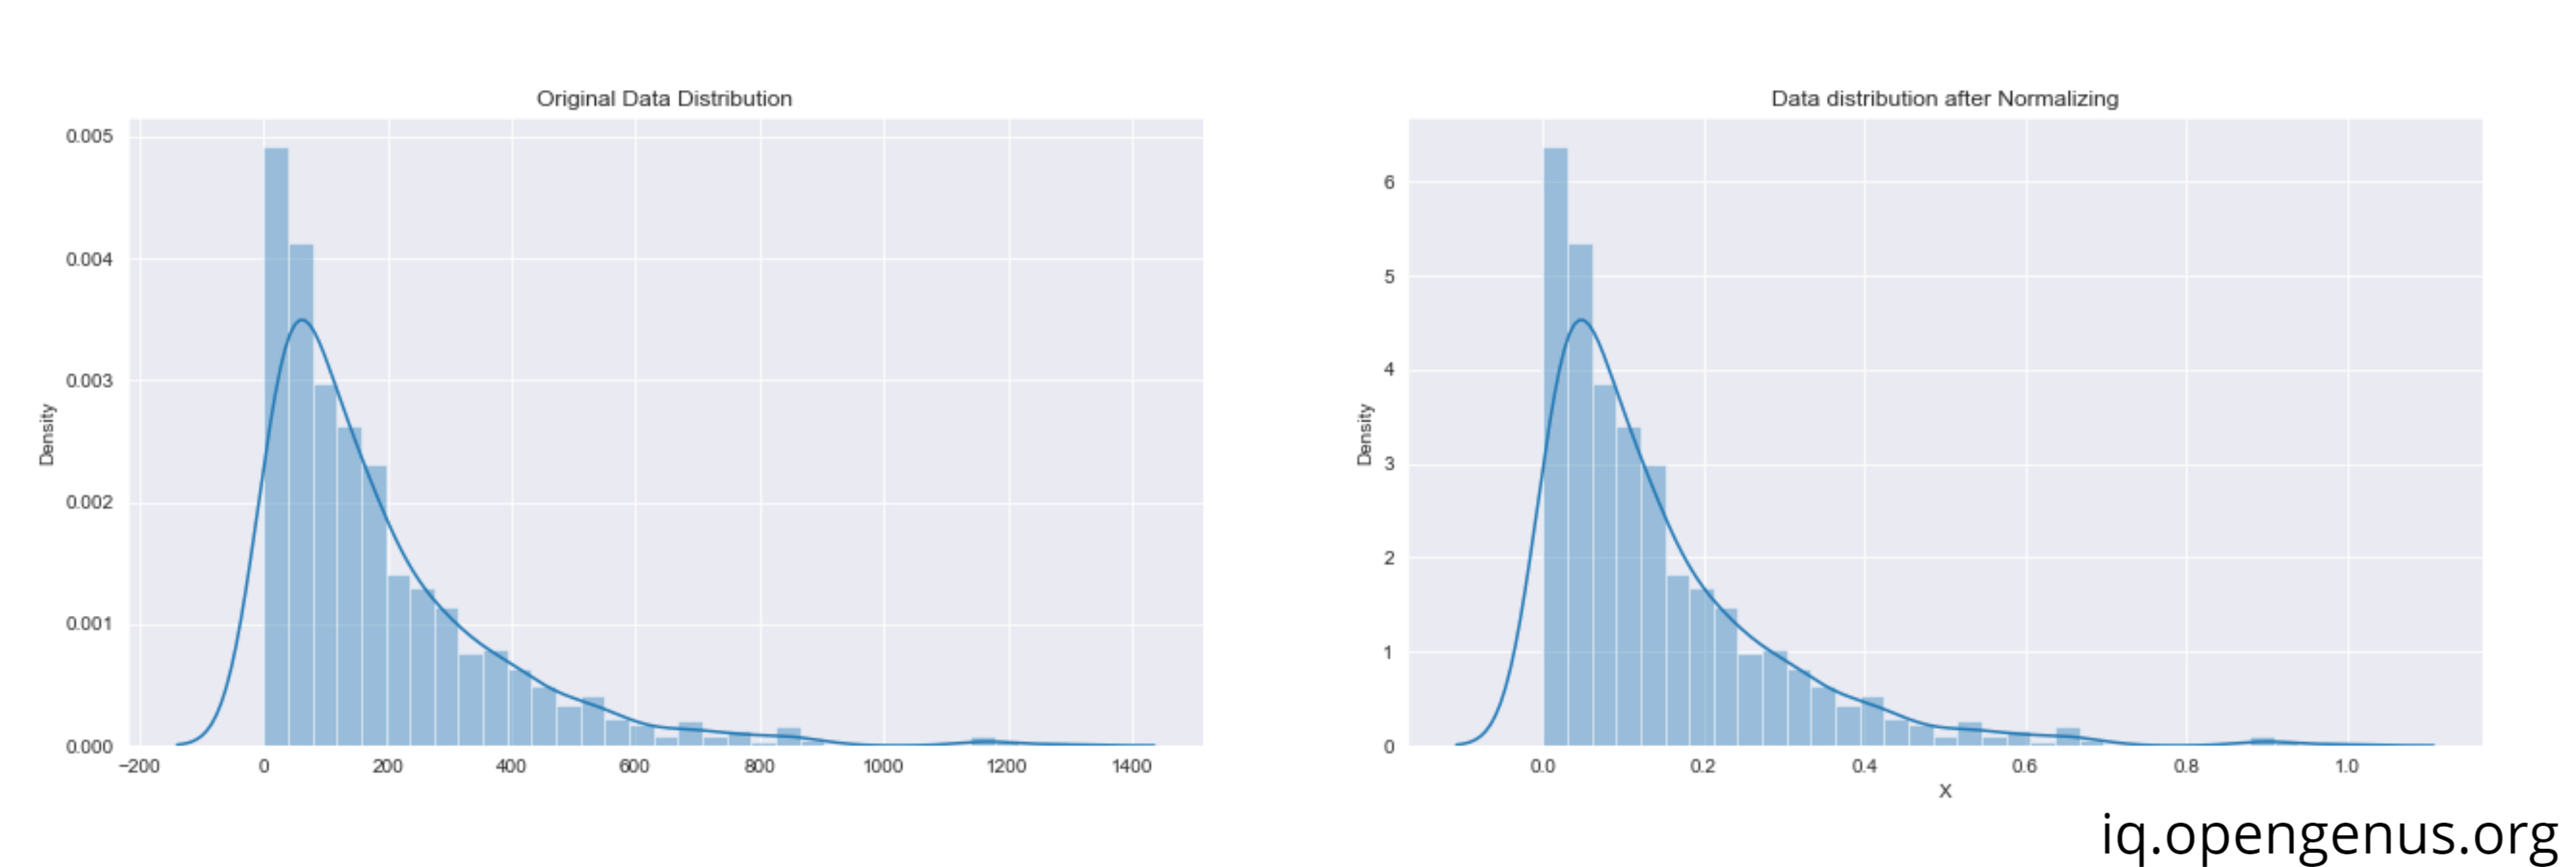
There is no change in data distribution after Normalizing.The only difference is in mean. Initially we had 187 as mean which was specified, after Normalization we got a mean which is close to 0.11
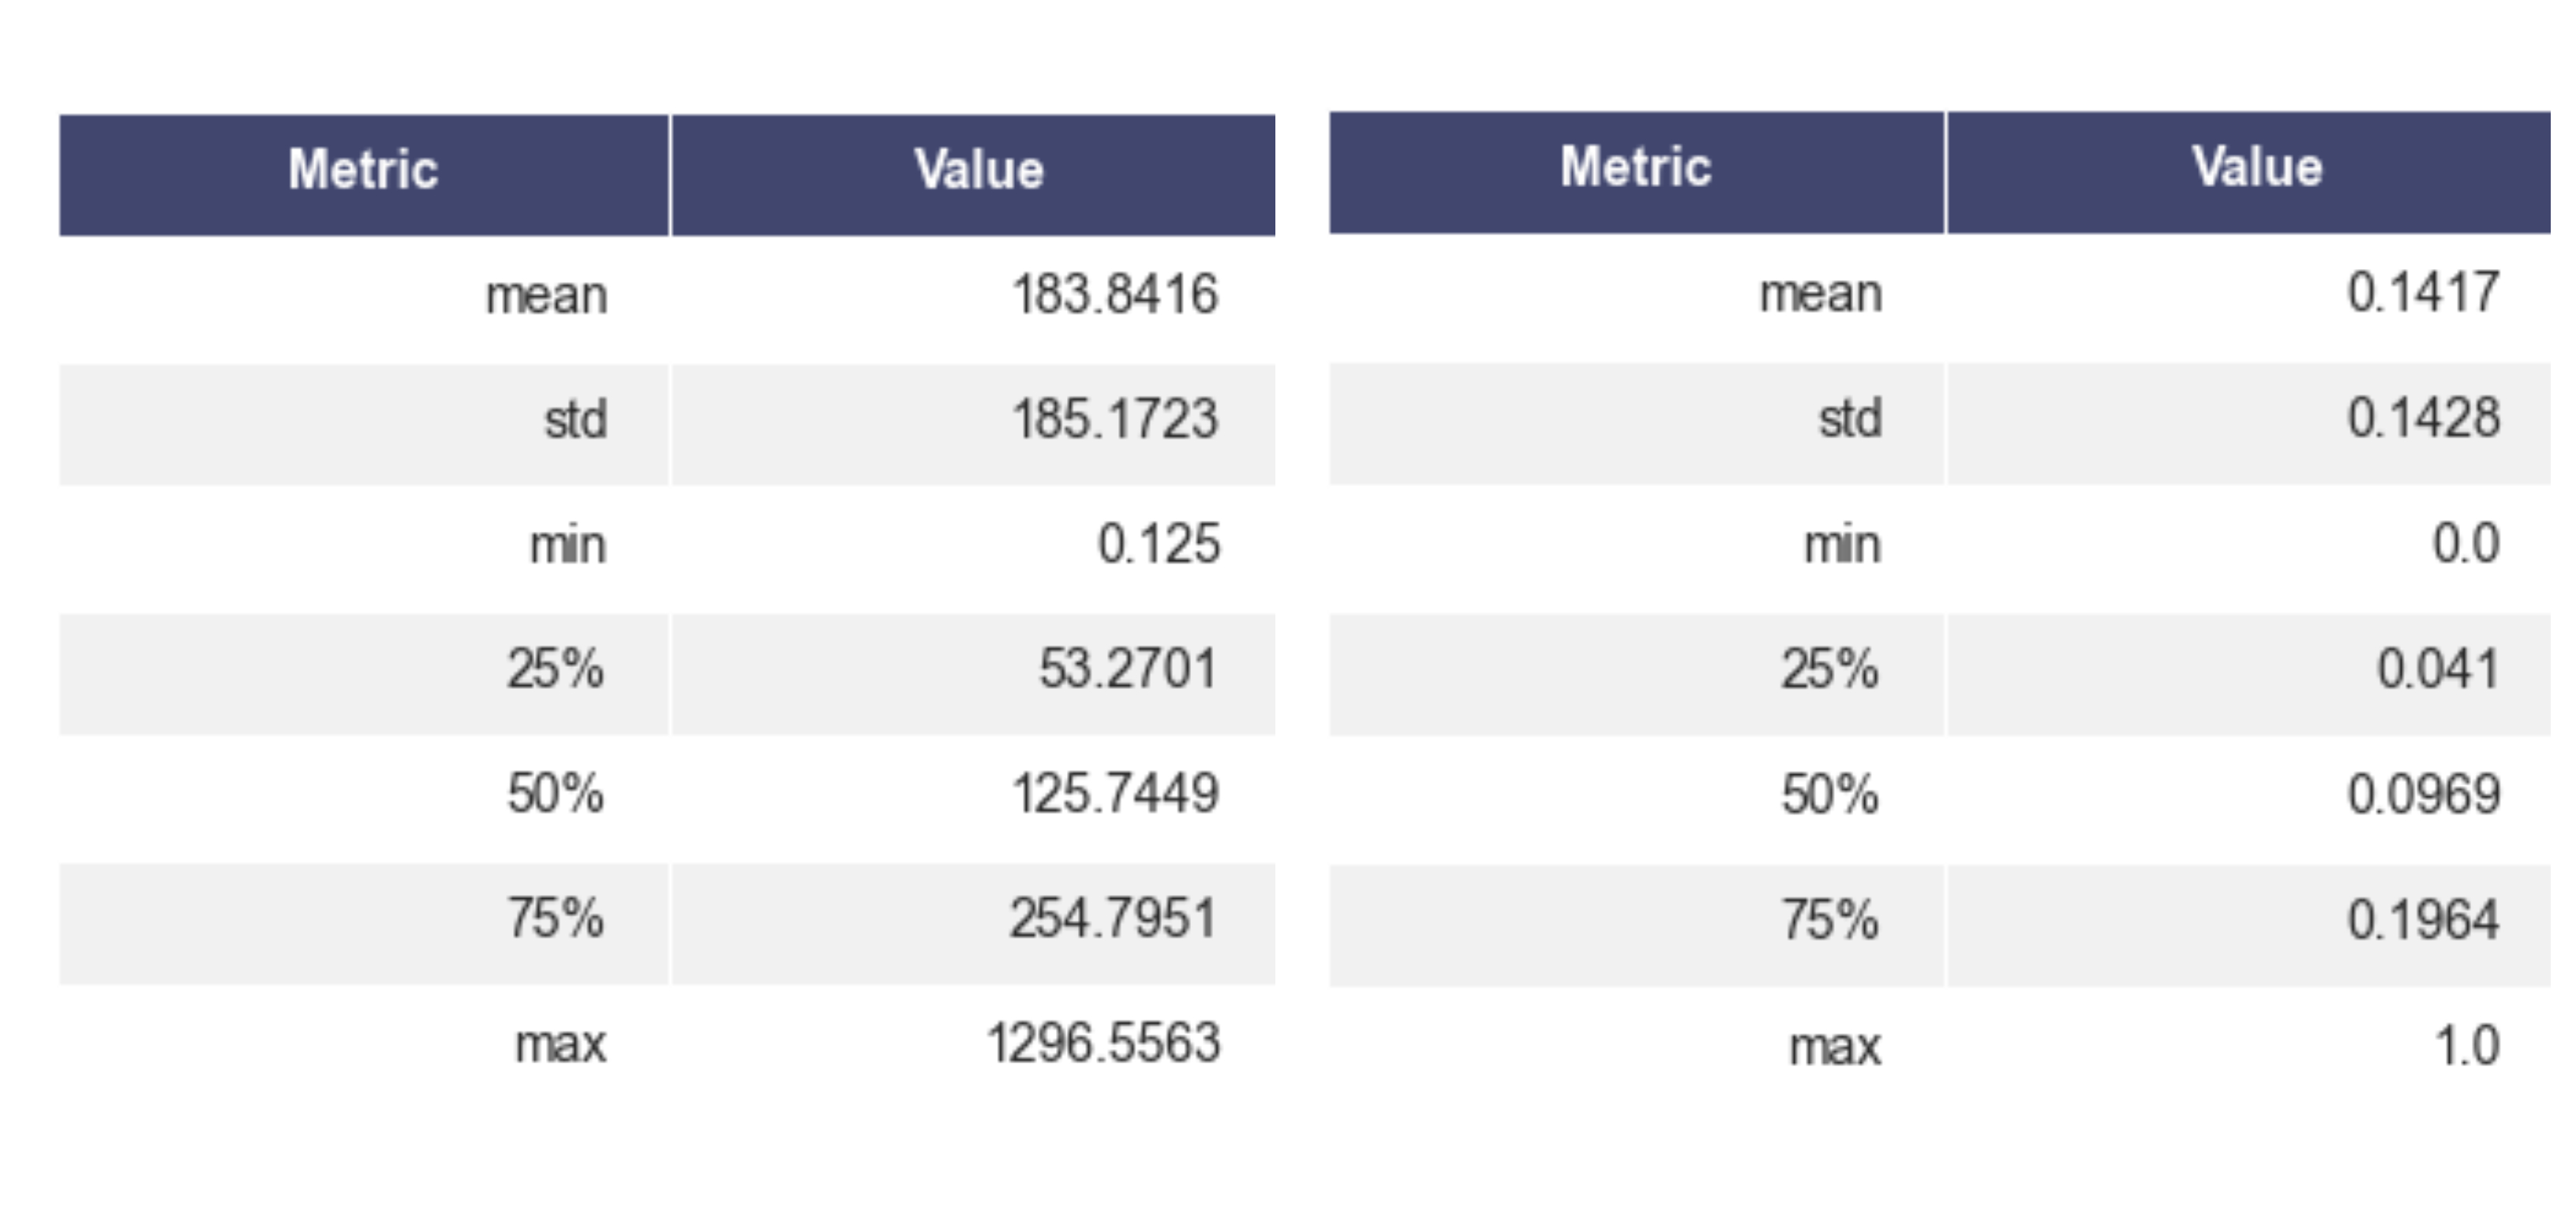
We can see that our data is in our desired range of 0 and 1 with mean 0.14
Regularization
In statistics, particularly in machine learning and inverse problems, regularization is the process of adding information in order to solve an ill-posed problem or to prevent overfitting. Regularization applies to objective functions in ill-posed optimization problems.One of the major aspects of training your machine learning model is avoiding overfitting. The model will have a low accuracy if it is overfitting. This happens because your model is trying too hard to capture the noise in your training dataset. By noise we mean the data points that don’t really represent the true properties of your data, but random chance. Learning such data points, makes your model more flexible, at the risk of overfitting.Regularization is a form of regression, that constrains/ regularizes or shrinks the coefficient estimates towards zero. In other words, this technique discourages learning a more complex or flexible model, so as to avoid the risk of overfitting.
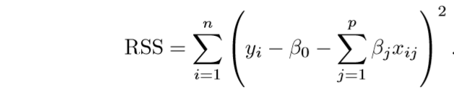
A simple relation for linear regression looks like this. Here Y represents the learned relation and β represents the coefficient estimates for different variables or predictors(X).
Y ≈ β0 + β1X1 + β2X2 + …+ βpXp
The fitting procedure involves a loss function, known as residual sum of squares or RSS. The coefficients are chosen, such that they minimize this loss function.
Now, this will adjust the coefficients based on your training data. If there is noise in the training data, then the estimated coefficients won’t generalize well to the future data. This is where regularization comes in and shrinks or regularizes these learned estimates towards zero.
Regularization is a huge topic itself. Therefore let's end it here without diving deep into the math
Check out the Full Article Here
Conclusion
In this article we, discussed some of the concepts of Data Preprocessing and model optimization in Machine Learning that we use in real word problems. Check out more about Machine Learning on OpenGenus