
In this article, we have explored how to get CO2 emission data for a specified time period and for specific location. For this, we have used Carbon Intensity API and have implemented the code in Python.
Table of Content:
- Development of API (Application Programming Interface)
- Database Presentation
- Preparation and Interpretation of CO2 (carbon dioxide)
- Final Considerations
- References
Let us get started with "Get CO2 emission data using Carbon Intensity API".
1. Development of API(Application Programming Interface)
The API can be considered a set of standards that enable communication between platforms through a series of standards and protocols. In other words, the API works as an intermediary allowing the database to be queried or changed.
It is a server that receives simple HTTP requests and returns data provided by a company/entity. This process facilitates the analysis of available information or even allows for user interaction.
Usually, all information extracted by an HTTP and API returns in JSON format. Proper use of the API maximizes data management. This API was developed in Python language.
In the code (Figure 1), there is an import the date function from the datetime, which will stipulate the range of data that will be required (GET method).
The request library is necessary to make HTTP requests, and the JSON library decodes objects and transforms them into lists or Python dictionaries (vice versa).
from datetime import date

import requests
import json

url = "https://api.carbonintensity.org.uk/intensity"

def emission():
    emission = requests.get(url)
    emission_tax =json()["data"][0]
    return emission["intensity"]["actual"]["index"]

def period(start, end):
    return requests.get(f"{url}/{start}/{end}").json()["data"]

if __name__ == "__main__":
    for entry in period(start="2021-10-4", end="2021-10-5"):
        print("from {from} to {to}: actual_tax:{intensity[actual]} index:{intensity[index]}".format(**entry))
    print(f"{emission_tax() = }")
Figure 1. API used to query CO2 emission data and index.
2. Database Presentation
The database used was developed by the National Grid ESO together with the Environmental Defense Fund Europe and the University of Oxford (Department of Computer Science and WWF).
According to the responsible agency[1]:
" To estimate the carbon intensity of electricity consumed in each region, a reduced GB Network model is used to calculate the power flows across the network. This considers the active and reactive power flows, system losses, and the impendance characteristics of the network. The carbon intensity of both active power flows (gCO2/kWh) and reactive power flows (gCO2/kVArh) is then calculated and the CO2 flows are attributed around the network for each 30 min period over the next several days. The carbon intensity of the power consumed in each region is then determined. The same approach is used to estimate the proportion of each fuel type consumed in each region."
The data source adopted in this article is the CO2 Intensity (National emission) available on the Carbon Intensity API Great Britain website[2].
Other data can also be consulted, such as:
The generated rate of CO2 for different factors (Figure 2):
{
  "data":[{
    "Biomass": 120,
    "Coal": 937,
    "Dutch Imports": 474,
    "French Imports": 53,
    "Gas (Combined Cycle)": 394,
    "Gas (Open Cycle)": 651,
    "Hydro": 0,
    "Irish Imports": 458,
    "Nuclear": 0,
    "Oil": 935,
    "Other": 300,
    "Pumped Storage": 0,
    "Solar": 0,
    "Wind": 0
  }]
}
Figure 2. CO2 generation rate for different energy matrices.
Types of energy matrices used in national territory and their percentage of CO2 generated (Figure 3):
{"data":{
"from":"2021-10-12T02:30Z",
"to":"2021-10-12T03:00Z",
"generationmix":[{
"fuel":"biomass",
"perc":9.4},
{"fuel":"coal","perc":0},
{"fuel":"imports","perc":15.3},
{"fuel":"gas","perc":22},
{"fuel":"nuclear","perc":16.5},
{"fuel":"other","perc":0},
{"fuel":"hydro","perc":1.1},
{"fuel":"solar","perc":0},
{"fuel":"wind","perc":35.6}
]}
}
Figure 3. Current energy matrix and its percentage of CO2 emissions.
Regional data, type of current energy matrix, and its contribution to CO2 generation (Figure 4):
{"data"[{
"regionid":17,
"dnoregion":"Wales",
"shortname":"Wales",
"data":[{
"from":"2021-10-12T02:30Z",
"to":"2021-10-12T03:00Z",
"intensity":{
"forecast":193,
"index":"moderate"},
"generationmix":[{
"fuel":"biomass","perc":0.3},
{"fuel":"coal","perc":0},
{"fuel":"imports","perc":0},
{"fuel":"gas","perc":48.9},
{"fuel":"nuclear","perc":10.2},
{"fuel":"other","perc":0},
{"fuel":"hydro","perc":1.4},
{"fuel":"solar","perc":0},
{"fuel":"wind","perc":39.2}
]}
]}
]}
Figure 4. Energy matrix used in the year 2021 by the region of Wales.
All this information is essential, for example, CO2 emission data for different energy matrices are tools for managing sustainable development policies (Figure 2).
The comparison of active matrices in the national territory (figure 3) can together the electricity generation data indicating the most efficient and least polluting matrices. And the characterization of each region (Figure 4) will provide an overview of what can and should be improved.
3. Preparation and Interpretation of CO2 (carbon dioxide)
Using the code (Figure 1) were generated the information about CO2 emission rate in Great Britain (Table 1) and respective index/classification(Table 2).
The code output is for the time interval between October 4th (23h30min) to October 6th (midnight) between 2017 to 2021.
Table 1. CO2 emission rate in gCO2/kWh generated within the stipulated range between the years 2017 to 2021
| 2017 | 2018 | 2019 | 2020 | 2021 |
|---|---|---|---|---|
| 128 | 238 | 197 | 142 | 124 |
| 128 | 238 | 200 | 144 | 121 |
| 128 | 240 | 208 | 141 | 121 |
| 124 | 237 | 212 | 140 | 120 |
| 118 | 233 | 212 | 133 | 112 |
| 109 | 230 | 213 | 128 | 112 |
| 107 | 228 | 220 | 133 | 110 |
| 105 | 226 | 224 | 140 | 108 |
| 101 | 229 | 216 | 155 | 101 |
| 100 | 240 | 213 | 171 | 96 |
| 111 | 253 | 204 | 181 | 106 |
| 148 | 267 | 199 | 202 | 117 |
| 173 | 286 | 205 | 217 | 130 |
| 183 | 294 | 214 | 223 | 146 |
| 192 | 300 | 214 | 229 | 156 |
| 191 | 309 | 211 | 228 | 155 |
| 186 | 310 | 202 | 222 | 154 |
| 179 | 307 | 201 | 217 | 152 |
| 172 | 300 | 196 | 212 | 151 |
| 173 | 306 | 191 | 207 | 148 |
| 162 | 301 | 189 | 207 | 146 |
| 156 | 297 | 183 | 205 | 142 |
| 151 | 293 | 178 | 206 | 136 |
| 148 | 279 | 176 | 201 | 129 |
| 149 | 274 | 174 | 202 | 124 |
| 160 | 276 | 171 | 201 | 111 |
| 160 | 278 | 169 | 200 | 105 |
| 166 | 278 | 172 | 197 | 109 |
| 170 | 281 | 174 | 200 | 106 |
| 174 | 287 | 180 | 210 | 92 |
| 186 | 293 | 179 | 207 | 99 |
| 200 | 295 | 181 | 201 | 111 |
| 216 | 311 | 184 | 202 | 120 |
| 224 | 318 | 183 | 200 | 129 |
| 235 | 324 | 181 | 195 | 134 |
| 226 | 327 | 182 | 195 | 137 |
| 226 | 326 | 178 | 201 | 139 |
| 230 | 328 | 172 | 199 | 140 |
| 230 | 323 | 172 | 194 | 138 |
| 230 | 327 | 164 | 189 | 138 |
| 224 | 330 | 152 | 185 | 134 |
| 225 | 326 | 137 | 168 | 127 |
| 209 | 314 | 129 | 176 | 115 |
| 193 | 304 | 123 | 141 | 105 |
| 179 | 289 | 119 | 123 | 92 |
| 148 | 286 | 116 | 110 | 91 |
| 142 | 286 | 117 | 108 | 82 |
| 149 | 290 | 125 | 106 | 84 |
| 143 | 293 | 130 | 105 | 83 |
Table 2. Index/Classification of CO2 emission rate
| LOW | MODERATE | HIGH |
|---|---|---|
| 82-199 | 200-280 | >= 281 |
Table 3 groups the classification (Table 2) and the arithmetic average of the generated CO2 rates (Table 1).
Table 3. Approximate values of CO2 emission rate (gCO2/kWh) for a time interval between 2017 to 2021
| YEAR | EMISSION | INDEX |
|---|---|---|
| 2017 | 121 | low |
| 2018 | 179 | moderate |
| 2019 | 180 | moderate |
| 2020 | 285 | high |
| 2021 | 168 | moderate |
The data from Table 1 and the Excel program has generated the graph (Figure 5). It contains all information about CO2 emission rate in each 30 minutes for energy generation in gCO2/kWh.
In 2020 was the highest value of CO2 generated (Table 3). Several factors may have contributed to this situation. Such as the type of energy matrix or even some unusual activity at the time.
However, to have a better understanding of the subject, more in-depth studies must be carried out.
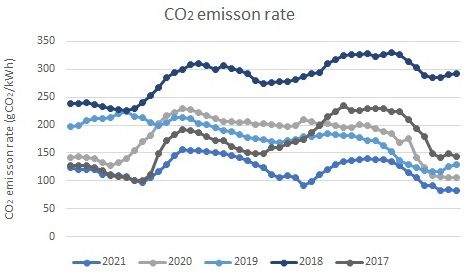
Figure 5. Graph of CO2 emission for the interval between 2017 to 2021.
4. Final Considerations
What is the importance of the study the CO2 emissions in electrical energy generation?
The CO2 high rate emission is causing a ripple effect, where the increase in global temperature is changing the climate. With this, the sea level is changing, lack of drinking water, rain, food, and pests are emerging, and consequently, a possible breakdown in society could happen soon.
One of the biggest problems is the consumption of electricity and its production. It is necessary a sustainable development, preserving green areas, studying new forms to generate clean energy, and large corporations' and society's awareness.
With this article at OpenGenus, you must have the complete idea of how to Get CO2 emission data using Carbon Intensity API.
References
[1] Carbon Intensity API, viewed October 2021. carbonintensity.org.uk
[2] Carbon Intensity API Great Britain - National Carbon Intensity, viewed October 2021 api.carbonintensity.org.uk