
Key Takeaways
- Streamlit is a Python library that enables us to quickly build front-end web pages for our data application by using just Python codes.
- Streamlit allows us to draw various widgets including different charts, tables, images and input elements like form, button, slider etc.
- After developing our application, we can easily deploy and share it by using GitHub and StreamLit Community Cloud, which is a free service.
Data analysis is one of the areas where Python shines as a language. Many spectacular libraries like Numpy, Pandas, Matplotlib and Seaborn make Python the ideal language for analyzing, understanding and presenting data to get useful insights out of them. After getting these insights our job is to present our findings to the world. We may think of Jupyter Notebooks for this purpose since they are not only interactive, but also serve as the documentation for the codes at the same time. But what if we are told to present our results in a dashboard-like interface in a web application that can be used by non-tech users who don't concern with the code, but only with the result that it produces. Building such application requires front-end development skills using modern JavaScript frameworks, which means after we're done with our data analysis part in Python, we now have to jump to a different technology just for building our front-end. We also have to make sure our UI is intuitive and responsive which requires additional help from UI/UX designers. So, we can see that the development of our presentation part becomes quite complicated and cumbersome. What if we could also build our font-end in Python as well? This is where Streamlit, a Python library comes into the picture.
What is Streamlit exactly?
Streamlit is a Python library that helps us to build data-oriented web applications without a single line of HTML, CSS and Javascript. Streamlit uses the React JavaScript framework under the hood for building the entire web app UI and it takes Python codes as input that tells it how to draw different components, which we will discuss in a moment.
Installing Streamlit
Before we get started with Streamlit, we have to install the streamlit Python package by running the following command .
pip install streamlit
We also need the numpy, pandas and matplotlib packages for running the examples that will be shown below. If not installed already, they can be installed by running the following command:
pip install numpy pandas matplotlib
Now that we're done installing necessary packages, we're ready to get our hands on Streamlit.
Creating Our First Streamlit Application
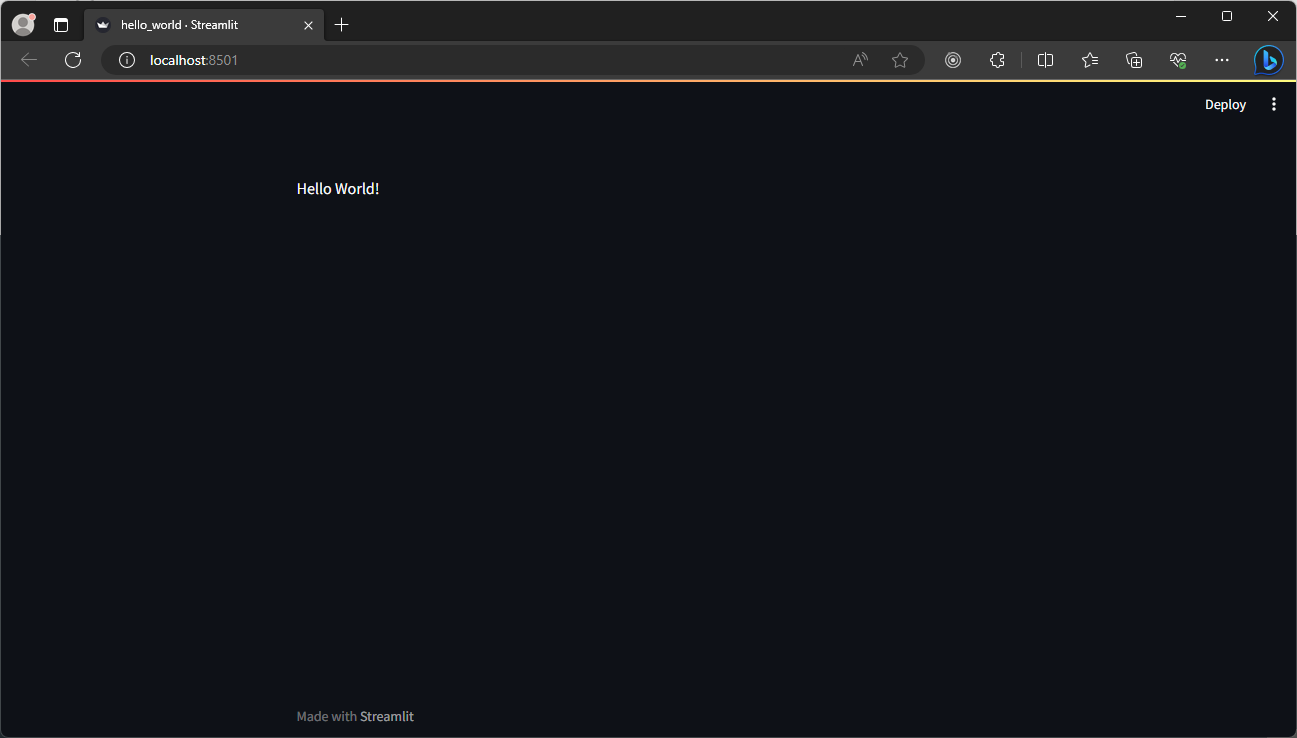
As our very first example, we will learn how to display text to our web application using Streamlit. To begin, we will open any text editor of our choice and write the following code:
import streamlit

streamlit.write("Hello World!")
The write function is used for rendering any text to our web page. I've written the above code in a file named hello_world.py. We can now run this file by using the following command:
streamlit run hello_world.py
Note that we're not running this file using python. Instead, we can directly run a Streamlit application by providing our filename as argument to the streamlit run command.
When we run Streamlit for the very first time, it may ask our email address for registering to its newsletter. This step is optional and we can skip it by pressing enter. Then, Streamlit will start a local server and server our application in a web page. It should also open the web page in the default web browser of our system. If it doesn't we can copy the URL of the application that Streamlit has printed in the terminal and paste it to a browser manually.
This is how the rendered web page looks like:
Notice the menu icon in the top-right (Three dots). By pressing it, we can see the Settings option. Click on that option and we'll find that Streamlit provides us many ways to customize the behavior of our application including modifying the theme of the web app. Now that we've learned about displaying texts on our web page, let's learn how to add images to it!
Adding Images
Before we can add images to our web page, we need a Python library that will let us import an image from a file path. There are many libraries for this purpose. I'll be using PIL or Python Image Library which is pre-installed by default in most Python distributions.
import streamlit
from PIL import Image
# We're adding a page title. It will be rendered as html heading tag.
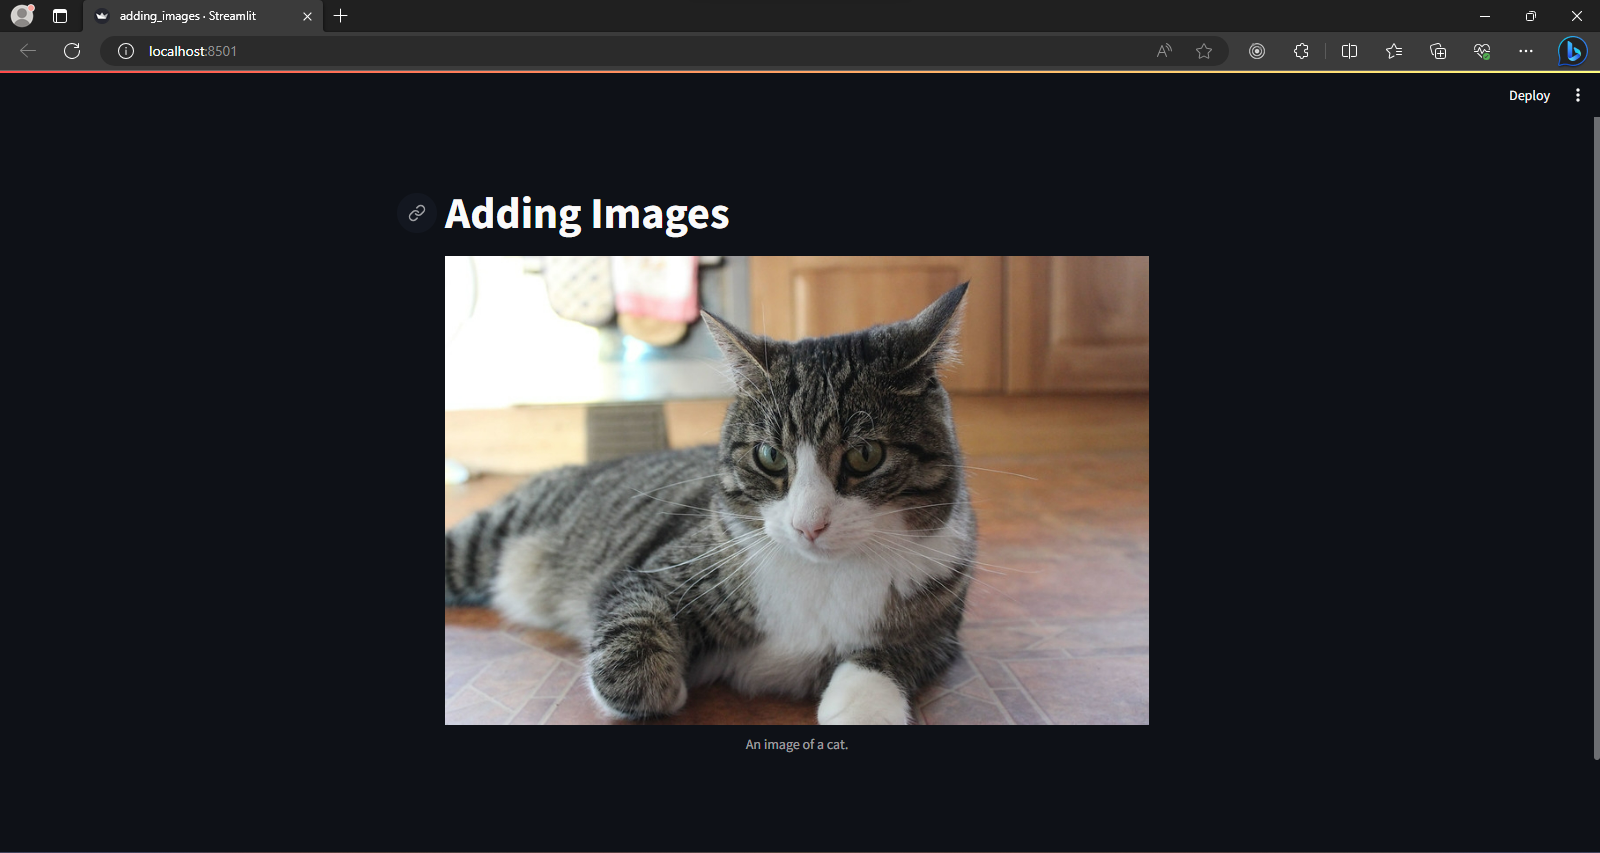
streamlit.title("Adding Images")
# We're opening an image file using PIL
cat_image = Image.open("cat.jpg")
# Now, we're ready to display the image in our web page!
streamlit.image(image=cat_image, caption="An image of a cat.")
We can use the title function to add a title for our page. The image function is used for adding images, once we have loaded an image.
The output of the code above looks like this:
In the next example, we will see how to display tables in our web page.
Displaying Tables
We can use pandas dataframes to display tables in our web page. To do so we first have to create a dataframe, and then we can display that dataframe using Streamlit's dataframe function. That dataframe will be rendered as a table in our web page.
import streamlit
import pandas as pd
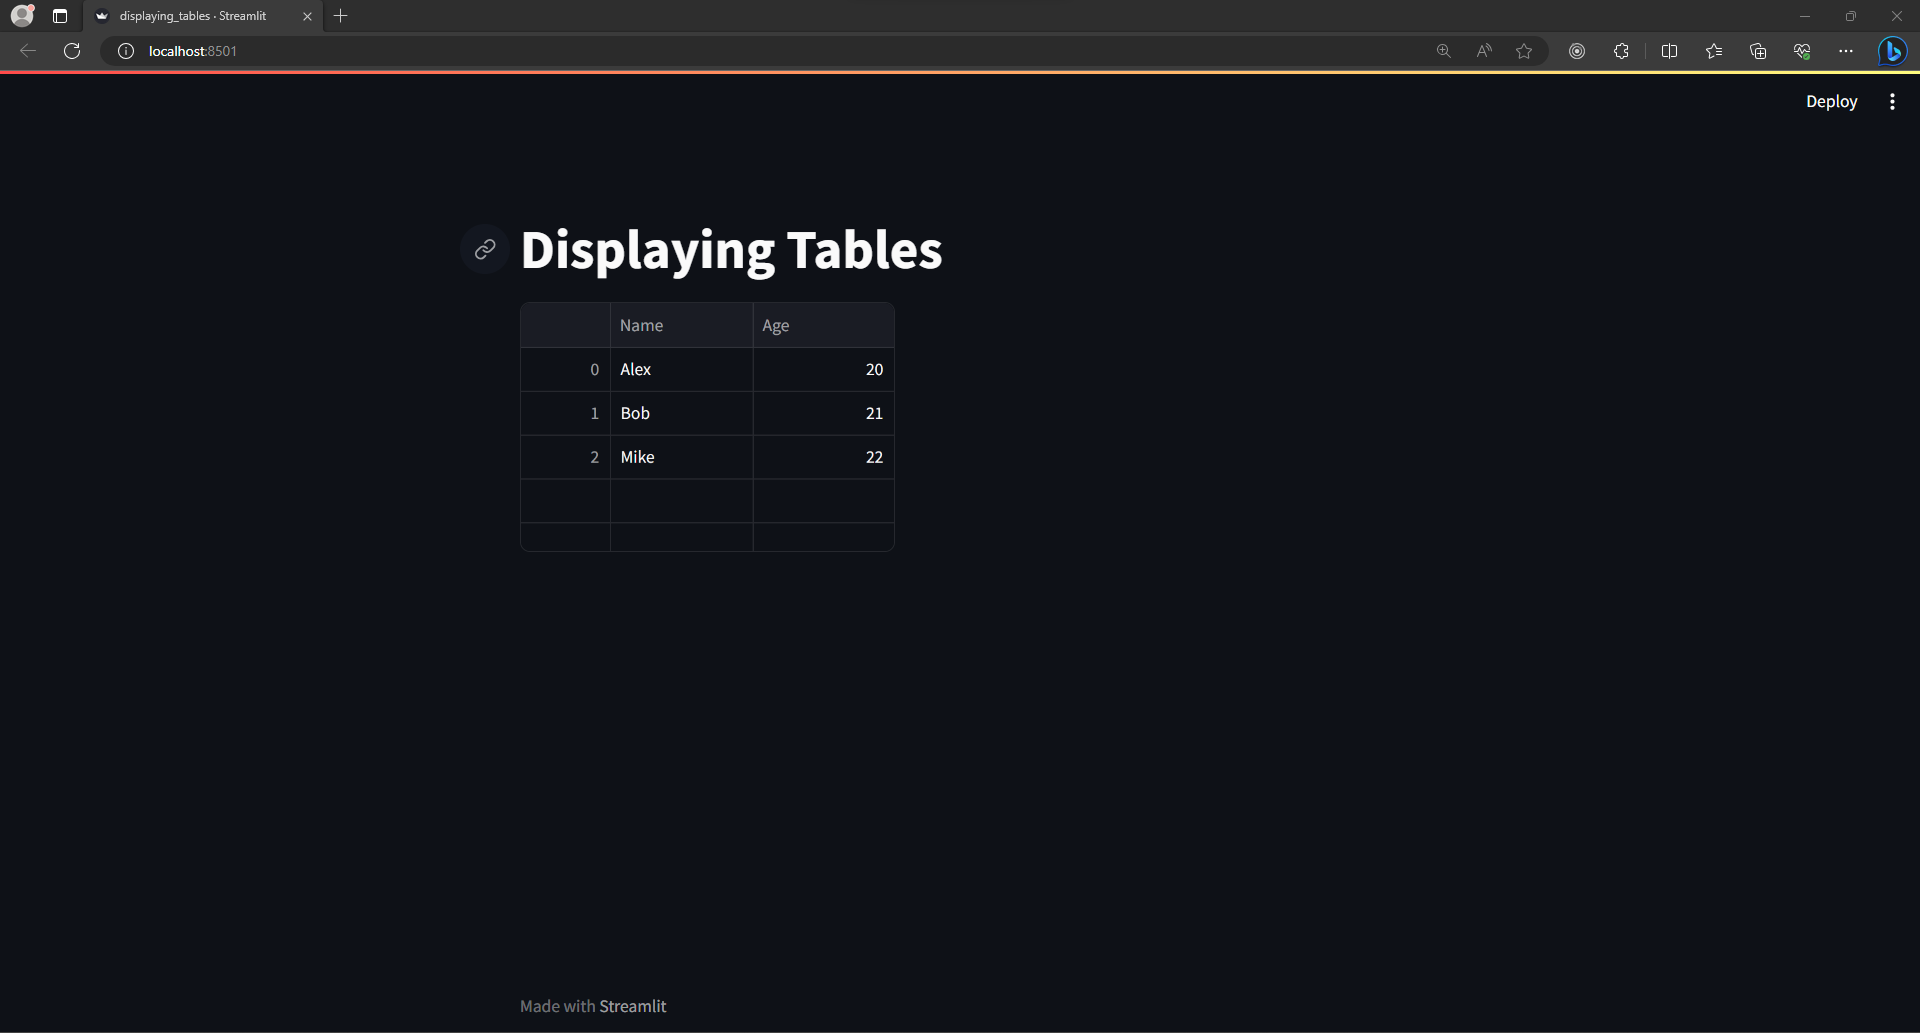
streamlit.title("Displaying Tables")
# We're creating a dataframe
person_df = pd.DataFrame({
"Name": ["Alex", "Bob", "Mike"],
"Age": [20, 21, 22]
})
# Then, we're displaying the dataframe in our web page.
# It will be rendered as an interactive table.
streamlit.dataframe(person_df, width=300, height=200)
The output of the code is shown below. Note that the rendered table is interactive. If we click on the column header of any column, the rows will be sorted according to that column.
Next, we'll learn about displaying graphs in our web page. But this time the web page won't display static data like our previous examples. Instead, it will e dynamic web page that will render the graph based on user inputs!
Displaying Graph
Streamlit can display several types of graph including line chart, bar chart, scatter chart etc. For this example, we will go with line chart. We will be plotting a power function where the user will be able to choose the power value using a slider widget, which is one of the many widgets provided by Streamlit. Then, we will plot the line chart based on the slider value.
import streamlit
import pandas as pd

streamlit.title("Displaying Graphs")

# We will take the power as input
power = streamlit.slider("Power Value:", min_value=0, max_value=10)

x = range(1, 11, 1)
y = [i ** power for i in x] # We're generating an array that contains the powers of all elemnts in 'x'

# To display a chart, we have to put our data in a dataframe
df = pd.DataFrame({"x": x, "y": y})

# Now, we're ready to display our line chart. We have to specify which columns # of the dataframe should be uesd by x and y axis
streamlit.line_chart(data=df, x="x", y="y")
The code above produces the following output:
How does Streamlit update the web page?
As we can see in the image above, whenever we change the slider input, Streamlit automatically renders the web page with the updated power value. For every update, it will run our python code from top to bottom again and again. This is why it is important keep our codes optimized. Otherwise the web page will take time to refresh every time the user changes an input. If we have to do computationally expensive operations like loading huge data set, we can put that resource intensive code in a function and decorate that function with @st.cache_data decorator. This will cache that function's output resulting in smoother performance across refreshes.
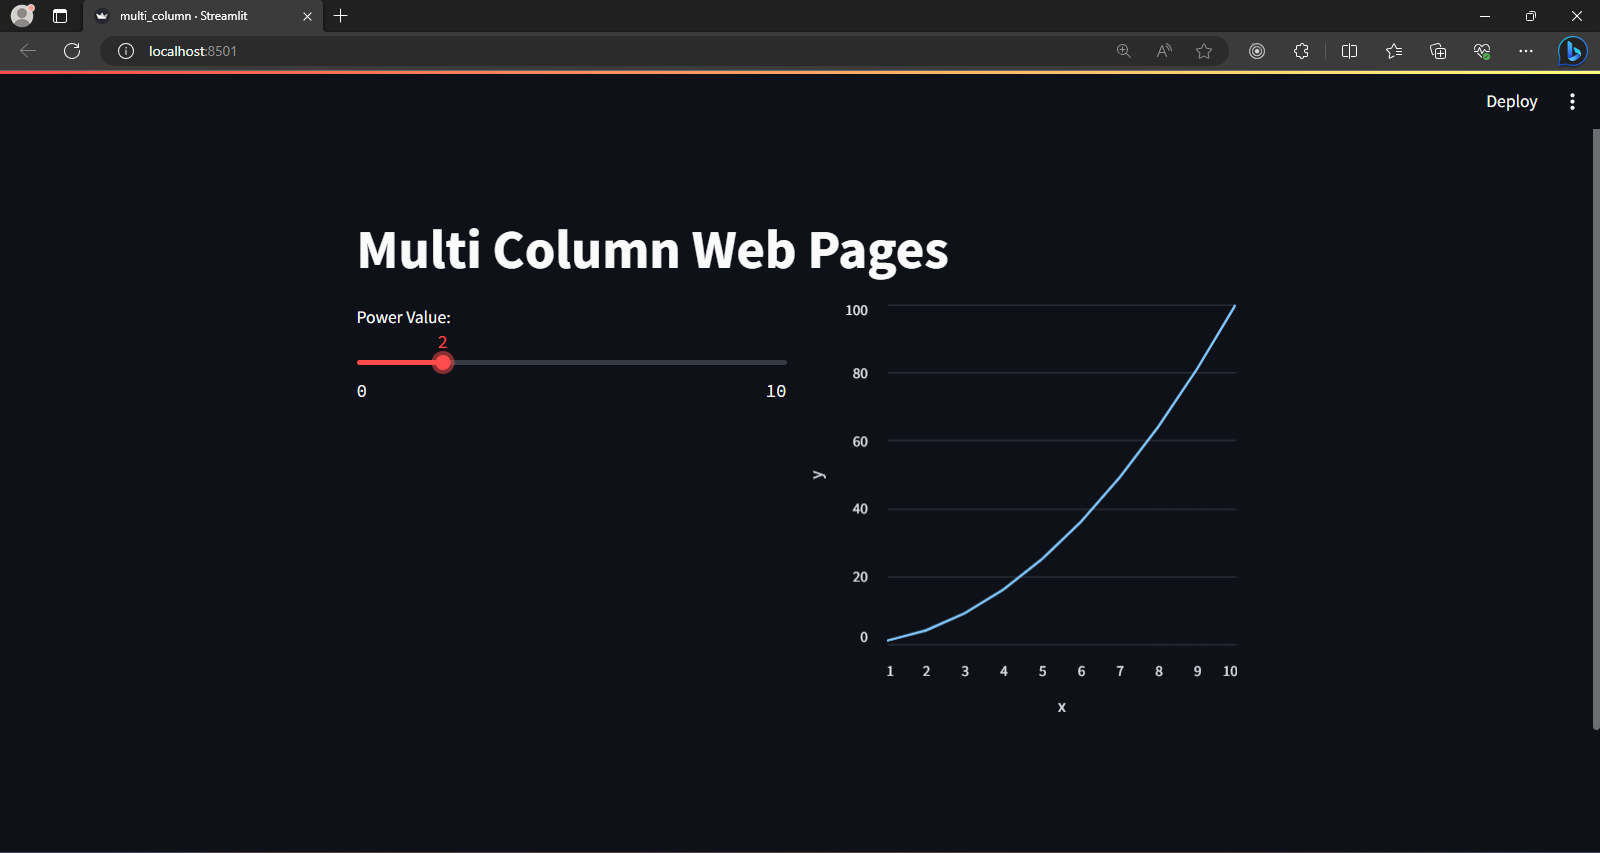
Multi Column Web Page
Up until now, all the examples that are shown above rendered every element in the center of the web page in a single column. Streamlit also allows us to create multi-column web pages, which we will explore in this final example. We will use the same slider and chart widget that we used in the previous example. But this time, we want to design a two column website. We want the slider to be placed in the left column and the chart to be placed in the right column.
import streamlit
import pandas as pd

streamlit.title("Multi Column Web Pages")

# We're creating two columns and assigning their references to variables
left_column, right_column = streamlit.columns(2)

# To put the slider in a column, use <column_name>.slider
power = left_column.slider("Power Value:", min_value=0, max_value=10)

x = range(1, 11, 1)
y = [i ** power for i in x]

df = pd.DataFrame({"x": x, "y": y})

# To put the line chart in a column, use <column_name>.line_chart
right_column.line_chart(data=df, x="x", y="y")
The output of the code above is shown below:
Deploying Our Web Page
If we're satisfied with our web page, we may want to share it with the world. For doing so, Streamlit provides several deployment options for different cloud services. For our case, we will use Streamlit Community Cloud, which is a free service that utilizes from GitHub repositories. For using this, we first have to upload our code to a GitHub repository. The repository must include a requirements.txt file, where we have to list the name of our dependency packages. For our case, this file should look like below:
numpy
pandas
matplotlib
streamlit
The directory structure of our repository should look like this:
repository/
├── main.py
└── requirements.txt
The repository may also contain additional Python files if necessary. Now that we have our repository set up, we can buckle up to deploy our app. Let's Head towards https://share.streamlit.io/ and sign up with our GitHub account. After we're taken to our dashboard, let's press "New App" button. Then we'll be asked to enter necessary information about the repository that contains our Streamlit code. We also have to specify the main Python file that will start our application.
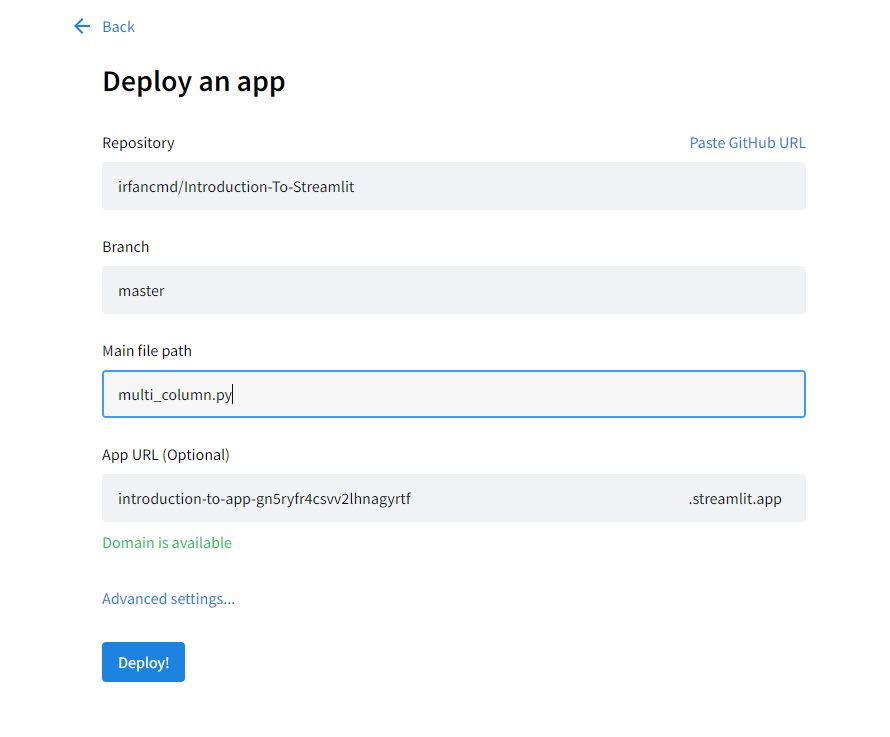
After we're done with entering the details, we can hit the "Deploy!" button. We will be redirected to a generated URL where our app will be hosted and it will take a while for our app to become ready.
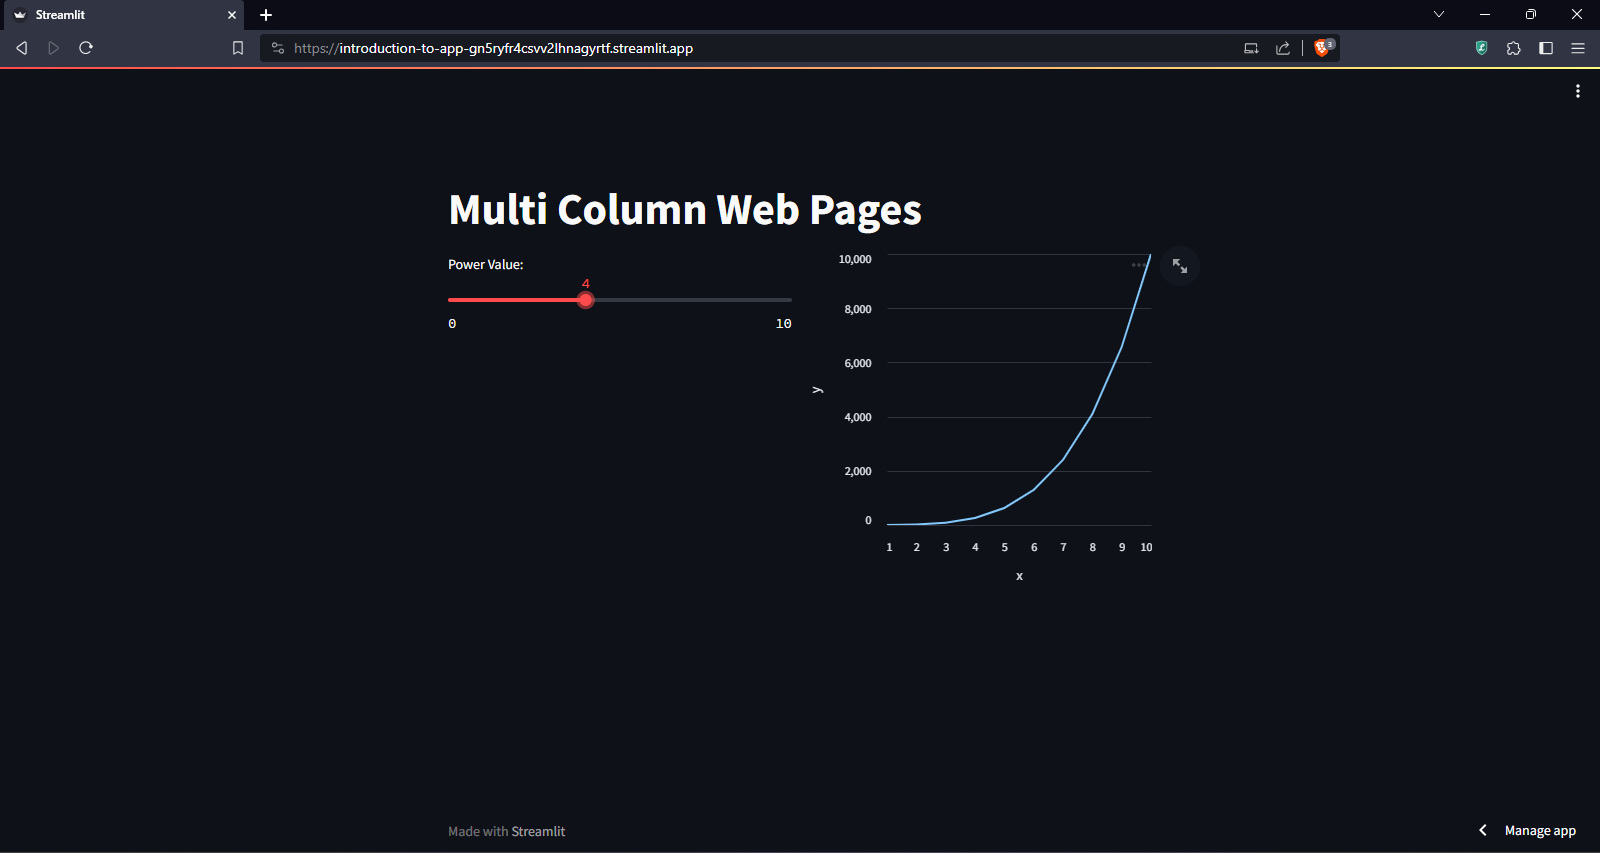
After our app becomes ready, we will be able to share the URL for others to view and interact with our web application.
Conclusion
In this article, we've explored the very core and basic functionalities of Streamlit. It is a quite handy tool for data scientists who want to present their results in an appealing way without the need for switching technologies. Streamlit provides many more features for building complex web applications. If you're interested, you may look up the following topics:
- Storing and accessing session variables in Streamlit
- Building multi-page websites using Streamlit
- Applying custom themes in Streamlit
- Using forms in Streamlit