
Get this book -> Problems on Array: For Interviews and Competitive Programming
Key Takeaways
- Identifying Significant Features: Understanding crucial vehicle features impacting fuel efficiency informs design and manufacturing priorities.
- Environmental Factors Matter: Climate and driving conditions influence fuel efficiency, guiding real-world optimization efforts.
- Data-Driven Decision Making: Data analytics and models like linear regression empower informed decisions in the automotive industry.
- Mean Square Error (MSE) Evaluation: Proper model evaluation, using metrics like MSE, ensures accurate performance assessment.
- Environmental Conservation: Enhancing fuel efficiency contributes to reducing carbon emissions, aiding environmental conservation efforts.
- Balancing Complexity: Simple models like linear regression strike a balance between computational efficiency and accuracy.
- Empowering Consumers: Informed consumers can make eco-conscious choices, encouraging the production of environmentally friendly vehicles.
Table of contents:
- Input/Output
- Dataset Structure
- Approach and Model Selection
- Why Linear Regression and MSE are suitable for this Problem?
- The Project
- Different Python libraries used in the project
- Gather and Explore the Data
- Exploratory Data Analysis
- Fitting the Regression Model
- Making Predictions
- Plotting The Model
- Error Metrics
- Data Cleaning
- Data Exploration
- Fitting a Model
- Plotting the Predictions
- Error Metrics
- Conclusions
- Deployment (Optional)
Goal: The goal of the fuel efficiency project at OpenGenus is to predict the fuel efficiency of a vehicle based on various input features. Fuel efficiency, often measured in miles per gallon (MPG) or liters per 100 kilometers (L/100km), is a critical factor for both consumers and environmental concerns. Predicting fuel efficiency accurately helps car manufacturers design more eco-friendly vehicles and aids consumers in making informed choices about fuel consumption.
Input/Output:
Vehicle Features:
- Categorical Features: Make, model, type of fuel (gasoline, diesel, electric, hybrid, etc.).
- Numerical Features: Engine displacement, horsepower, weight, acceleration, number of cylinders, etc.
- Temporal Features (possibly): Manufacturing year, as older cars might have different efficiency standards.
- Optional Features: Aerodynamic properties, tire type, transmission type (manual, automatic).
Output:
- Fuel Efficiency: The output variable is continuous and represents the miles per gallon (MPG) or liters per 100 kilometers (L/100km) that the vehicle can achieve under certain conditions.
Dataset Structure:
The dataset for this problem would be structured in tabular form, where each row represents a specific vehicle, and columns represent various features and the target variable:
- Origin and Model name: The brand or manufacturer of the vehicle (categorical).
- Model year: The year when the vehicle was manufactured (temporal, numerical).
- Engine Displacement: The size of the vehicle's engine in liters (numerical).
- Horsepower: The power of the vehicle's engine in horsepower (numerical).
- Weight: The weight of the vehicle in pounds or kilograms (numerical).
- Acceleration: The time taken by the vehicle to accelerate from 0 to 60 miles per hour in seconds (numerical).
- Number of Cylinders: The total number of cylinders in the vehicle's engine (numerical).
Target Variable:
- Fuel Efficiency: The number of miles per gallon (MPG) or liters per 100 kilometers (L/100km) achieved by the vehicle (numerical).
Approach and Model Selection:
-
Linear Regression:
Linear regression is a fundamental and widely used statistical technique for predictive modeling. It assumes a linear relationship between the input features and the target variable. In the context of predicting fuel efficiency, linear regression is a reasonable choice because it allows us to explore the relationships between various vehicle features and fuel efficiency in a straightforward manner. Linear regression is computationally efficient, interpretable, and provides a good starting point for understanding the data. -
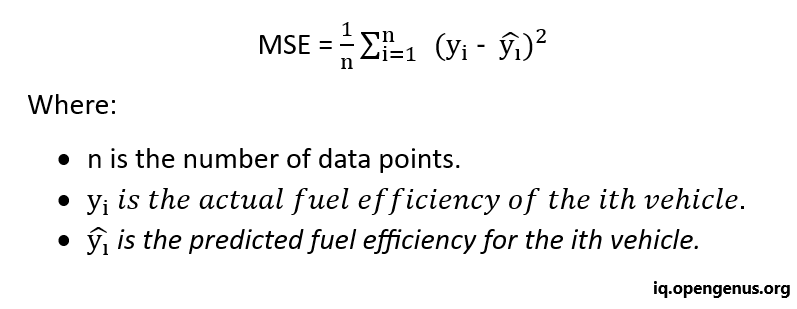
Mean Square Error (MSE) as the Evaluation Metric:
Mean Square Error is a common metric used to measure the average squared difference between the predicted values and the actual values in a regression problem. In the context of fuel efficiency prediction:
Why Linear Regression and MSE are suitable for this Problem:
-
Linear Relationship Assumption:
Linear regression assumes a linear relationship between the input features and the target variable. In the case of fuel efficiency, many factors like engine size, weight, and horsepower can exhibit linear relationships. Linear regression allows us to capture these relationships effectively. -
Interpretability:
Linear regression provides interpretable coefficients for each feature, which helps in understanding the impact of individual features on fuel efficiency. This interpretability is valuable for both researchers and consumers, as it provides insights into which vehicle characteristics influence fuel efficiency the most. -
MSE Measures Prediction Accuracy:
MSE is a relevant metric because it penalizes larger errors more heavily. In the context of fuel efficiency, accurate predictions are crucial. MSE ensures that the model is penalized more for larger deviations from the actual fuel efficiency values, aligning with the practical importance of accurate fuel efficiency predictions. -
Simplicity and Performance:
Linear regression is simple to implement and serves as a baseline model. Despite its simplicity, it can perform well when the relationships between features and fuel efficiency are approximately linear. It also provides a benchmark against which more complex models can be compared.
The Project:
Different Python libraries used in the project:
- Pandas: This library facilitates loading the data frame into a 2D array format and provides various functions to perform multiple analysis tasks efficiently in a single operation.
- Matplotlib: This library is utilized for creating visual representations and graphical visualizations of data.
- Sklearn – This module encompasses several libraries equipped with pre-implemented functions, enabling tasks ranging from data preprocessing to model development and evaluation.
Gather and Explore the Data:
- Dataset: Collect a dataset containing features such as horsepower, weight, cylinders, etc., along with the corresponding fuel efficiency values.
- The Dataset can be downloaded from here: ics.uci.edu/ml/datasets/Auto+MPG
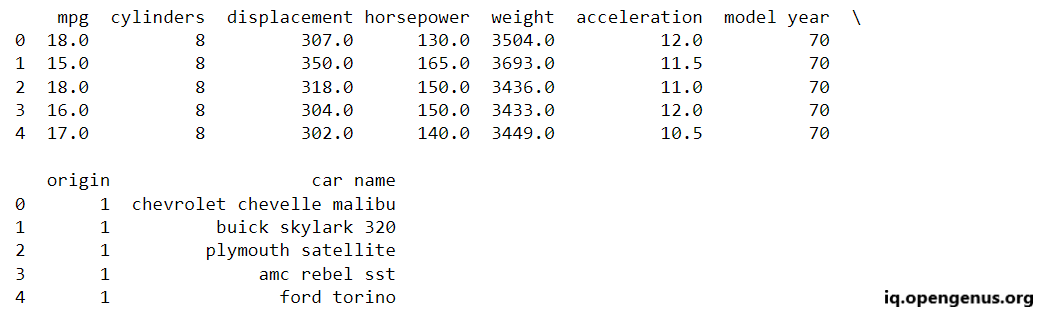
import pandas as pd

columns = ["mpg","cylinders","displacement","horsepower","weight","acceleration","model year","origin","car name"]
cars = pd.read_table("auto-mpg.data", delim_whitespace=True,names=columns)
print(cars.head(5))
Exploratory Data Analysis:
Getting correlation between a car's weight and acceleration with it's fuel efficiency.
from matplotlib import pyplot as plt

fig = plt.figure()
ax1 = fig.add_subplot(2,1,1)
ax2 = fig.add_subplot(2,1,2)
cars.plot('weight','mpg',kind='scatter',ax=ax1)
cars.plot('acceleration','mpg',kind='scatter',ax=ax2)
plt.show()
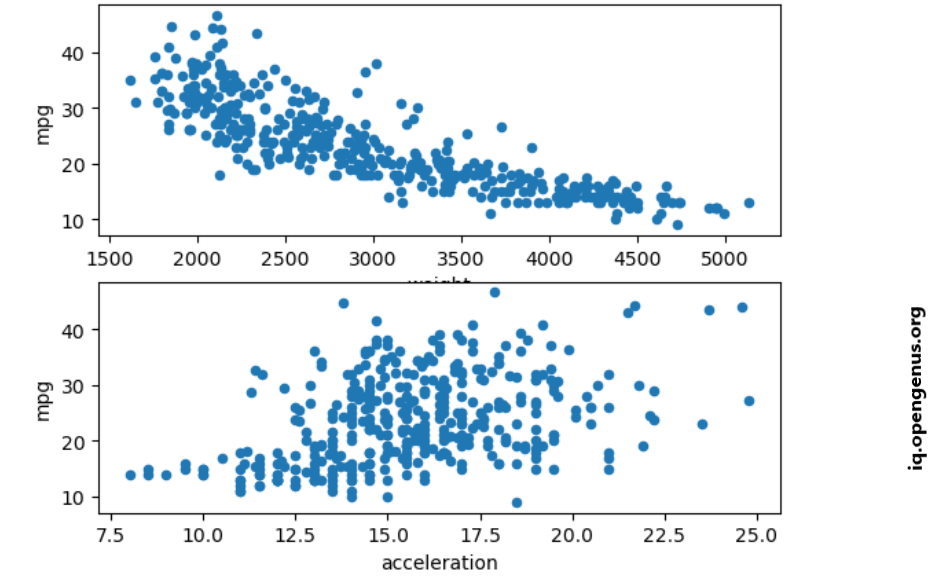
The above scatterplot shows a strong negative linear relationship between weight and mpg and a weak positive relationship between acceleration and mpg.
Fitting the Regression Model:
Certainly, let's quantify the relationship between weight and mpg using Linear Regression from scikit-learn.
from sklearn.linear_model import LinearRegression

lr = LinearRegression()
lr.fit(cars[["weight"]].values, cars["mpg"])
Making Predictions:
Once the model has been trained with the provided data, it can be utilized for predictions.
Although it is not the standard practice to predict on the same dataset used for training in machine learning, doing so can be valuable for evaluating the model's effectiveness in accurately capturing the data.
predictions=lr.predict(cars[["weight"]])
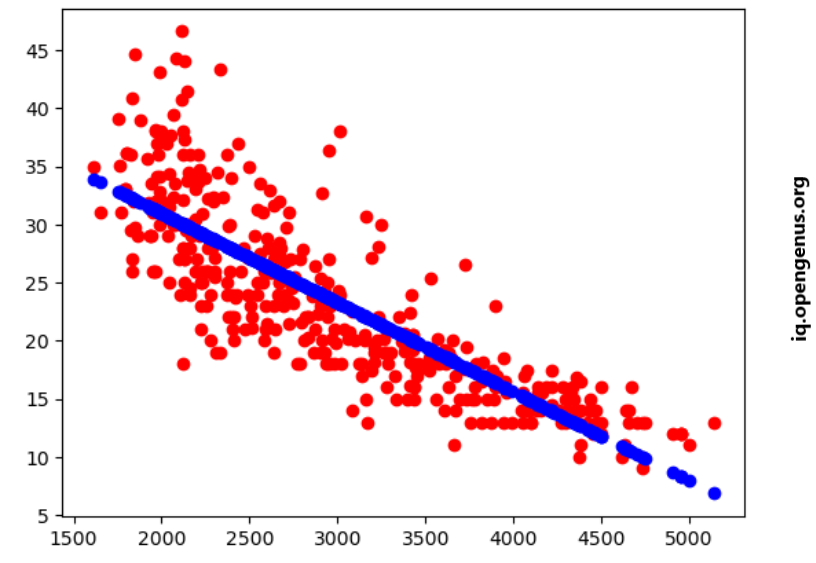
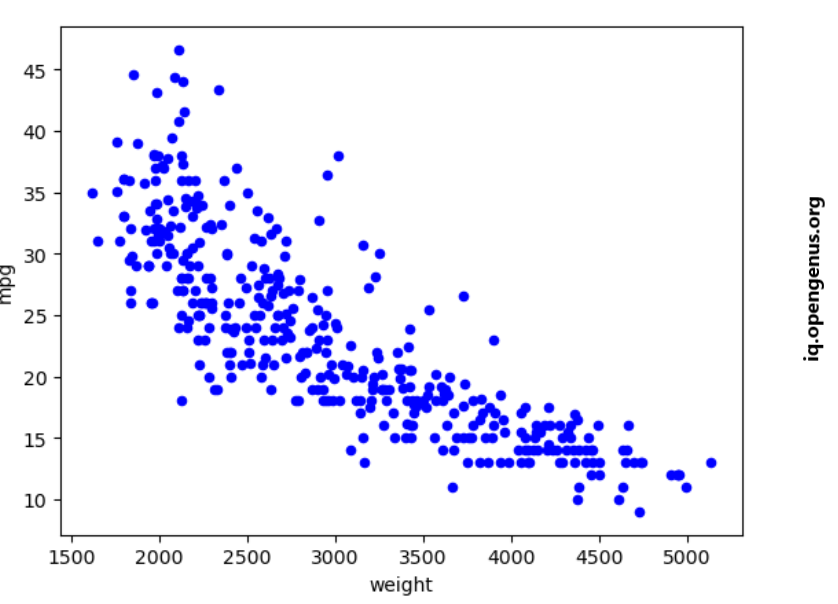
Plotting The Model:
We are ready to visualize the actual fuel efficiency values for each car alongside the predicted fuel efficiency to gain a visual understanding of the model's performance.
plt.scatter(cars['weight'],cars['mpg'],c="red")
plt.scatter(cars['weight'],predictions,c='blue')
plt.show()
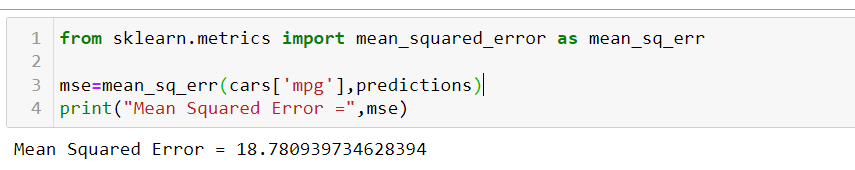
Error Metrics:
- To obtain a more precise quantitative assessment of the model's accuracy, we must calculate its error.
- For this purpose, we will employ the Mean Squared Error function from the scikit-learn library.
from sklearn.metrics import mean_squared_error as mean_sq_err

mse=mean_sq_err(cars['mpg'],predictions)
print("Mean Squared Error =",mse)
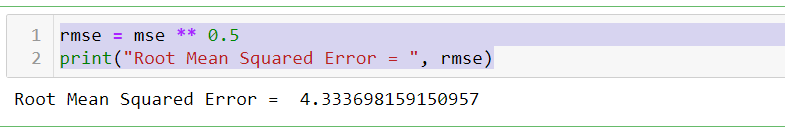
rmse = mse ** 0.5
print("Root Mean Squared Error = ", rmse)
Data Cleaning:
In contrast to the weight column, the horsepower column contains missing values represented as '?'. To prepare our data for modeling, we will exclude rows with these missing values.
filtered_cars = cars[cars["horsepower"] != '?']
filtered_cars['horsepower'] = filtered_cars['horsepower'].astype('float')
Data Exploration:
After cleaning the data, we can plot the correlation between horsepower and mpg.
plt.scatter(cars['weight'],cars['mpg'],c="red")
plt.scatter(cars['weight'],predictions,c='blue')
plt.show()
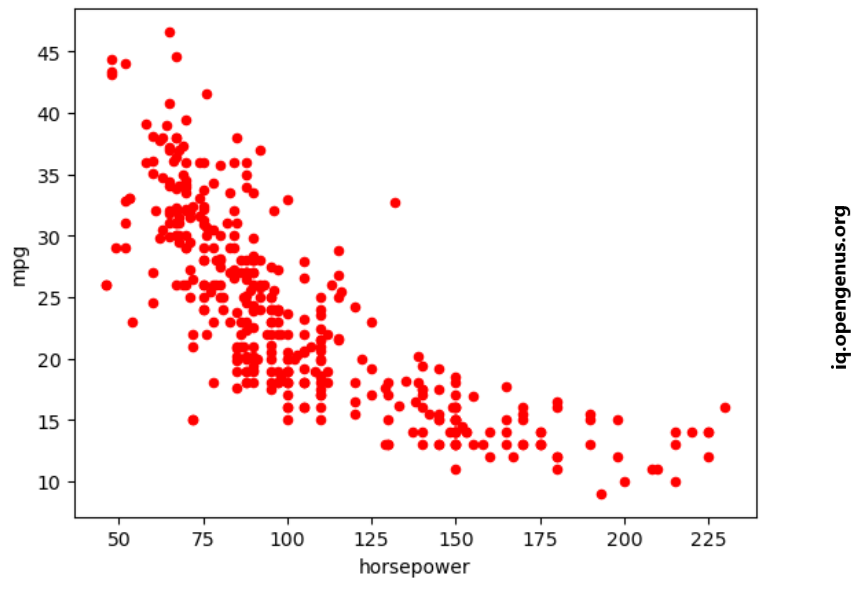
Fitting a Model:
It's difficult to quantify the relationship between mpg and other attributes.
lr = LinearRegression()
lr.fit(filtered_cars[['horsepower']],filtered_cars[['mpg']])
predictions = lr.predict(filtered_cars[['horsepower']])
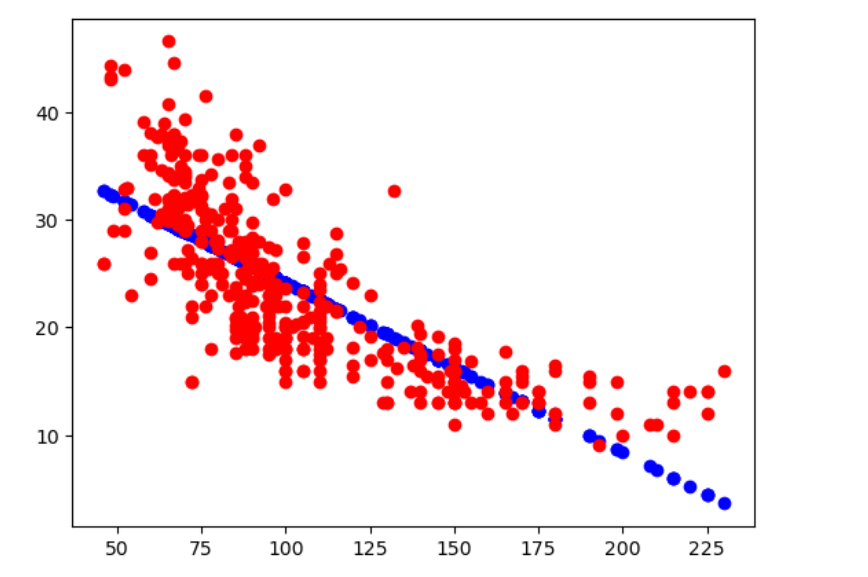
Plotting the Predictions:
Lets plot the predictions vs. the actual values.
plt.scatter(filtered_cars['horsepower'],predictions,c='blue')
plt.scatter(filtered_cars['horsepower'],filtered_cars['mpg'],c='red')
plt.show()
Error Metrics:
That's how we can calculate the error of our model's predictions.
mse = mean_sq_err(predictions, filtered_cars['mpg'])
rmse = mse ** 0.5
print("Mean Square Error =",mse)
print("Root Mean Square Error =",rmse)
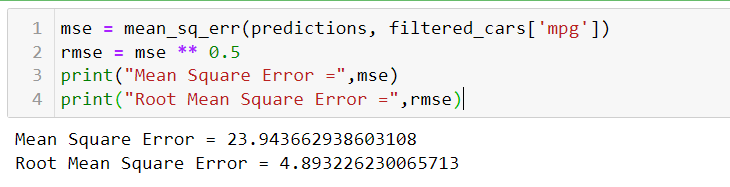
Conclusions:
- After analyzing the MSE and RMSE values for horsepower and weight, it is evident that weight exhibits a significantly stronger correlation with mpg compared to horsepower.
- Therefore, if we are required to choose only one input for our model, weight should unquestionably be the preferred choice.
Deployment (Optional):
- Integration: If applicable, integrate the model into an application, website, or API for real-world use.
- Testing: Conduct thorough testing to ensure the deployed model performs as expected in different scenarios.