
Have you ever come upon situations, outcomes, or events that just seem odd? Or if you've heard of the terms null hypothesis, p-value, and alpha but don’t really know what they mean and how they’re related then you’ve come to the right place! And if you’ve never heard of these terms, I urge you to read through this post as this is an essential topic to understand.
In this post, we will be discussing if we know whether to perform some action or not in those particular situations or events. Will those actions give a positive result or a negative result then we can have an added advantage of doing the right things.
Statistics is a grammar of Science. - Karl Pearson
After Reading this post, you will get an idea about:
- Introduction to Hypothesis Testing
- Construction of Hypothesis
- Significance level
- Computing the test and its P-Value
- ANNOVA
- Chi-Square
- T-Test
- Z-Test
- Concluding the hypothesis
This article assumes that you are interested in the technical know-how of Statistics, Statistical Testing in particular!
Introduction to Hypothesis Testing
Hypothesis testing is a process of using statistics to test the probability for a specific hypothesis to be true. It is used to determine whether there is enough evidence to infer for a certain sample that the certain condition is true for the entire population.
Hypothesis Testing identifies the situation where the action should be taken or not based on what results it will produce.
Hypothesis is an idea that can be tested
Construction of Hypothesis
There are two ways to formulate the hypothesis to test. In a general approach we try to evaluate two mutually exclusive statements(two Hypothesis H0 and H1) on Population using a sample of data.
H0 is called as the Null Hypothesis as it’s our initial assumption while H1 is called as the Alternate Hypothesis.
Null hypothesis (H0)
The Null Hypothesis states that a population parameter is equal to that of a value. These are the observations that are a result of a pure chance and there is no effect relationship or difference between two or more groups. It is an assumption made about the population which needs to be tested and is considered to be true until evidence is found against it.
In short, making an initial assumption on a particular population is Null Hypothesis.
Alternate hypothesis (H1)
A hypothesis that proposes the sample observations are influenced by some non-random cause and there is an effect or difference between two or more groups. It states that the population parameter is different from the value of the population parameter in the null hypothesis. It is the claim you are trying to prove with an experiment. The alternative hypothesis is what you might believe to be true or hope to prove true.
In short, It is the opposite of the assumption made and is accepted when the former is rejected.
A test will remain with the null hypothesis until there is enough evidence (data) to support the alternative hypothesis.
Significance Level
In statistical tests, statistical significance is determined by citing an alpha level (Greek letter α), or the probability of rejecting the null hypothesis when the null hypothesis is true. It is a measure of the strength of the evidence that must be present in your sample before you will reject the null hypothesis and conclude that the effect is statistically significant. The researcher determines the significance level before conducting the experiment.
Setting the significant level α = 0.01 means that there is a 1% chance that you will accept your alternative hypothesis when your null hypothesis is actually true.
For our example, we will set a significant level of α = 0.05.
Computing the Tests and its P-value
Hypothesis tests can be used to evaluate many different parameters of a population. Each test is designed to evaluate a parameter associated with a certain type of data. Knowing the difference between the types of data, and which parameters are associated with each data type, can help you choose the most appropriate test.
What is P-value?
The job of the p-value is to decide whether we should accept our Null Hypothesis or reject it. The lower the p-value, the more surprising the evidence is, the more ridiculous our null hypothesis looks. And when we feel ridiculous about our null hypothesis we simply reject it and accept our Alternate Hypothesis.
If we found the p-value is lower than the predetermined significance value(often called alpha or threshold value) then we reject the null hypothesis. The alpha should always be set before an experiment to avoid bias.
Significance of p-value comes in after performing Statistical tests and when to use which technique is important. So now I will list when to perform which statistical technique for hypothesis testing.
- ANNOVA: To compare three or more samples with a single test.
- Chi-Square: To compare categorical variables.
- T-Test: To compare the mean of two given samples.
- Z-Test: To determine whether two population means are different when the variances are known and the sample size is large.
ANNOVA
ANOVA is a statistical method that stands for analysis of variance and is the extension of the T and the Z test. It is used to compare multiple (three or more) samples with a single test.
It is used when the categorical feature has more than two categories. Before the use of ANOVA, the t-test and z-test were commonly used.
The hypothesis being tested in ANOVA is:
Null: All pairs of samples are same i.e. all sample means are equal and assumes that there is no significant difference between the groups.
Alternate: At least one pair of samples is significantly different and assumes that there is a significant difference between the groups.
Chi-square
Chi-Square test is used when we perform hypothesis testing on two categorical variables from a single population or we can say that to compare categorical variables from a single population. A chi-square statistic is one way to show a relationship between two categorical variables. In statistics, there are two types of variables: numerical (countable) variables and non-numerical (categorical) variables. The chi-squared statistic is a single number that tells you how much difference exists between your observed counts and the counts you would expect if there were no relationship at all in the population. By this we find is there any significant association between the two categorical variables.
In order to decide if your test value is high enough, first state the null hypothesis and the alternate hypothesis. Then generate a chi-square curve for your results along with a p-value.
The hypothesis being tested for chi-square is:
- Null: Variable A and Variable B are independent.
- Alternate: Variable A and Variable B are not independent.
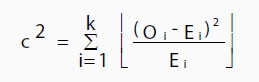
Where O is the observed value, E is the expected value and “i” is the “ith” position in the contingency table.
T-Test
A t-test is a type of inferential statistic used to determine if there is a significant difference between the means of two groups, which may be related in certain features.It is performed on continuous variables.
Calculating a t-test requires three key data values. They include the difference between the mean values from each data set (called the mean difference), the standard deviation of each group, and the number of data values of each group.
To run the t-test for our example, first, we need to import stats from Scipy.
from scipy import stats
# Weich's t-test between discounted & non-discounted group
stats.ttest_ind(non_disc, disc, equal_var=False)
Correlated (or Paired) T-Test
The correlated t-test is performed when the samples typically consist of matched pairs of similar units, or when there are cases of repeated measures.
The formula for computing the t-value and degrees of freedom for a paired t-test is:
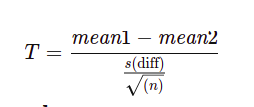
where:
mean1 and mean2=The average values of each of the sample sets
s(diff) = The standard deviation of the differences of the paired data values
n=The sample size (the number of paired differences)
n−1=The degrees of freedom
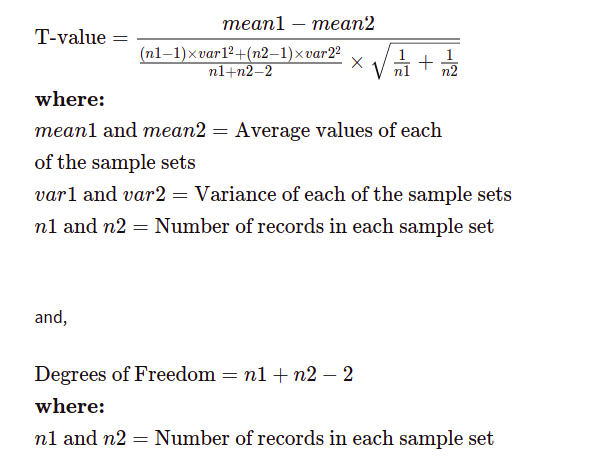
Equal Variance (or Pooled) T-Test
The equal variance t-test is used when the number of samples in each group is the same, or the variance of the two data sets is similar. The following formula is used for calculating t-value and degrees of freedom for equal variance t-test:
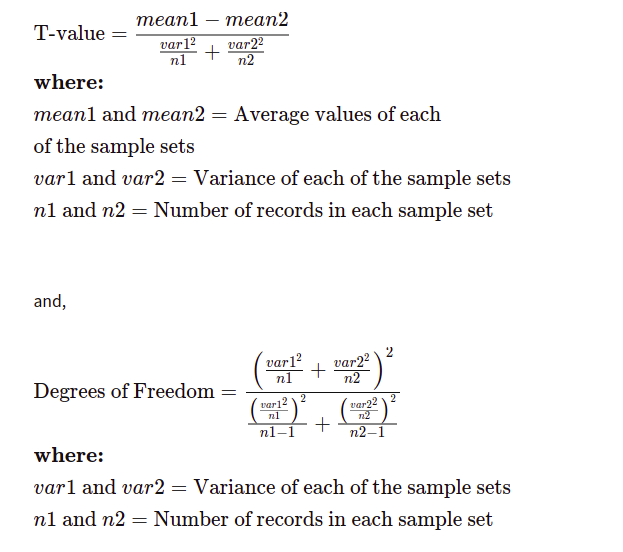
Unequal Variance T-Test
The unequal variance t-test is used when the number of samples in each group is different, and the variance of the two data sets is also different. This test is also called the Welch's t-test. The following formula is used for calculating t-value and degrees of freedom for an unequal variance t-test:
Z-Test
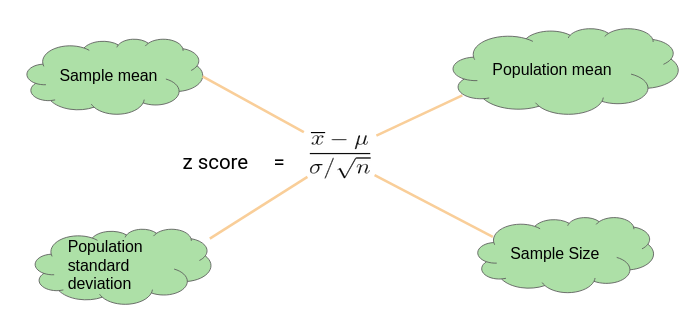
A z-test is a statistical test used to determine whether two population means are different when the variances are known and the sample size is large.
The test statistic is assumed to have a normal distribution, and nuisance parameters such as standard deviation should be known in order for an accurate z-test to be performed.
What's the Difference Between a T-Test and Z-Test?
Z-tests are closely related to t-tests, but t-tests are best performed when an experiment has a small sample size, less than 30. Also, t-tests assume the standard deviation is unknown, while z-tests assume it is known. If the standard deviation of the population is unknown, but the sample size is greater than or equal to 30, then the assumption of the sample variance equaling the population variance is made while using the z-test.
Concluding the Hypothesis
Compare the calculated p-value with the given level of significance α. if the p-value is less than or equal to α, we reject the null hypothesis and if it is greater than α, we fail to reject the null hypothesis.
Decision Errors:
When we decide to reject or fail to reject the null hypothesis, two types of errors might occur.
Type I error: A Type I error occurs when we reject a null hypothesis when it is true. The probability of committing a Type I error is the significance level α.
Type II error: A Type II error occurs when we fail to reject a null hypothesis that is false. The probability of committing a Type II error is called Beta and is often denoted by β. The probability of not committing a Type II error is called the Power of the test.
If you liked the content of this post at OpenGenus, do share it with others!