
In this article, we have covered how to use Console which is one of the development tools in the Chrome browser. The Console in Chrome DevTool helps to debug webpages and investigate external webpage as well.
Table of content:
- How to open Console?
- View log messages + different console methods
- Run JavaScript in Console
We will explore the features by trying them on a sample HTML page.
How to open Console?
To open the Console:
- Use the keyboard shortcut Ctrl + Shift + I or Ctrl + Shift + J.
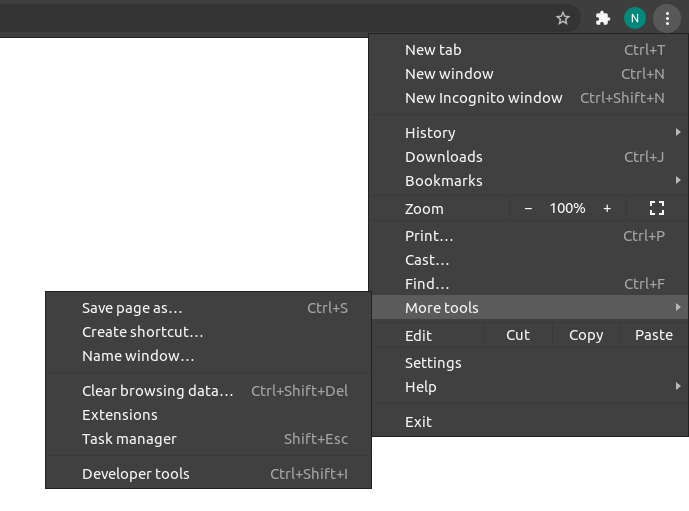
- Or click the Chrome Menu, select the More tools option then click on the Developer tools as shown below.
The main purposes of the Console:
- View log messages that are useful for debugging purposes.
- Run Javascript.
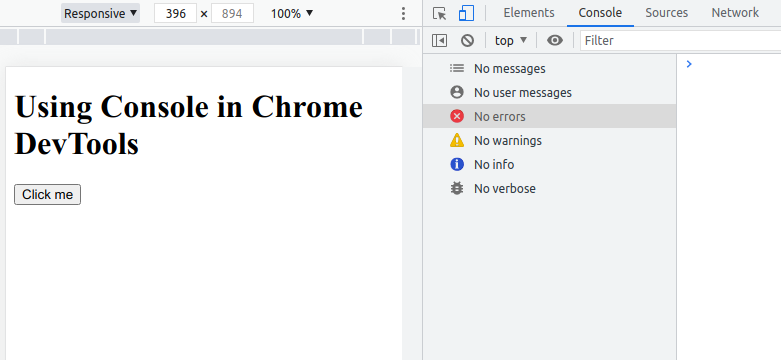
We have used the HTML code below to illustrate how to use the Console:
index.html
<!DOCTYPE html>
<html lang="en">
<head>
    <meta charset="UTF-8">
    <meta http-equiv="X-UA-Compatible" content="IE=edge">
    <meta name="viewport" content="width=device-width, initial-scale=1.0">
    <title>Console in Chrome DevTools</title>
    <link rel="stylesheet" href="main.css">
    <script src="index.js" async></script>
</head>
<body>
    <h1>Using Console in Chrome DevTools</h1>
    <button onclick="viewLog()">Click me</button>
</body>
</html>
View log messages + different console methods
The Console has a messages tab that displays the various types of log messages.
a. Log messages from JavaScript
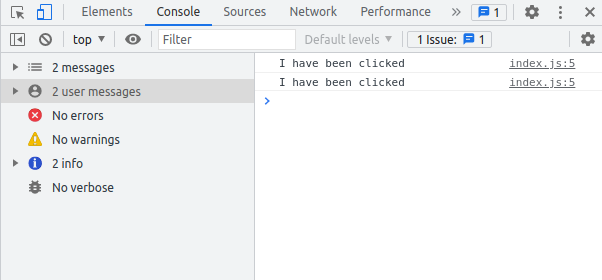
We can view log messages from JavaScript using the methods provided by the Console object. When the button is pressed, the message and the line of code in the JavaScript file that prompted the message appear on the Console.
The methods are:
- console.log
- console.error
- console.warn
- console.table
The following are some of the Console object methods.
- console.log() method displays a message in the console.
index.js
function viewLog() {
  console.log("I have been clicked")
}
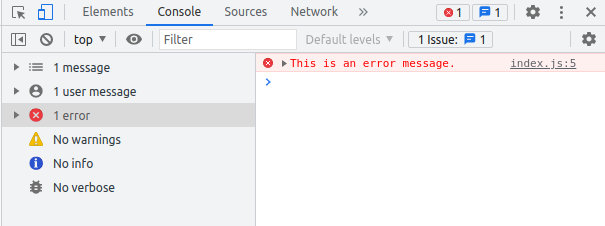
- console.error() method displays an error message.
index.js
function viewLog() {
  console.error("This is an error message.")
}
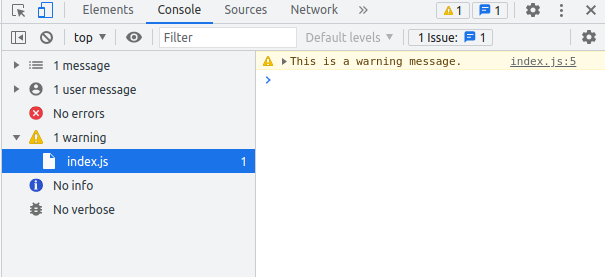
- console.warn() method displays a warning message.
index.js
function viewLog() {
  console.warn("This is a warning message.")
}
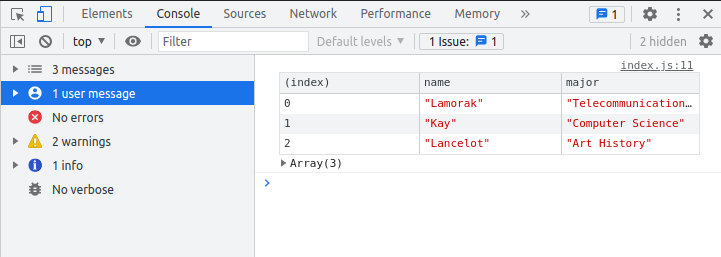
- console.table() method displays tabular data.
index.js
function viewLog() {
  var students = [
    { name: "Lamorak", major: "Telecommunication Engineering" },
    { name: "Kay", major: "Computer Science" },
    { name: "Lancelot", major: "Art History" },
  ]

  console.table(students)
}
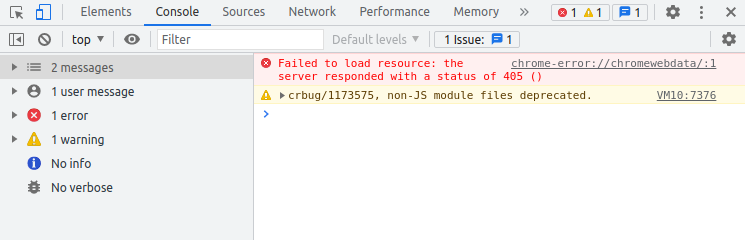
b. Log messages from the browser
We can view log messages from the browser in cases where there is a problem loading the page.
This can be caused by server errors, host errors, internet issues, etc.
Run JavaScript in Console
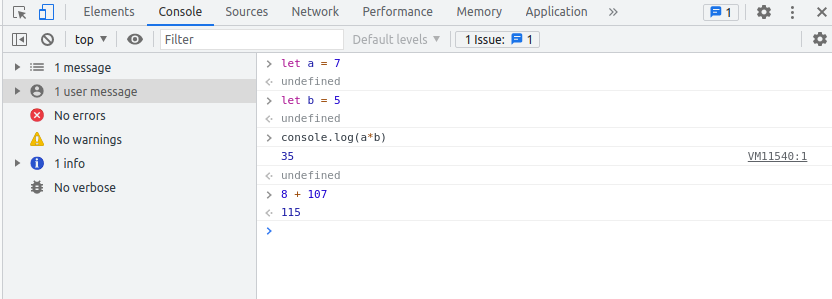
a. We can perform arithmetic operations in the Console.
We can perform arithmetic operations such as addition, multiplication, division, and subtraction on the Console.
Try this code snippet line by line:
let a = 7
let b = 5
console.log(a*b)
Output will be:
35
Try this code snippet as well:
8+107
Output:
115
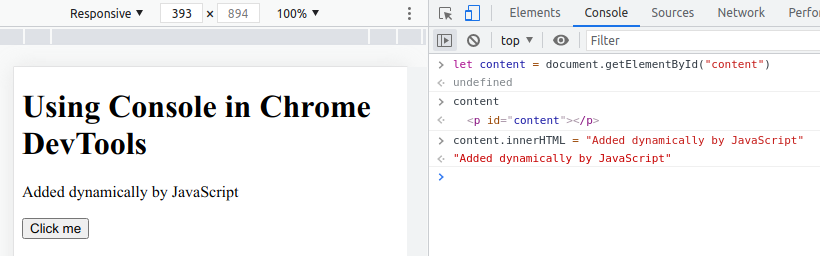
b. We can also use JavaScript in the Console to modify HTML content.
Javascript can also be used to modify HTML content and HTML styles such as color, fonts, etc.
Try this code snippet on the console:
let content = document.getElementById("content")
Output:
undefined
Try this where we print the content of variable "content":
content
Output:
<p id="content"></p>
Try this now where we add text in the p tag:
content.innetHTML = "Added dynamically by JavaScript"
Output:
"Added dynamically by JavaScript"
With this article at OpenGenus, you must have a strong idea of how to use Console in Chrome DevTool for various debugging of web pages.