
In this article, we have developed a Python script to get CPU and RAM Usage on a system using psutil library. We extend it to get CPU and RAM usage for each process and for each core.
Table of contents
Following is the list of what we will achieve in this article:
- Introduction to
psutillibrary in python, - Print overall CPU usage using
psutil, - Print overall RAM usage using
psutil, - Get resource usage for each individual process,
- Get CPU usage for each individual
core.
Introduction to psutil
psutil is a library in python that allows for a developer to view the resource usage for a computer system. It provides a number of different functions and classes to make the task of analyzing the resource usage of a system easier.
Installation
To install the psutil library, we first need to python3 along with python3-pip to install and use python packages.
Windows
Installation of python is fairly easy on Windows. Python installation is available from Microsoft Store. If you want to have a custom installation you can follow this link.
Linux
On Linux you can use one of the package manager to install both python and python-pip separately.
On Debian/Ubuntu run:
sudo apt update && sudo apt install python3 python3-pip
On Arch and derivatives run:
sudo pacman -Syu python python-pip
You can refer to your respective Operating System's documentation for further details.
Once both python3 and python3-pip are installed we can now start working on our script. First we will create a new virtual environment. This is to make sure that the dependencies we install for our script do not conflict with the globally installed dependencies.
First we will create a new project directory for our project
- On
Linuxbased systems:
mkdir ./system-resource-viewer && cd ./system-resource-viewer
- On Windows
PowerShell:
New-Item -Type Directory -Path .\system-resource-viewer
Set-Location .\system-resource-viewer
Now we will create our new virtual environment:
python -m venv virtualenv
To activate your new virtual environment use one of the following commands, depending on your shell,
-
PowerShell:
.\virtualenv\bin\Activate.ps1 -
Bash:
./virtualenv/bin/activate -
Fish:
./virtualenv/bin/activate.fish
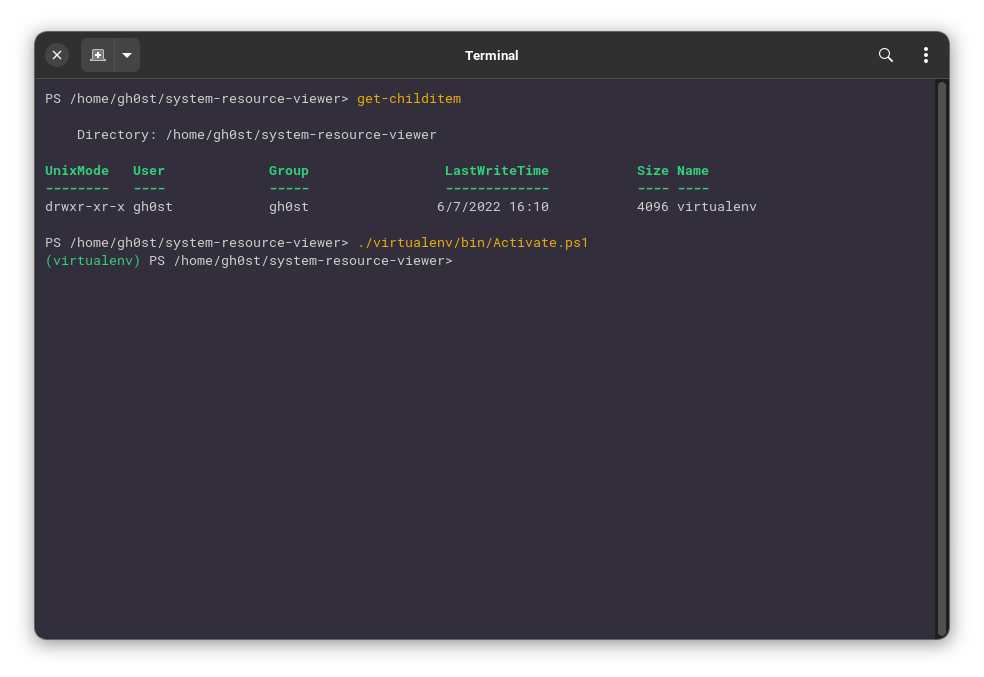
Once the virtual environment has been activated, your prompt will be suffixed by the name of virtual environment, in our case it is virtualenv. Your prompt should have the suffix like so:
To deactivate the virtual environment we can now simply run the command deactivate and you shall see that the (virtualenv) suffix would have been removed. For now let us come back to our newly created virtual environment.
Now to install psutil we will be using pip. pip is a python package manager which makes installing python libraries and packages easier. To install psutil run the following command.
pip install psutil
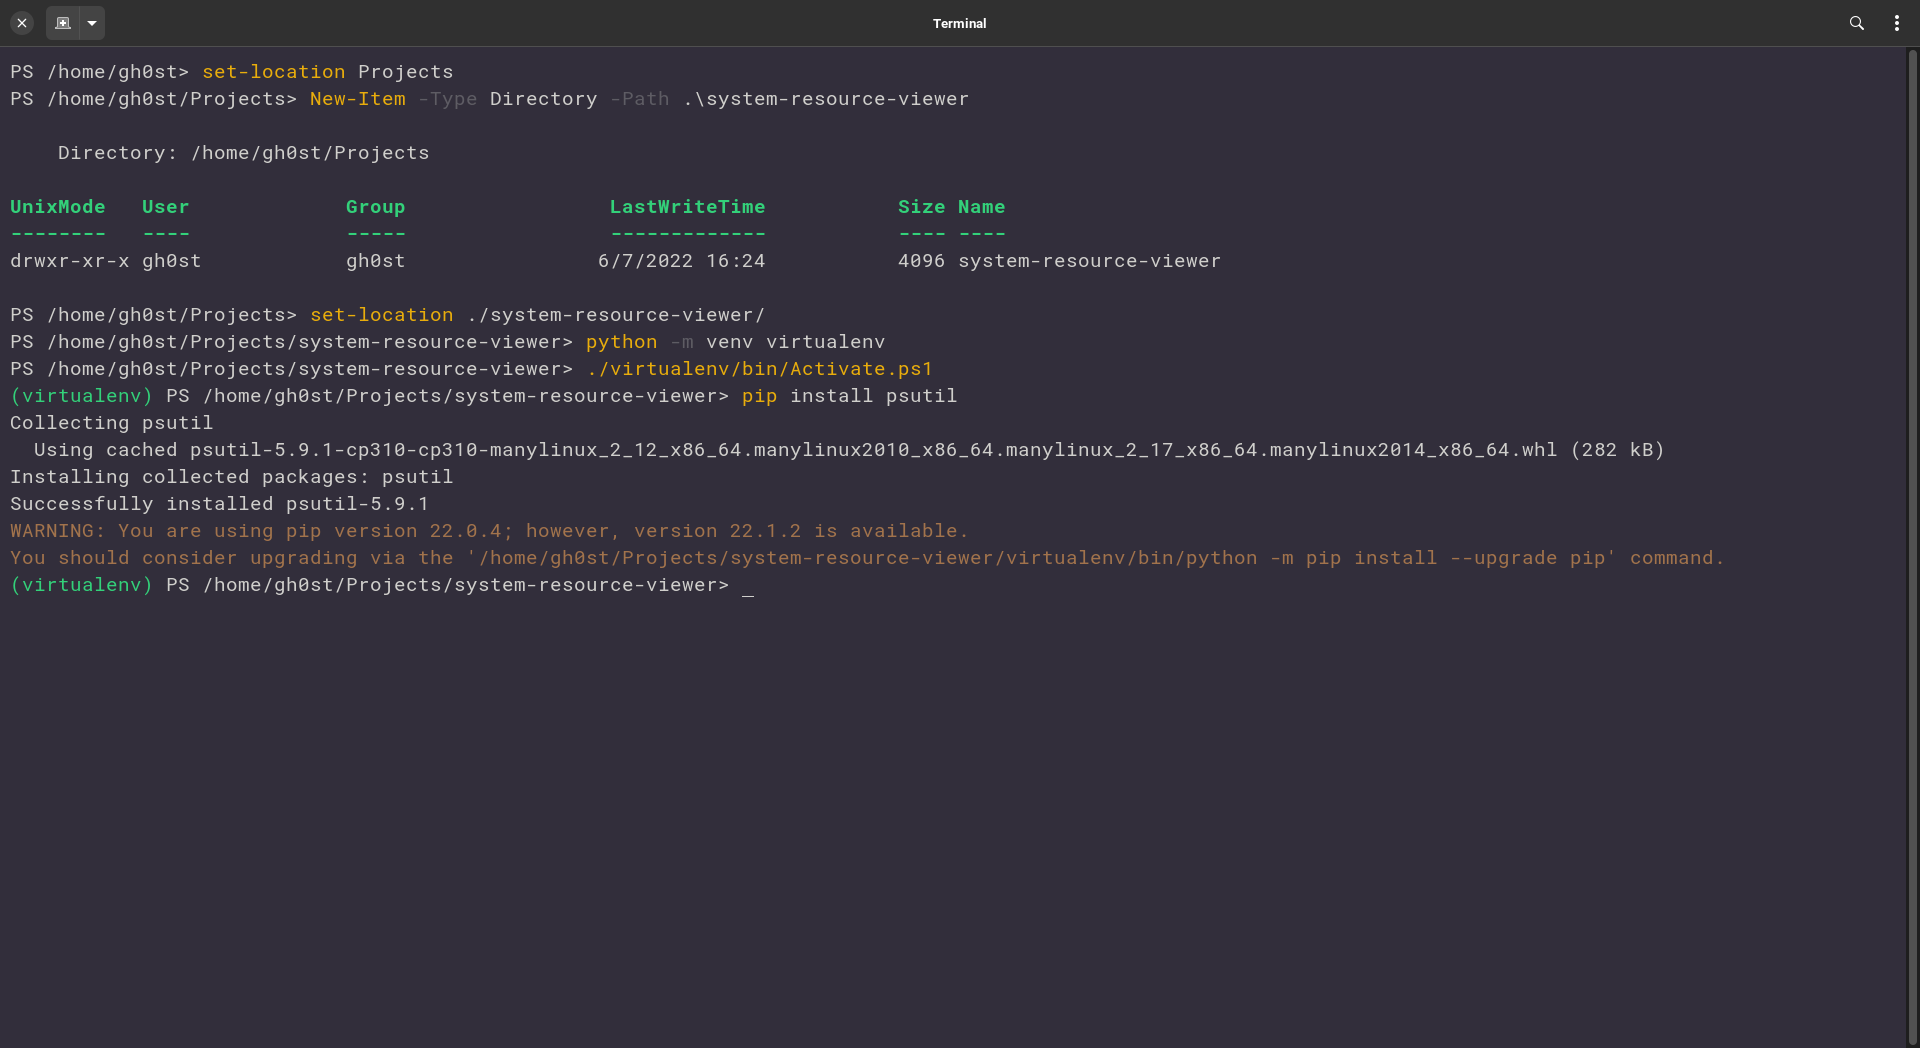
This should be the expected output,
Once psutil has been installed we will create a new file, use your favorite text editor. I will be using VS Codium an open source build of VS Code without the telemetry.
First we will start by importing the newly installed psutil module, like so:
import psutil
To list the total usage of the processor at the moment we will use the cpu_percent function like so:
psutil.cpu_percent(interval=1)
What we have done here is that we called the cpu_percent function from the psutil module, with an optional argument interval=1 which tells the function to "block" for 1 second. This allows for a more accurate result. If you run the function without this optional argument, it will still return the value (quicker than with the interval) but will be more inaccurate.
To get the individual core usage, we can use the following the same function with the percpu optional argument set to True, like so:
per_cpu = psutil.cpu_percent(percpu=True)
# For individual core usage with blocking, psutil.cpu_percent(interval=1, percpu=True)
for idx, usage in enumerate(per_cpu):
    print(f"CORE_{idx+1}: {usage}%")
This is the output when run on my system,
CORE_1: 6.1%
CORE_2: 8.9%
CORE_3: 1.0%
CORE_4: 11.9%
CORE_5: 3.0%
CORE_6: 5.1%
CORE_7: 34.0%
CORE_8: 2.9%
Note: The number of cores may vary for your system depending on what processor you may have installed on your system
To get the overall RAM usage, we will be using another function named virtual_memory, It returns a NamedTuple, we can call the function like so
mem_usage = psutil.virtual_memory()
To get complete details of your systems memory you can run the following code,
import psutil

mem_usage = psutil.virtual_memory()

print(f"Free: {mem_usage.percent}%")
print(f"Total: {mem_usage.total/(1024**3):.2f}G")
print(f"Used: {mem_usage.used/(1024**3):.2f}G")
This should create the following output,
Free: 62.8%
Total: 11.51G
Used: 5.81G
Now we have learned to use psutil to display the overall system usage. but what about each individual process? Turns out, psutil can provide us with the ability to view processes, individually, using their PID(s) or "Process IDs". Let us try it out,
First we will get the pid of our python instance, next, we will try listing the properties for this instance. To get the pid of our running python instance we need to use another library named os. Luckily, this one comes pre-installed with python. So, we can immediately start working. Let us start by importing the required function from the library,
from os import getpid
The function getpid will return us the pid of our current python instance. We can use this pid to get the properties of our process.
my_process = psutil.Process(getpid())
print("Name:", my_process.name())
print("PID:", my_process.pid)
print("Executable:", my_process.exe())
print("CPU%:", my_process.cpu_percent(interval=1))
print("MEM%:", my_process.memory_percent())
This should create an output similar to this one,
Name: python3
PID: 7932
Executable: /usr/bin/python3.10
CPU%: 0.0
MEM%: 0.09907581155184199
The output may change every time we run the program, because no processes on our system use a fixed amount of system resources.
We have learned that we can get the system utilization of each individual process, but how do we get the process properties of all process currently running in our system?
To answer this we will use the psutil.pids() method. As the name suggests this function returns us with a list of pids of the currently active processes.
For example, the following script should return us with the name of the currently running processes on our system,
for pid in psutil.pids():
    print(psutil.Process(pid).name())
Since the output of this code will be quite large, I can only show a chunk of it for our demonstration,
systemd
gnome-session
dbus-daemon
pulesaudio
gjs
dconf-service
...
Let us try getting the properties of our processes, for that we will use the following script,
for process in [psutil.Process(pid) for pid in psutil.pids()]:
    print('Name:', process.name())
    print('CPU%:', process.cpu_percent(interval=0.5))
    print('MEM%:', process.memory_percent())
We will get an output similar to this one,
--------------------------
Name: pipewire
CPU%: 0.0
MEM%: 0.05258639228520845
--------------------------
Name: firefox
CPU%: 0.0
MEM%: 4.53346393226263
--------------------------
Name: Xwayland
CPU%: 2.0
MEM%: 0.7896242773513026
--------------------------
Name: gsd-xsettings
CPU%: 0.0
MEM%: 0.567051626450392
--------------------------
But then out of the blue, we face this error,
Traceback (most recent call last):
  File "Projects/system-resource-viewer/system-resource-viewer.py", line 7, in <module>
    print("Name:", process.name())
  File "Projects/system-resource-viewer/virtualenv/lib/python3.10/site-packages/psutil/__init__.py", line 621, in name
    name = self._proc.name()
  File "Projects/system-resource-viewer/virtualenv/lib/python3.10/site-packages/psutil/_pslinux.py", line 1642, in wrapper
    return fun(self, *args, **kwargs)
  File "Projects/system-resource-viewer/virtualenv/lib/python3.10/site-packages/psutil/_pslinux.py", line 1735, in name
    name = self._parse_stat_file()['name']
  File "Projects/system-resource-viewer/virtualenv/lib/python3.10/site-packages/psutil/_pslinux.py", line 1649, in wrapper
    raise NoSuchProcess(self.pid, self._name)
psutil.NoSuchProcess: process no longer exists (pid=10055)
This occurred because one of the process generated in the above list [psutil.Process(pid) for pid in psutil.pids()] was terminated before we got to look at it. To prevent this we first need to verify that the process pid is valid when we are trying to lookup the process properties. We can use the following function psutil.pid_exits(), this would allow us to get the valid processes in the above created list, and then hopefully not face this issue. Also we can print the process memory used by the process before we print its CPU utilization, so that its blocking interval may not effect our outcome.Our new script should appear like this
from os import get_terminal_size

import psutil

for process in [psutil.Process(pid) for pid in psutil.pids()]:
    if psutil.pid_exists(process.pid):
        print("Name:", process.name())
        print("MEM%:", process.memory_percent())
        print("CPU%:", process.cpu_percent(interval=0.5))
        print("-" * get_terminal_size().lines)
Now we can test it and see that it will not raise any error most of the time.
We always need to make sure that the process we are checking does exist, Even after checking whether a process exists or not, chances may be that the process may terminate before we reach any one of the above print statements, that, unfortunately cannot be prevented, thus we need to handle this situation by using a try catch block, to prevent partial display of the process's properties we will store the variable data into some variables, if an error is raised, we would not have to print the valid properties, like the pid, and can move on.
Our new script can now take this form,
# Imports

for process in [psutil.Process(pid) for pid in psutil.pids()]:
    try:
        name = process.name()
        mem = process.memory_percent()
        cpu = process.cpu_percent(interval=0.5)
    except psutil.NoSuchProcess as e:
        print(e.pid, "killed before analysis")
    else:
        print("Name:", name)
        print("CPU%:", cpu)
        print("MEM%:", mem)
    print("-" * get_terminal_size().lines)
And our output will be similar to this,
12586 killed before analysis
--------------------------
Name: kworker/6:2-events_freezable
CPU%: 0.0
MEM%: 0.0
--------------------------
12601 killed before analysis
--------------------------
Name: kworker/7:0-events
CPU%: 0.0
MEM%: 0.0
--------------------------
12777 killed before analysis
--------------------------
Name: kworker/3:2-mm_percpu_wq
CPU%: 2.0
MEM%: 0.0
--------------------------
Now we will know which process has been terminated and created a fluid script that prints the properties of all the processes.
Closing notes
psutil provides the developer with extreme flexibility and ability to view and monitor system resources, and, processes. It allows for many more functionalities, like killing a process, sending signals to processes, which were not discussed in this article at OpenGenus.