
F-tests get their name from the F test statistic, which was named after Sir Ronald Fisher. The F-statistic is just a two-variance ratio. Variances are a metric for dispersion, or how far the data deviates from the mean. Greater dispersion is shown by higher values.
The square of the standard deviation is the variance. Because standard deviations are in the same units as the data rather than squared units, standard deviations are easier for us to understand than variances. Many analyses, however, do include variances in their computations. The ratio of mean squares is used to calculate F-statistics. The term "mean squares" may be perplexing, but it merely refers to a population variance estimate that takes into account the degrees of freedom (DF) utilized in the calculation.
Despite the fact that F-tests are a ratio of variances, they can be used in a wide range of scenarios. The F-test, unsurprisingly, may be used to determine variance equality. The F-test, on the other hand, becomes an extremely flexible test when the variances included in the ratio are changed. F-statistics and F-tests can be used to assess the overall significance of a regression model, compare the fits of multiple models, test individual regression terms, and test equality of means, among other things.
On the basis of the F statistic, the researcher performs an F-test. The F statistic is equal to the ratio of two independent chi square variates divided by their respective degrees of freedom. The F-test follows the F-distribution of Snedecor.
Some statistical theory applications are included in the F-test. The applications will be described in full in this document.
When to Use F-Test
A researcher use the F-test to do a test for the equivalence of the two population variances. The F-test is used when a researcher wishes to see if two independent samples chosen from a normal population with the same variability are comparable.
F Statistic Table
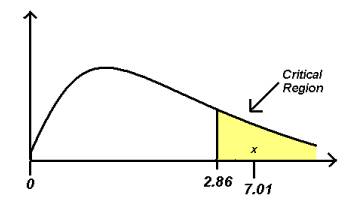
The F Table is a set of tables that calculates the likelihood of a given alpha level. The F Table is actually a set of tables for four different alpha levels:.10,.5,.025, and.01. Always put the numerator degrees of freedom first when using the F dist. table; if you switch the numerator and denominator around, you'll receive a different result. The area in the right tail is shown in the table.
Instead of using a table, you can use a calculator to get more precise results.
What is the purpose of the F Statistic Table?
You can compare the F value to a f crucial value in the table once you've identified it. If the observed value of F is greater than the value in the F table, you can reject the null hypothesis with 95% confidence, indicating that the variation between your two populations is not attributable to chance. The F Statistic Table is made up of several tables. Which table you use will be determined by the alpha level you select. If your alpha level is.05, for example, your right tail region is.05 (5%), and you'll seek for the f crucial value in the alpha level =.05 table.
The denominator degrees of freedom are represented by the rows in the F Distribution Table, while the numerator degrees of freedom are represented by the columns.
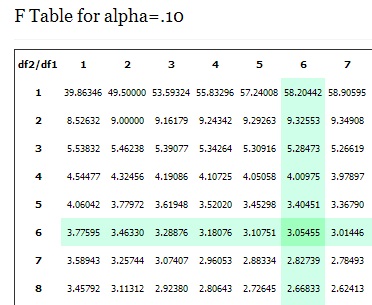
Look for alpha=.10 in the 6 column (numerator) and 6 row (denominator) of the F Table to find the.10 f critical value for a F distribution with 6 and 6 degrees of freedom. F(.10, 6, 6) = 3.05455.
Step by Step Calculation of an F-test
The F-Test formula is used to test the null hypothesis that the variances of two populations are identical in the steps below:
-
Begin by defining the null and alternate hypotheses.
The null hypothesis is based on the assumption that the variances are equal.H0: σ1^2 = σ2^2. The alternate hypothesis states that the variances are unequal. H1: σ1^2 ≠ σ2^2. The symbols representing variations are σ1^2 and σ2^2. -
Determine the test statistic.
(F distribution) in other words, = σ1^2 / σ2^2 Where the bigger sample variance is assumed to be σ1^2 and the smaller sample variance is expected to be σ2^2. -
Determine how many degrees of freedom there are.
Where n1 and n2 are the sample sizes, degree of freedom (df1) = n1 – 1 and degree of freedom (df2) = n2 – 1. -
In the F table, look at the F value.
When it comes to two-tailed tests, Divide the alpha by 2 to determine the correct critical value for two-tailed tests.The F value is thus determined by examining the degrees of freedom in the numerator and denominator of the F table. In the top row, Df1 is read across.The first column of Df2 is read down.
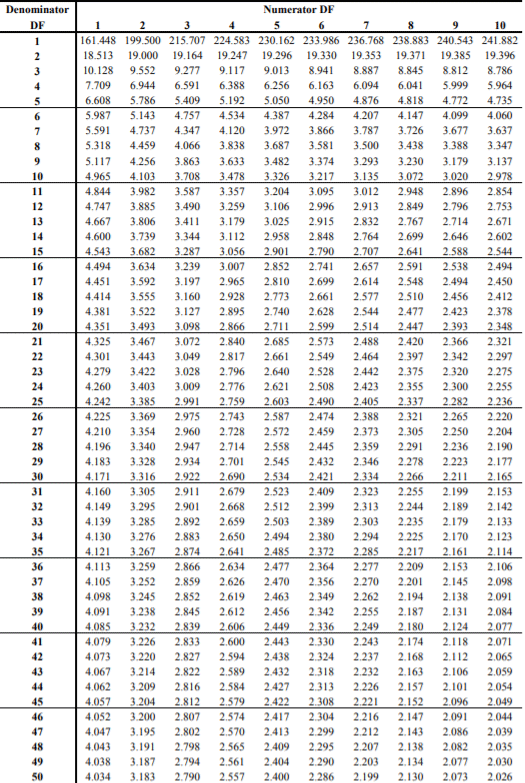
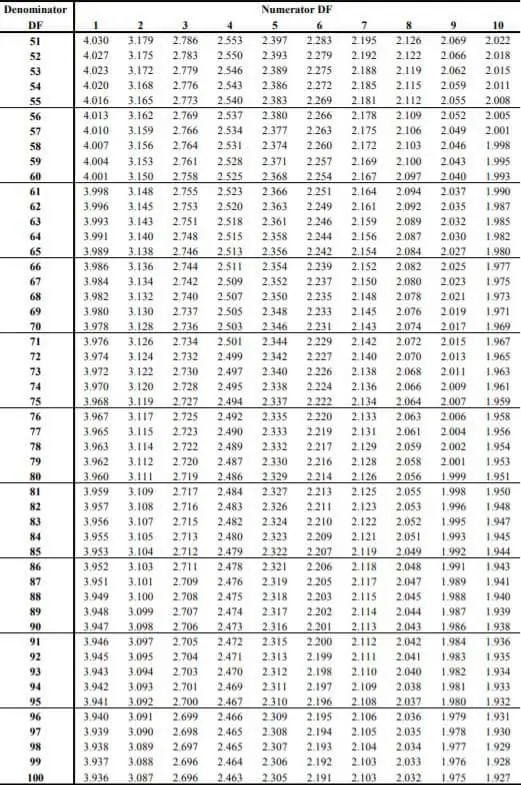
Note that several F Tables exist for various degrees of significance. The F table for alpha =.050 is shown above.
Compare the critical value obtained in Step 4 with the F statistic acquired in Step 2. We reject the null hypothesis if the F statistic is greater than the crucial value at the required level of significance. We cannot reject the null hypothesis if the F statistic produced in Step 2 is smaller than the crucial value at the requisite level of significance.
Assumptions
For the test, several assumptions are made. To use the test, your population must be roughly regularly distributed (i.e., fit the shape of a bell curve).Furthermore, the samples must be unrelated to one another.In addition, there are a few key considerations to keep in mind:
To force the test into a right-tailed test, the larger variance should always go in the numerator (top number). It's easier to calculate right-tailed tests. Divide alpha by 2 before determining the correct critical value for two-tailed tests.
If you're given standard deviations, you'll need to square them in order to get variances.Use the bigger critical value if your degrees of freedom aren't included in the F Table. Type I errors are less likely as a result of this.
F-Test in Python
For this we are going to conduct a two-tailed F-test with a level of significance of 10%. The approach to performing an F-Test in the Python programming language will be discussed. The scipy stats.f() function in Python with the appropriate parameters to obtain the F- test for the given data.
scipy stats.f(): This function returns a F continuous random variable with a standard format and several shape parameters to complete its specification.
We'll use data from a normalized distributed sample with varying variance values, and we'll use the scipy.stats.f.cdf() function to get the data's F-test in the Python computer language.
import numpy as np
import scipy.stats

x = [19, 23, 25, 27, 29, 41, 45, 61, 55, 67]
y = [14, 18, 15, 17, 37, 22, 25, 25, 27, 28]

#define F-test function
def f_test(x, y):
    x = np.array(x)
    y = np.array(y)
    f = np.var(x, ddof=1)/np.var(y, ddof=1) #calculate F test statistic
    dfn = x.size-1 #define degrees of freedom numerator
    dfd = y.size-1 #define degrees of freedom denominator
    p = 1-scipy.stats.f.cdf(f, dfn, dfd) #find p-value of F test statistic
    return f, p

#perform F-test
f_test(x, y)
(5.889282550930027, 0.007215366057381711)
Since it is a two-tailed test, alpha level = 0.10/2 = 0.050. The p-value for the F test statistic is 0.007215366057381711, and the F test statistic is 5.889282550930027. We would reject the null hypothesis because the p-value is less than 0.05. This indicates that we have enough evidence to conclude that the two population variances are not equal.