
In this article, we will be writing a Python Script to get currency exchange rates from an API and plotting graphs of exchange rates with respect to Time.
Table of content:-
- Problem Statement
- Implementation
a. Api's
b. API used and setup
c. Libraries used
d. Script
e. Plot graph - Conclusion
Problem Statement:
Sometimes we need to analyze the stock and exchange rates over a dataset to get proper insights of data for trading or other needs. so today we are going to write a python script to plot a graph of time vs exchange rates.we are choosing python, as Python is the topmost language to perform such kind of works.
Requirements:
- Exchange rate API
- Requests library to make web requests
- JSON extractor library
- Pandas for forming dataframes
- Matplotlib to plot graphs
Implementation:
API:
To carry out the task we need an api to get dataset of exchange rates. There are many api servers which does the same, few of them are free and others are paid.
List of API's:
api.exchangerate.host(FREE)api.exchangeratesapi.io(FREE/PAID)currencyapi.com(FREE/PAID)polygon.io(FREE/PAID)
For this task we are going to use api.exchangerate.host because it is FREE and Time-series(a version of data which involves dataset between any two target dates.) is also free.
In other API's Time-series dataset is paid.
Request Library:
Request is a python library which sends and receives , requests and responses respectively of servers. Here we are using it to send request for desired data to the api.
# here https://api.exchangerate.host/ is the host
# timeseries is one of the stamps for data type
# timeseries fetch all data set in between the mentioned dates

url = 'https://api.exchangerate.host/timeseries?base={0}&start_date={1}&end_date={2}&symbols={3}'.format(base,start_date,end_date,out_curr)
response = requests.get(url)

#we are using http get method by request to fetch url
In above code url is the formatted string of api request url.
Script:
First of all we are going to use request library to fetch the data then we need JSON libraray for response data parsing.
#import libraries to handle request to api
import requests
import json
import pprint
# base currency or reference currency
base="USD"

# required currency for plot
out_curr="INR"

# exchange data from a date
start_date="2021-01-01"

# exchange data till a date
end_date="2021-03-04"

# api url for request
url = 'https://api.exchangerate.host/timeseries?base={0}&start_date={1}&end_date={2}&symbols={3}'.format(base,start_date,end_date,out_curr)
response = requests.get(url)

# retrive response in json format
data = response.json()

pprint.pprint(data["rates"])
Output:
> {'2021-01-01': {'INR': 73.092243},
> '2021-01-02': {'INR': 73.092239},
> '2021-01-03': {'INR': 73.086997},
>  ................................
> '2021-03-02': {'INR': 73.278633},
> '2021-03-03': {'INR': 73.025504},
> '2021-03-04': {'INR': 73.06728}}
In Url we have 4 parameters:
- base-> it takes the base currency for exchange. eg.INR,EUR,USD.
- start_date-> data from this date.
- end_date-> data till mentioned date.
- symbols-> here we put the required currency string one or many.
After requesting the date to api we will store the response data in json format using JSON parser.
As we can see in the above print statement the response have a lot of auxilary data than we need. hence we are going to extract datas and their corresponding data from the response.
# create an empty array to store date and exchange rates
rates=[]
# extract dates and rates from each item of dictionary or json in the above created list
for i,j in data["rates"].items():
      rates.append([i,j[out_curr]])
print(rates)
Output:
>[['2021-01-01', 73.092243], ['2021-01-02', 73.092239], ['2021-01-03', 73.086997],
>...............................................................
>['2021-03-02', 73.278633], ['2021-03-03', 73.025504], ['2021-03-04', 73.06728]]
In the above Script we have extracted the required data in 2d array.
Now we are going to make a Dataframe form the above data.
# create an data frame
import pandas as pd
df=pd.DataFrame(rates)
# define column names explicitely
df.columns=["date","rate"]
df
Output:
>   date	      rate
> 0	2021-01-01	73.092243
> 1	2021-01-02	73.092239
> 2	2021-01-03	73.086997
> 3	2021-01-04	73.085430
> 4	2021-01-05	73.141760
> ...	...	...
> 58	2021-02-28	73.693804
> 59	2021-03-01	73.313893
> 60	2021-03-02	73.278633
> 61	2021-03-03	73.025504
> 62	2021-03-04	73.067280
>    63 rows × 2 columns
The output is perfect as we needed.
Now let us get to the final part were we are going to plot the graph from the above extracted data.
import matplotlib.pyplot as plt

# Put dates on the x-axis
x = df['date']
# Put exchange rates on the y-axis
y = df['rate']
# Specify the width and height of a figure in unit inches
fig = plt.figure(figsize=(15,6))
# Rotate the date ticks on the x-axis by degrees
plt.xticks(rotation=90)
# Set title on the axis
plt.xlabel('Date', fontsize=12)
plt.ylabel('Exchange Rates', fontsize=12)
# Plot the data
plt.plot(x,y)
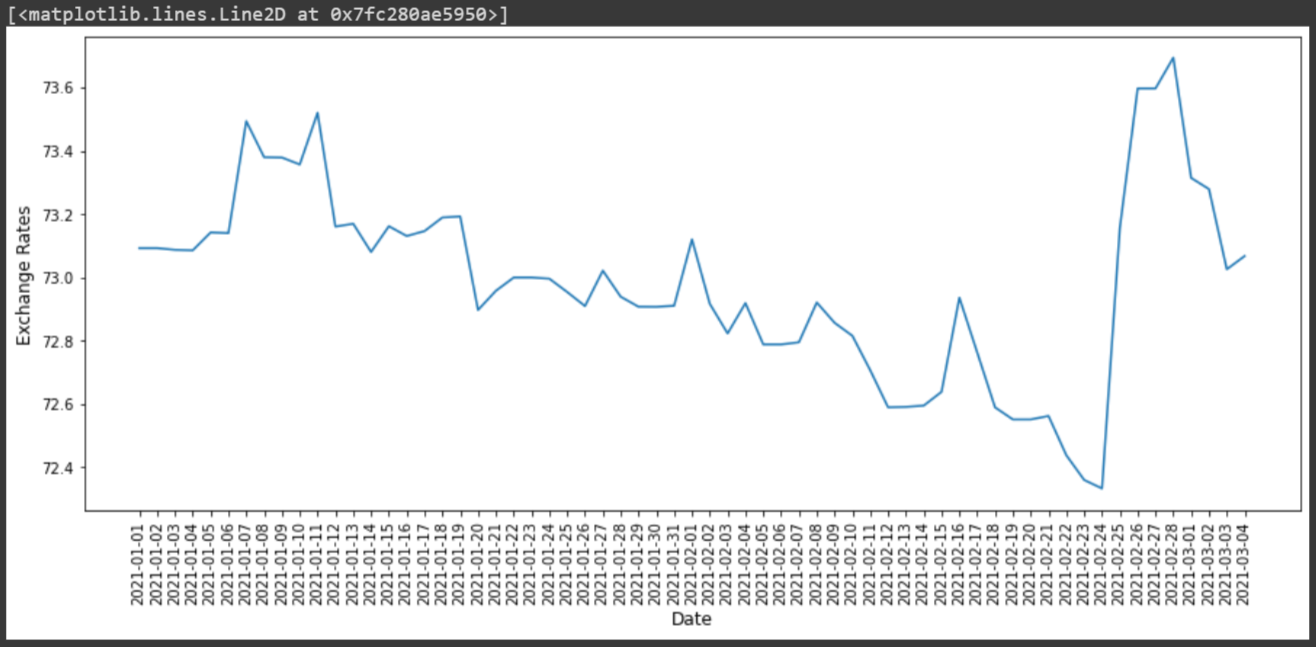
Conclusion:
The above task is the very basic function that we have implemented. There are a lot more we can do with this data. we can get a good insight for trading using these tools (mentioned in this OpenGenus article).