
Get this book -> Problems on Array: For Interviews and Competitive Programming
In this article, we will get the basic idea of what is data analysis and look into some tools that are used for data analysis.
Table of contents
- What is Data analysis?
- Tools used for data analysis
What is Data analysis?
Data analysis is the process of collection, organization, transformation and modeling of data to draw conclusions, make predictions and also make informed decisions. A simple example of this is when we buy a new phone. We do so much research on the brands, models, the features, compare prices of different variants before we finally settle upon the phone that we are going to buy. We also consider our past experiences with some brands before making a decision. This is nothing but analyzing extensively before making a decision. So, this is nothing but a form of data analysis.
There are various steps in the process of data analysis and there are different ways in which companies put them. In Google, the data analysis process is broken down into 6 phases. They are:
- Ask: This first phase is about asking the right questions, defining the problem and communicating with the stakeholders to understand the business problem more and also their expectations.
- Prepare: This is where analysts collect the required data for their upcoming analysis either by surveys, pulling up the company's internal data, getting second-party data or making use of the open datasets available.
3.Process: Here, the analyst cleans the data by eliminating any errors or inaccuracies in the data, getting rid of the outliers, transforms it into a more useful format and then verifies the data.
4.Analyze: This is the phase where suitable tools are used to organize the data so that useful insights and conclusions can be drawn or predictions can be made from them.
5.Share: This is where the analysts share the results of the analysis with their stakeholders. Visualizations in forms of graphs are used for the effective communication of the findings and help others understand what story the data is telling.
6.Act:This is the exciting moment when the business takes all of the insights the data analyst, have provided and puts them to work in order to solve the original business problem.
Tools used for data analysis
The main usage of tools is during the 'analyze' phase of the analysis process. While there are a wide range of tools available, let us look into some popularly used tools such as:
- Spreadsheets
- SQL
- Python
- Tableau
- R
Spreadsheets
They are excellent tools for organizing data in a format that is easy to understand. In spreadsheets, the data is structured in the row and column format and each cell contains a piece of data.
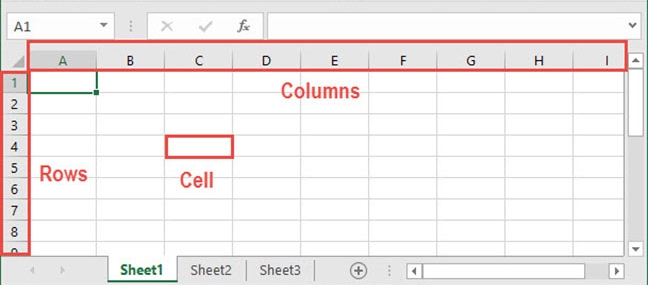
The two widely used spreadsheets are Microsoft Excel and Google sheets.
Spreadsheets allow us to perform a variety if tasks on the data and also has a lot of in-built functions and menu options that makes it more user friendly. It can also be used to convert the data into charts and other visualizations. Excel allows us to understand our data through summaries, visuals and patterns. It is a great tool for data analysis and is one of the most basic and important one that a data analyst should know.
The only limitation is that a spreadsheet cannot hold huge amounts of data like a database.
SQL
SQL (pronounced as 'sequel') stands for Structured Query Language. It is a computer language used to retrieve and manipulate data from a database where huge amounts of data are stored. Unlike spreadsheets, we cannot visualize data using SQL. It allows us perform many operations on the data - sorting, filtering and type casting to name a few.
A basic SQL query contains 3 clauses: SELECT, FROM and WHERE
SELECT column1, column2, ...
FROM table_name
WHERE condition;
In the SELECT clause, we specify the columns of the table we need and in FROM, we specify the table's name from which we need to pull data and in the WHERE clause, we mention any condition that we need the data to satisfy. We can skip this WHERE clause if we do not have any conditions to specify and need all the data.
Python
Python is the most popular programming language that everyone is aware of. Python offers a variety of packages that makes the process of data analysis easier. Another reason for using python for analyzing data is that it manages and creates data structures quickly.
Pandas, a package in python has many functions that makes it easier to import data, manipulate and analyze it. Sklearn is more of a scientific package that provides advanced tools for tasks like machine learning. Seaborn and Matplotlib are the visualization packages that every analyst stands by. They offer tools to custom make our visualizations and bring out the data artist in us. Another important library is NumPy. It provides us efficient tools to operate and navigate dense datasets.
Tableau
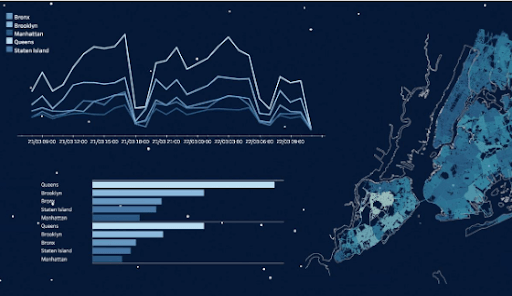
Tableau is a data visualization tool. It is a tool used by analysts to connect, interact and visualize data. It efficiently works with multiple datasets to quickly create effective visualizations and also create dashboards. These tableau visualizations may be a simple graph or a piece of art itself that we design from the data. Shown below is an example of a data visualization using created Tableau.
R
R is one of the recently popular computer languages. It is also used extensively in data analysis as it supports various analytical modeling techniques. It is a programming language that is typically used in statistical computing. It also contains various packages devoted for data analysis such as tidyr, which provides us tools for data cleaning. Ggplot2 and ggraph are the two packages that aid in data visualizations and plotly is used for interactive graphs. Dplyr is a package that facilitates data wrangling and R also has a separate package for carrying out financial analysis called 'tidyquant'.
With this article at OpenGenus, you must have the complete idea of Data Analysis tools.