
In this article, we have explored how Tableau can be used for data visualization by using it on Population dataset.
Table of Contents
- Prerequisites
- Creating the visualization
Prerequisites
For this tutorial, we will be using Tableau Public. Once you are in that page, create an account or log in if you are an existing user. Feel free to go through Tableau's public gallery where many visualizations are available, to get an idea. The visualizations in Tableau are dynamic, which means they change over time and are interactive.
We will be using the population dataset from Kaggle for this tutorial. It can be downloaded here.
Creating the visualization
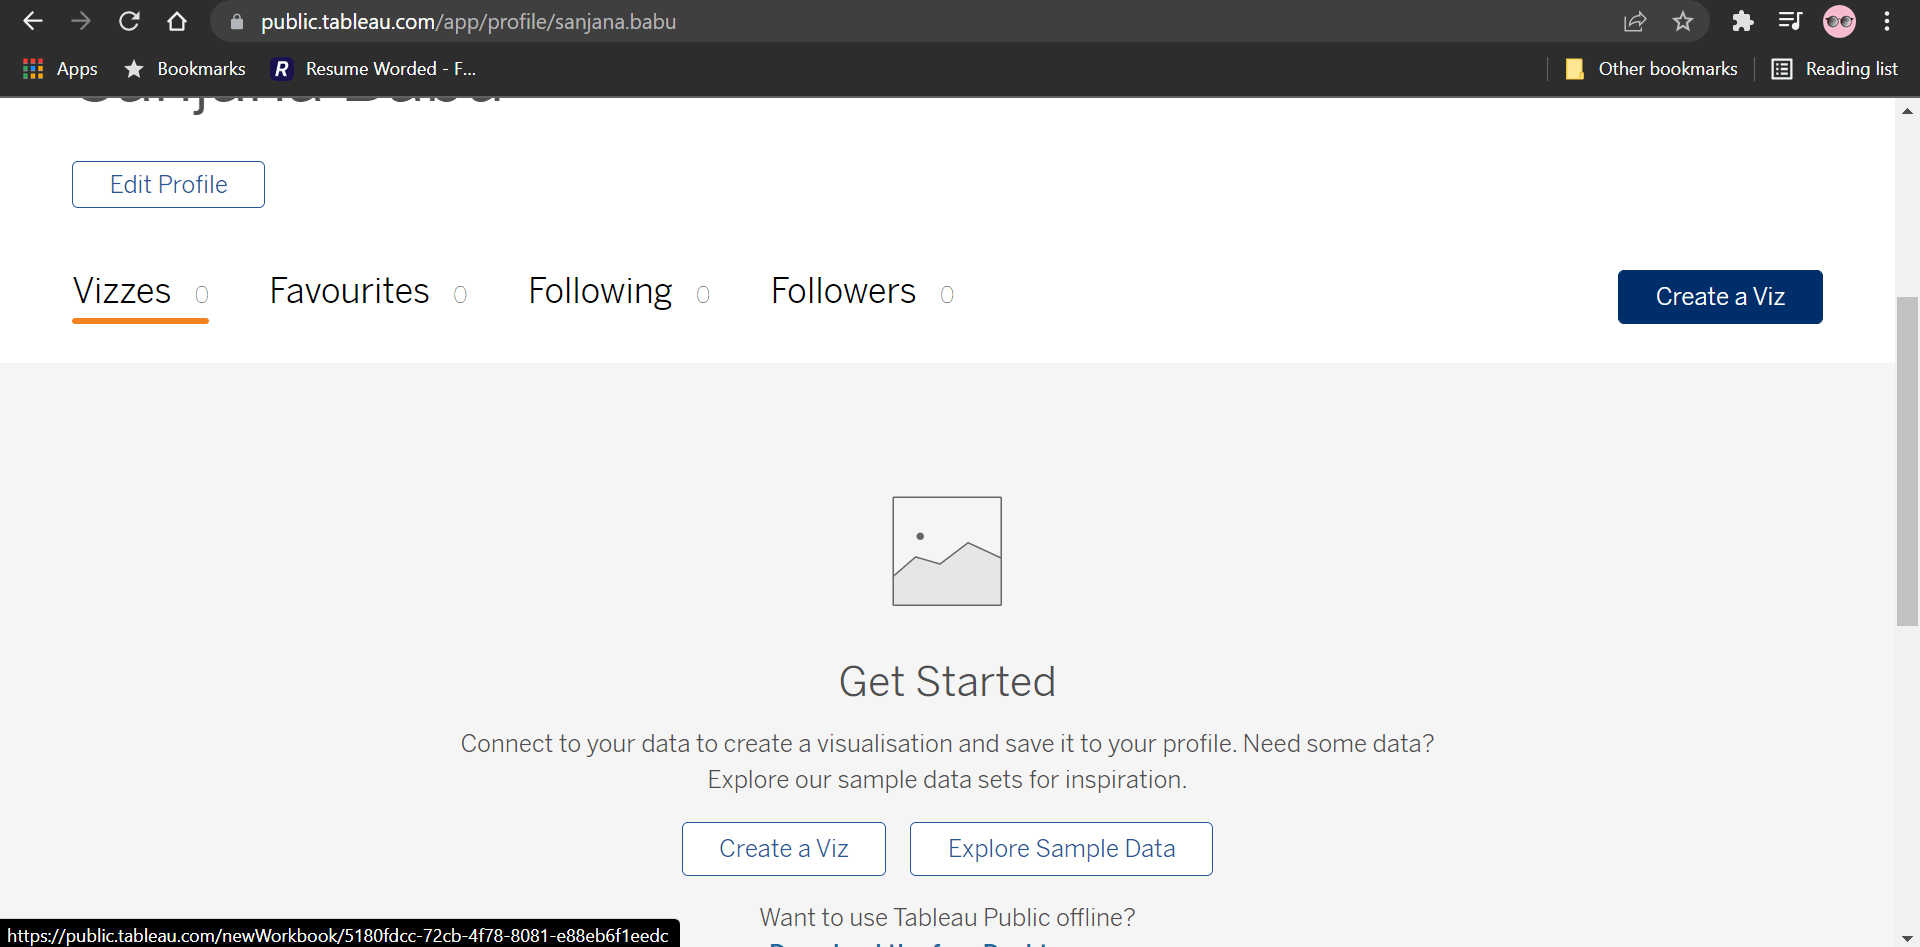
Once we are in our Tableau profile, we will see a 'Create a Viz' button as shown. Click on it to create a new workbook where we will create our visualizations.
Soon as the workbook is opened, it will ask us to upload the data source. Here, we will be using the csv file '2022_population' which we downloaded earlier. Drag and drop the file to upload the data. We will then be taken to the 'data source' page where we can form relationships between datasets.
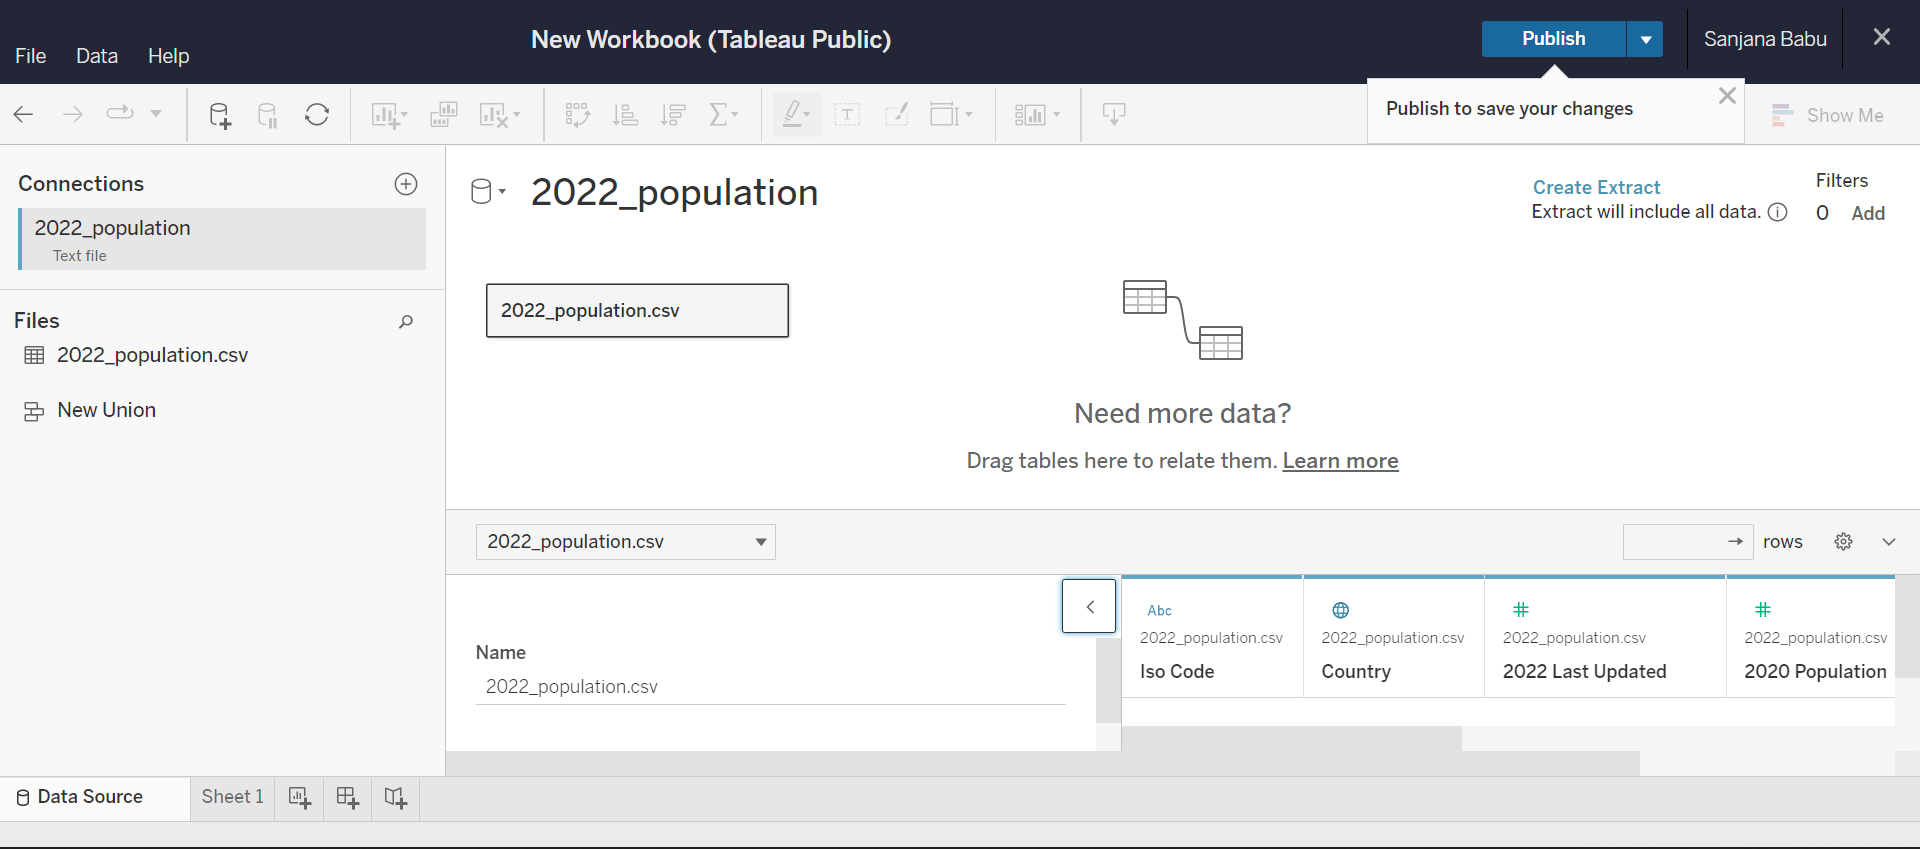
Since we are just working with a single dataset, we will proceed to the next step. Navigate to the tab named as 'Sheet 1' in the bottom left. Tableau Separates the columns of our dataset into Measures and Dimensions which are visible in the leftmost corner of our window.
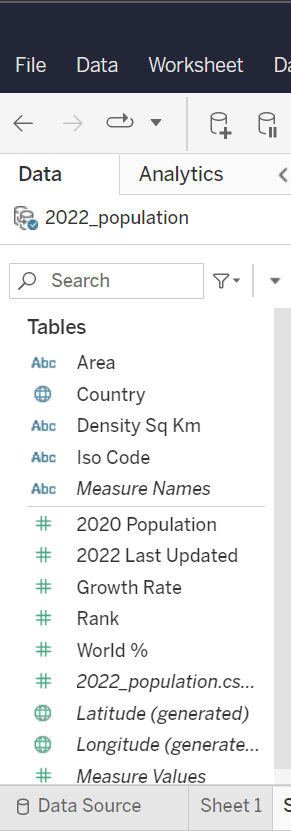
The blue ones are the dimensions whereas the green ones are the measures.
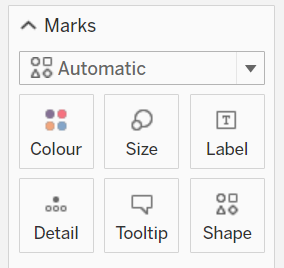
Beside this, we also have a 'Marks' section which allows us to customize our visualization. Generally Tableau displays visualizations using 'Marks' where each mark corresponds to row(s) in our dataset.
Maps
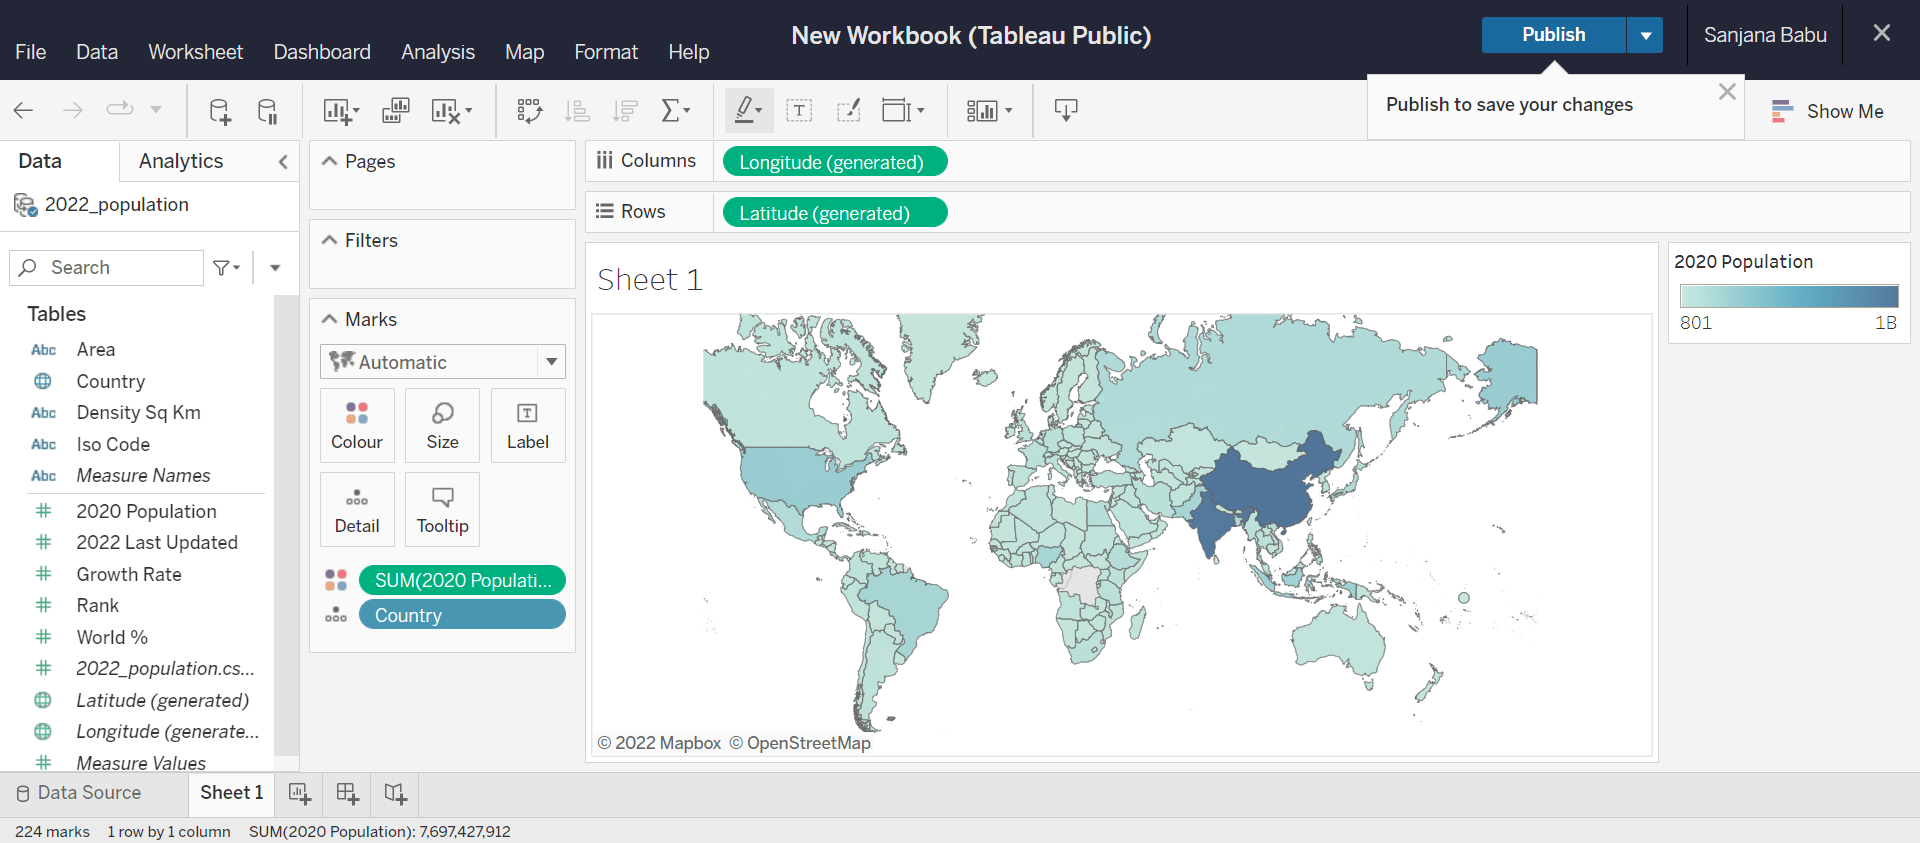
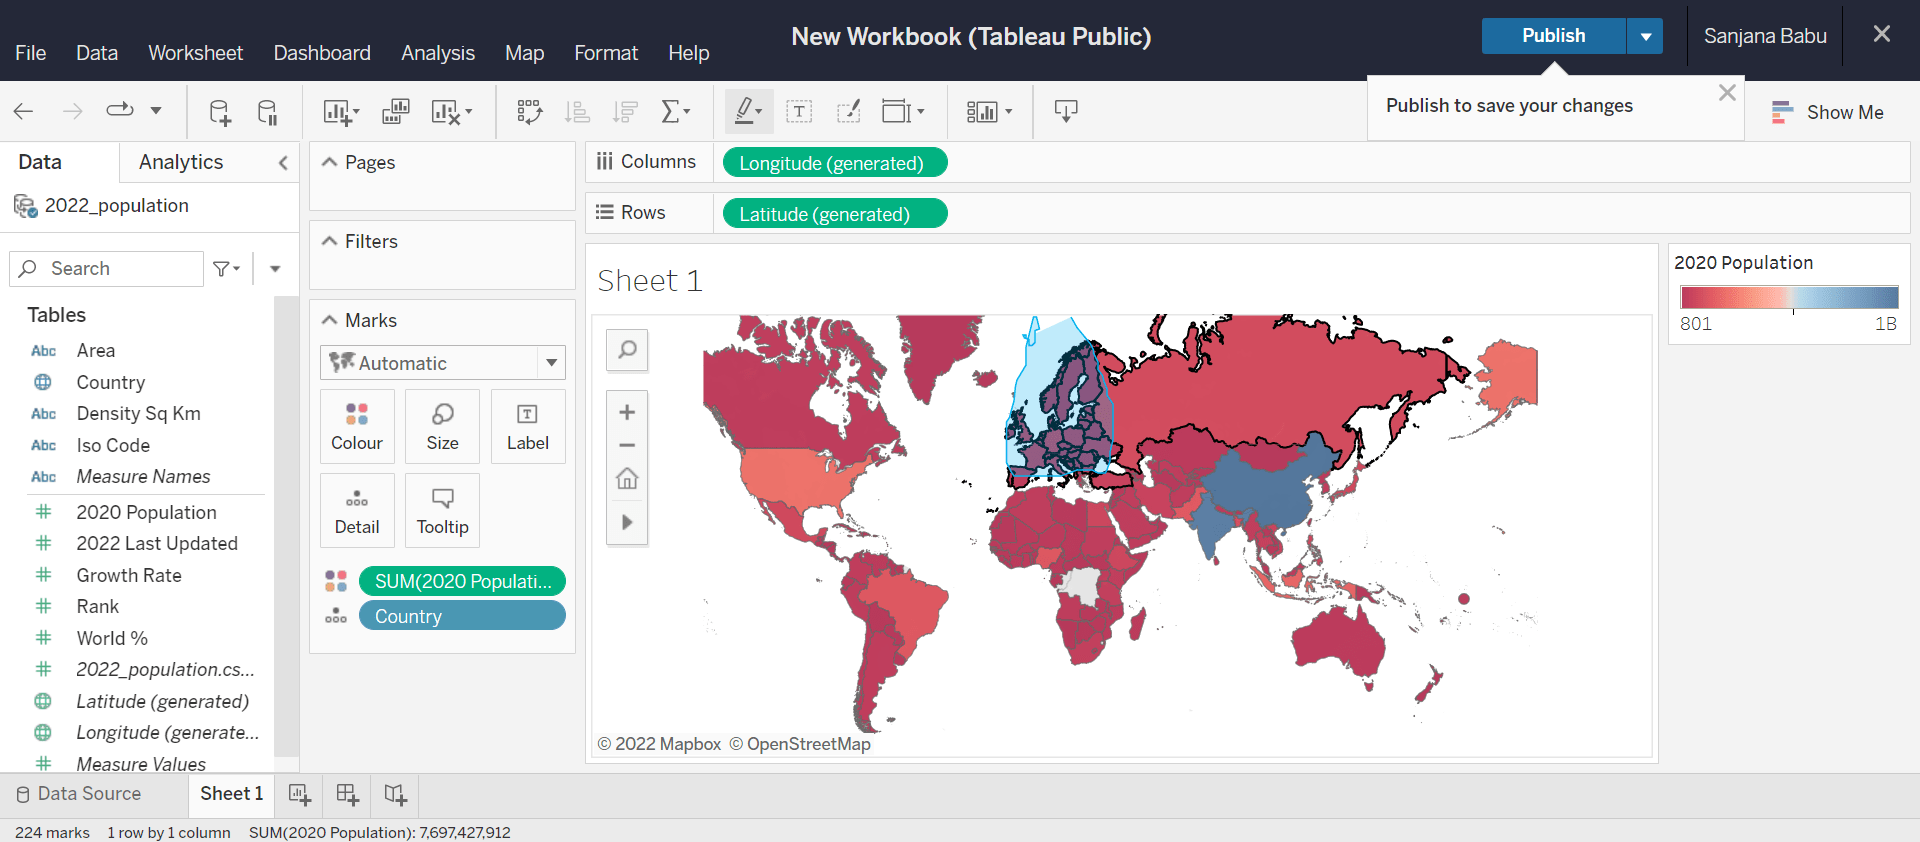
Now, for creating a map, drag and drop 'Country' from the list of dimensions into the 'Detail' section in Marks. This will generate a world map in our workspace where all the countries in our dataset are marked. Then, add the '2020 Population' from the list of measures to the colour in the marks section. By default, its aggregate value would be sum. Now this will generate a world map where the countries are colour coded according to their 2020 population.
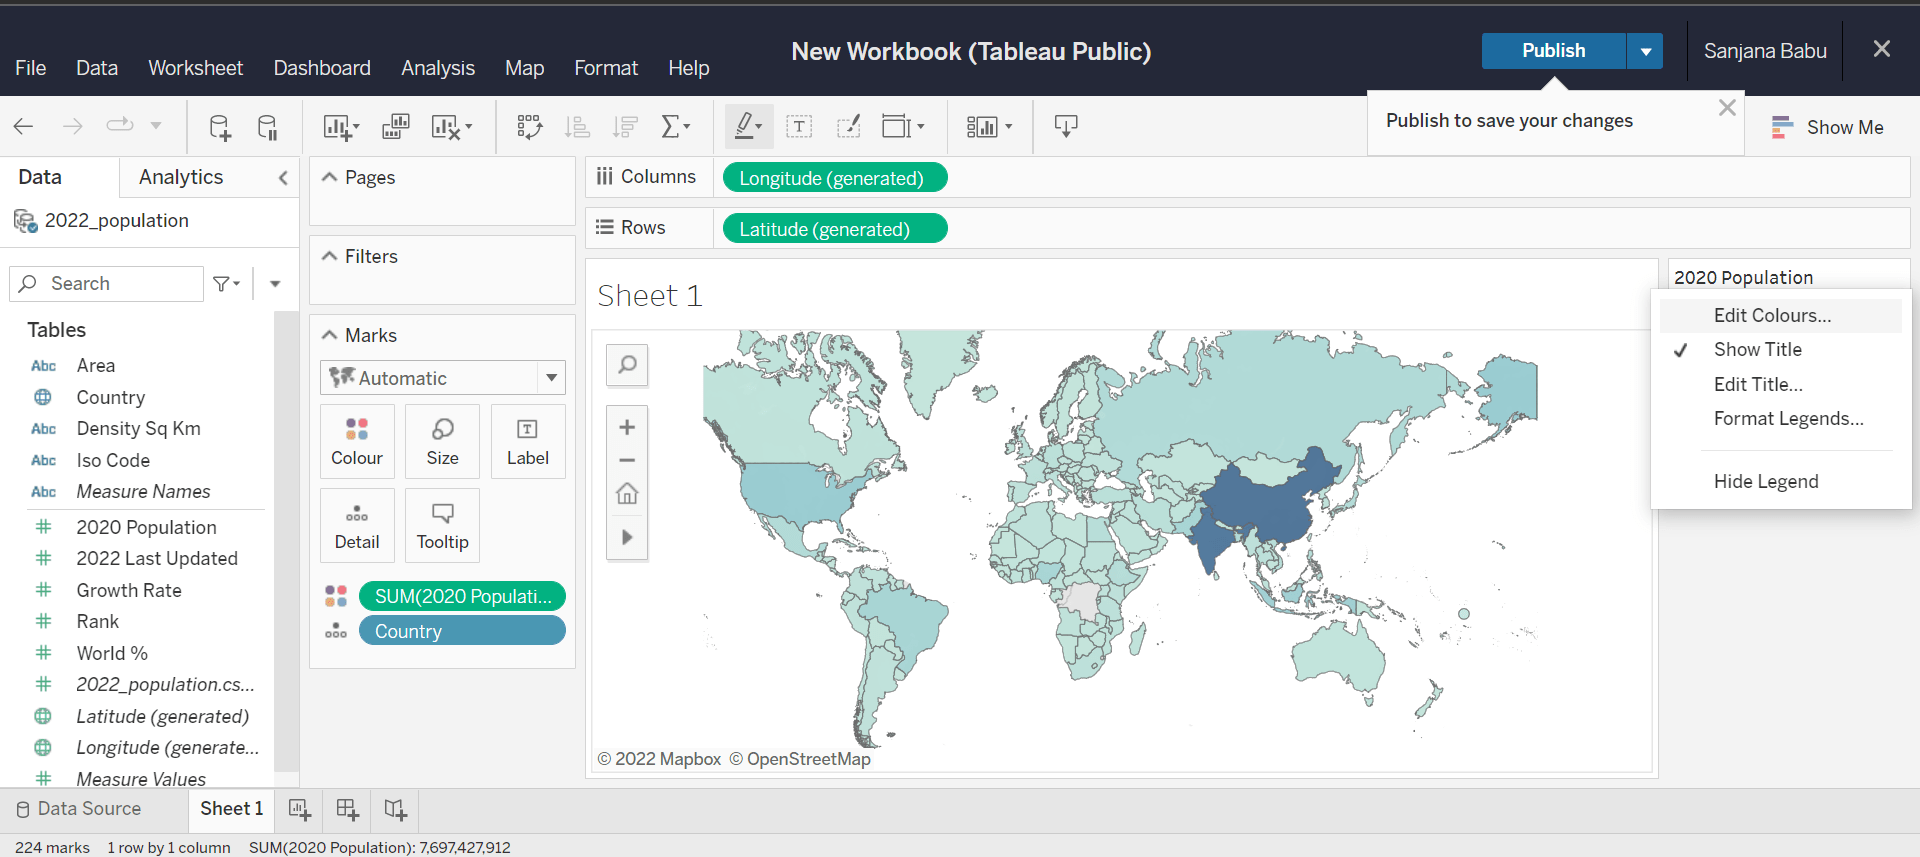
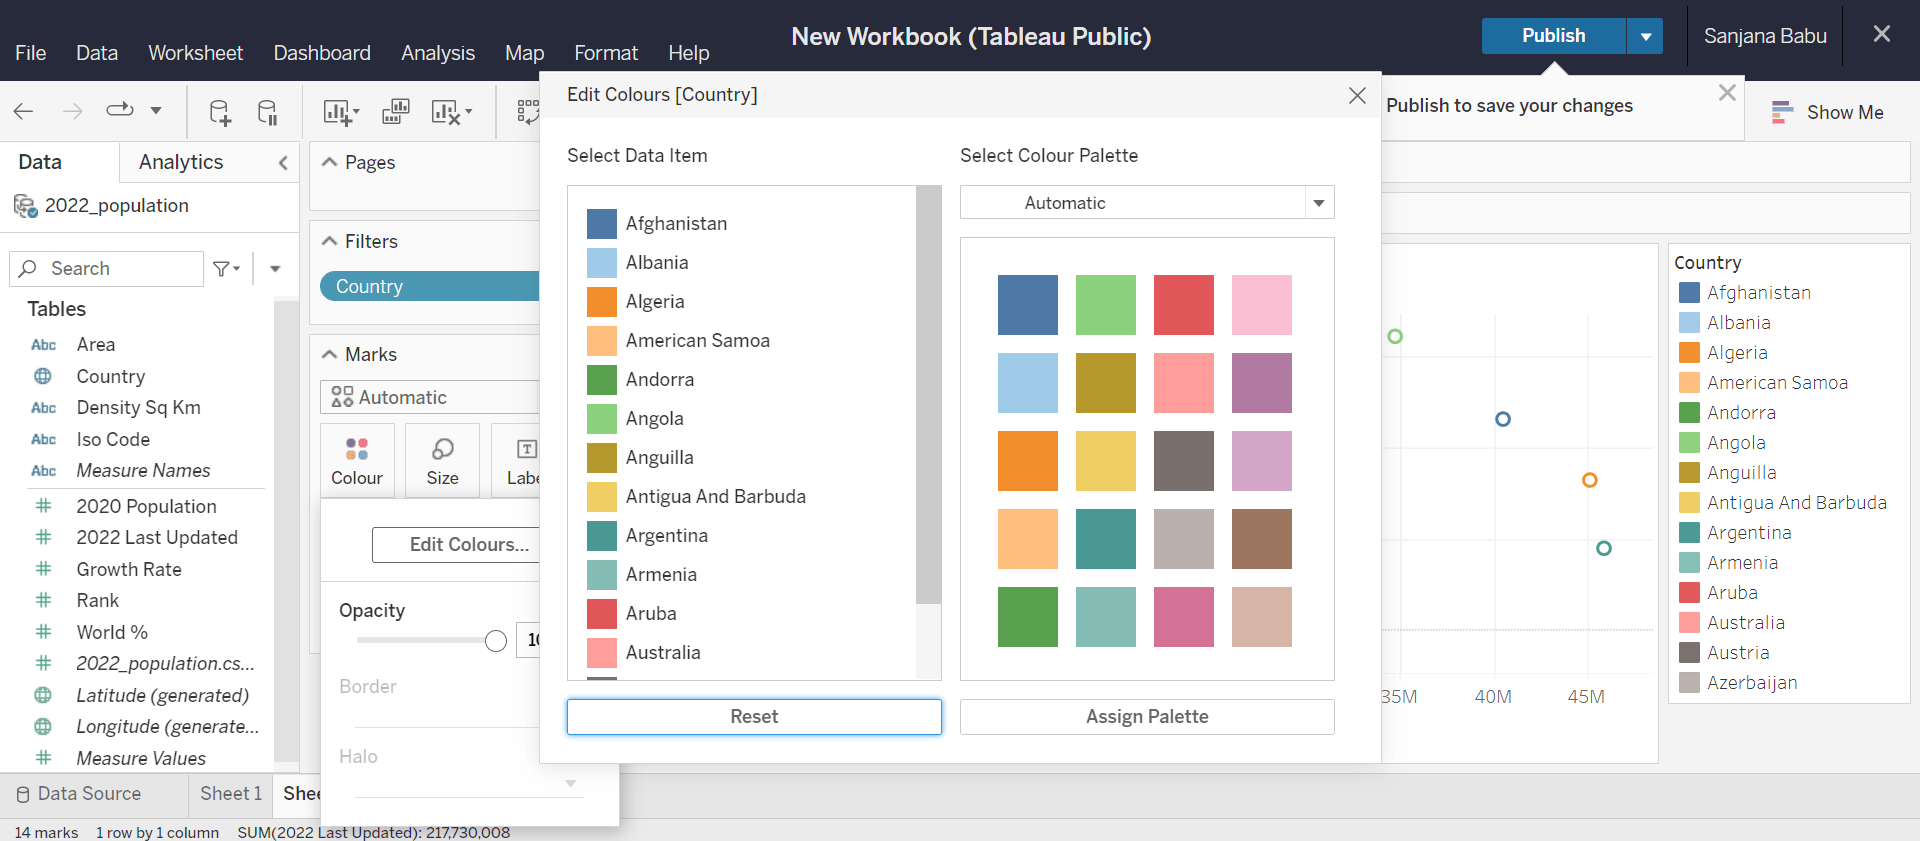
Click on the legend displayed in the right and choose 'Edit Colours' from the menu to edit the colour palette.
This will open up a menu with various colour palettes available.
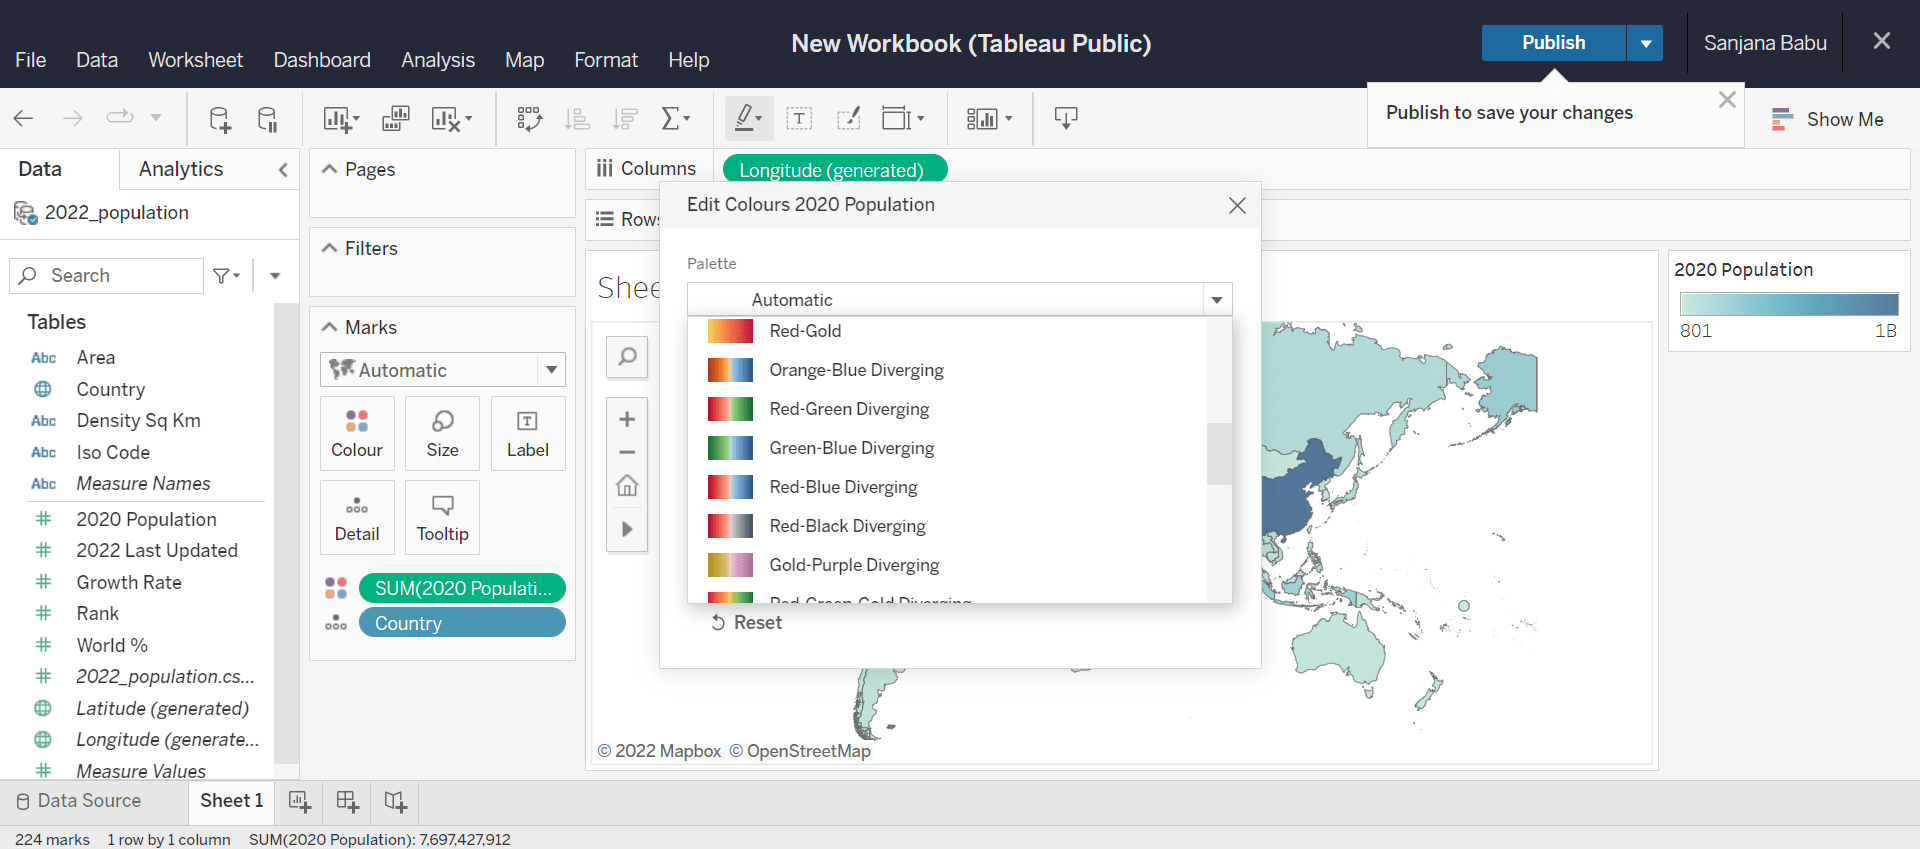
Choose a palette of preference. This will change the colours in our visualization. Then click on the lasso tool from the menu options in the map. This allows us to select parts of the map to either keep or discard.
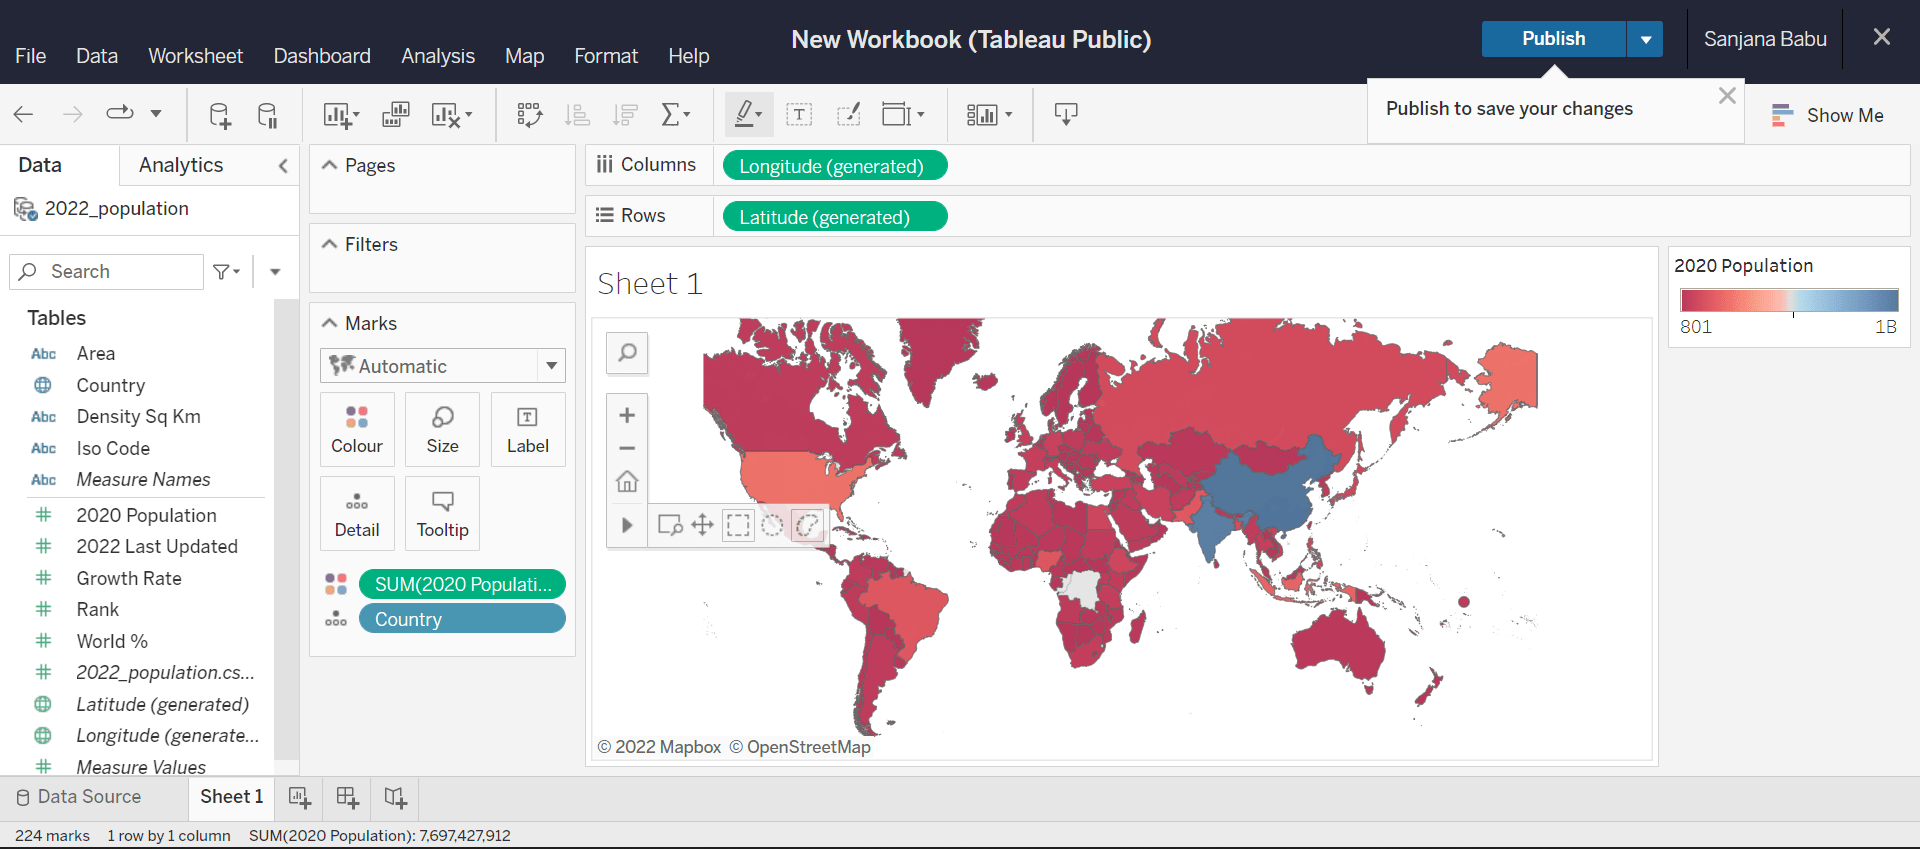
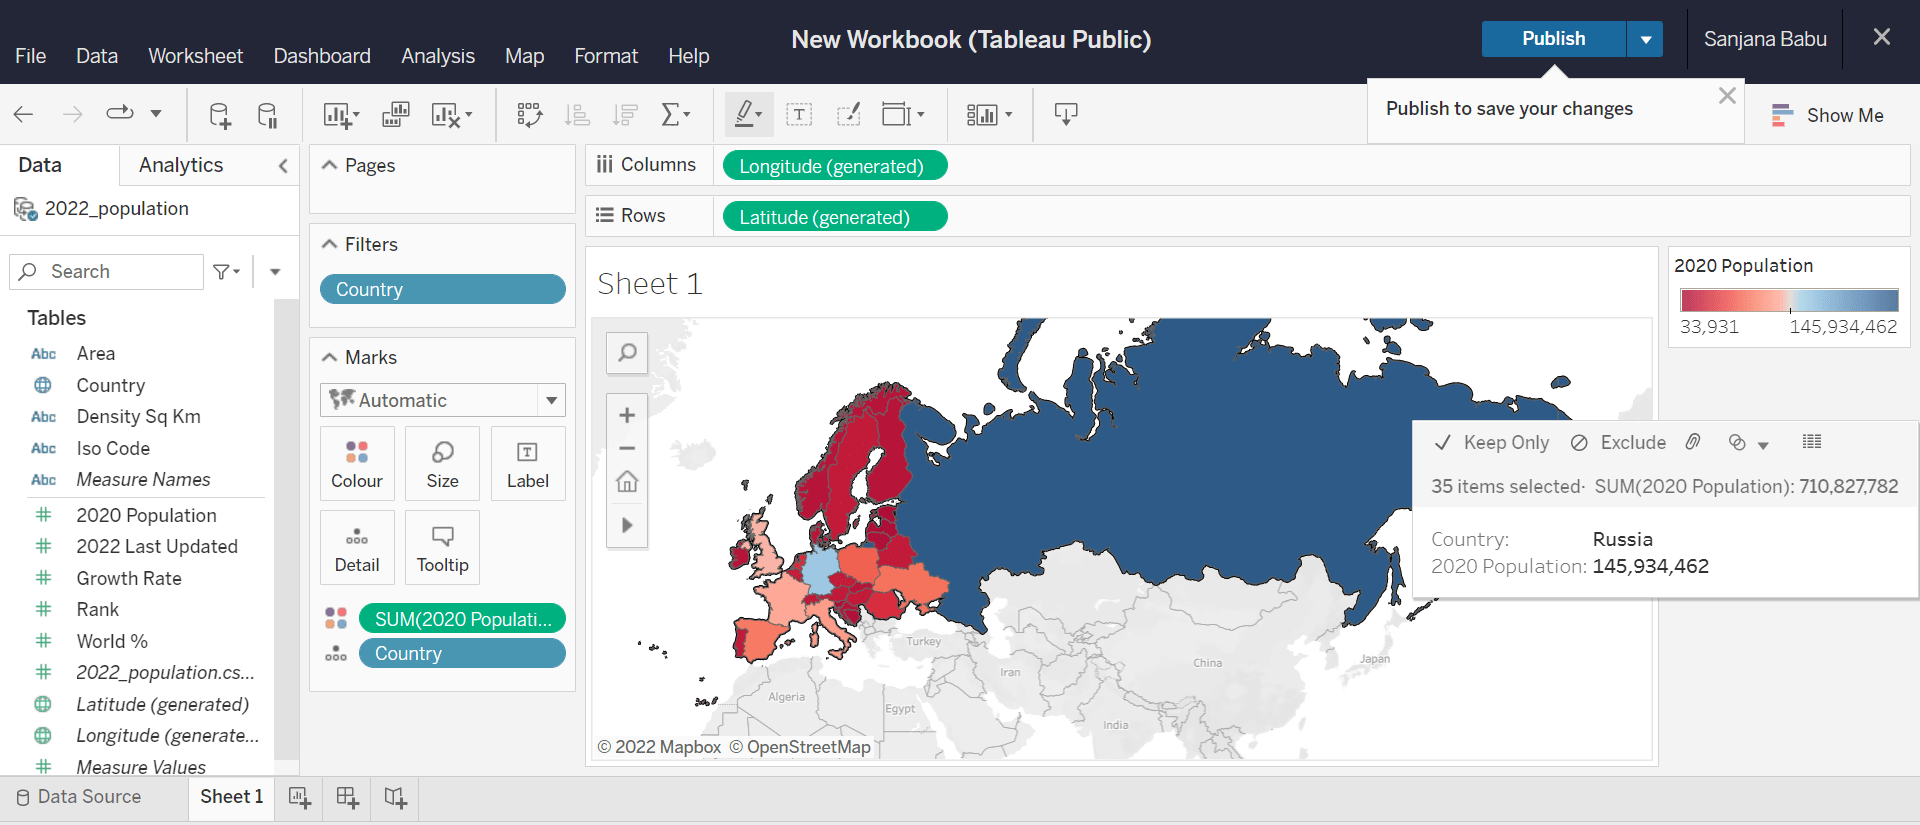
Then with the help of the lasso tool, outline the regions that you want to keep/discard. Here, we are going to keep the countries in Europe and also Russia. Hence, we select them. Once selected, a pop-up appears as we hover over any selected region. In that, we choose the 'Keep only' option.
Now, in our visualization, data only for the selected countries will be shown and the rest will be grayed out. The colour range will be altered automatically.
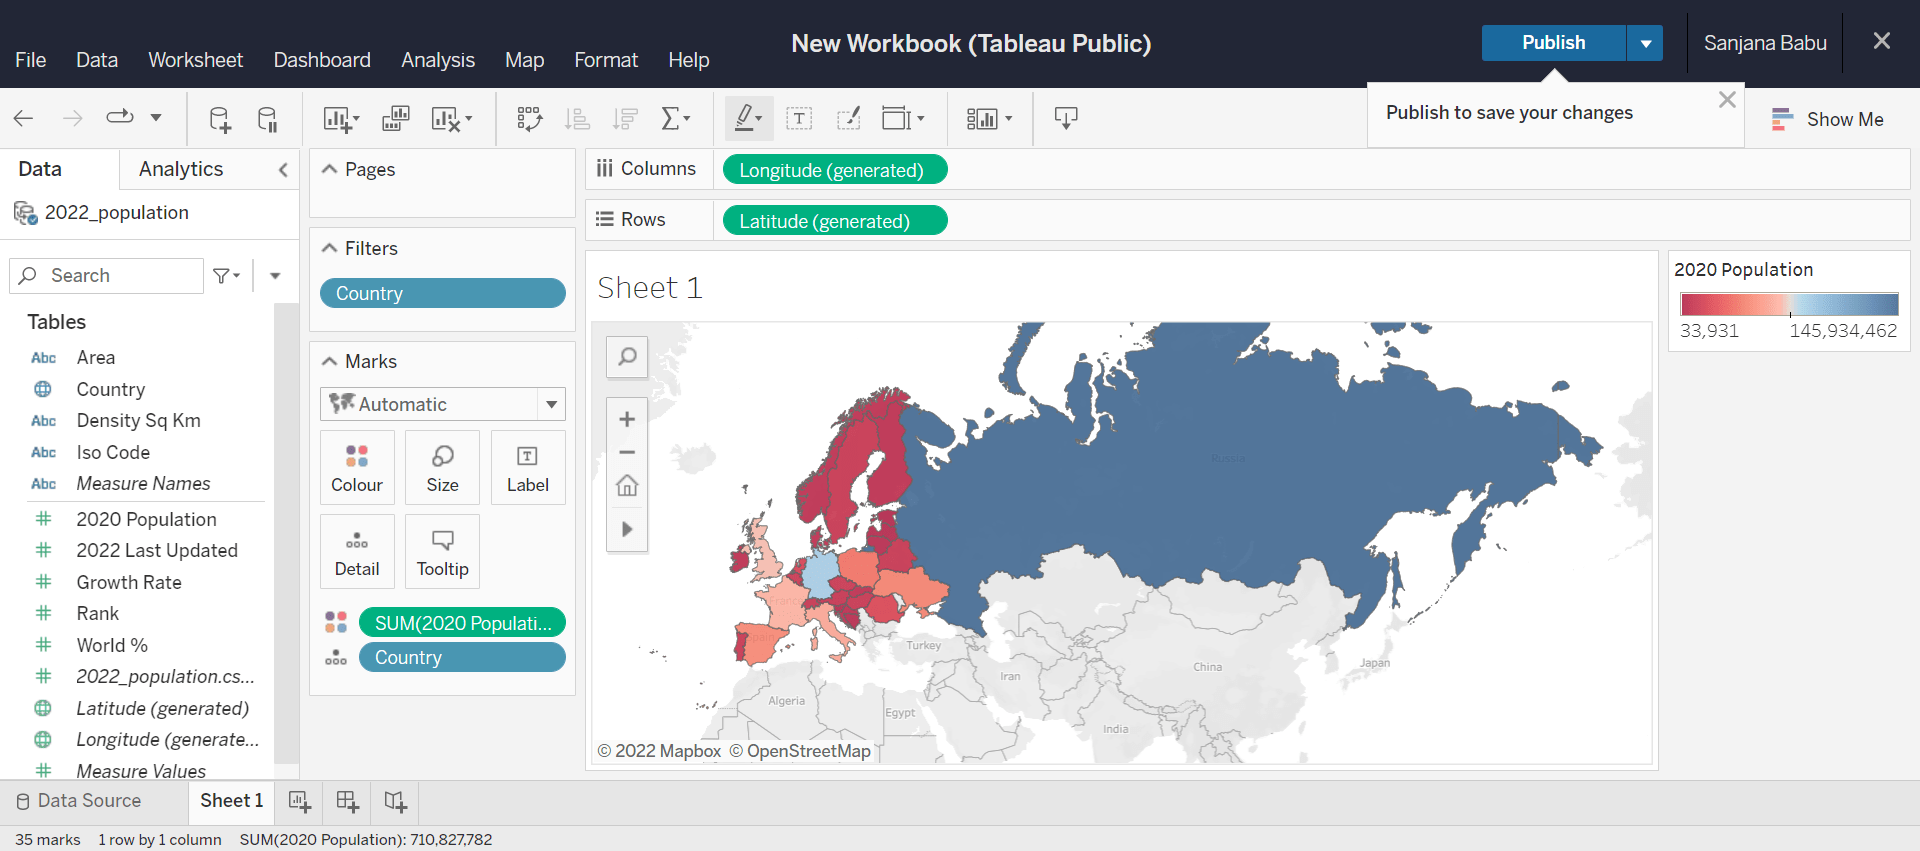
Now, we have a map that displays the 2020 population of the selected countries.
Scatter plot
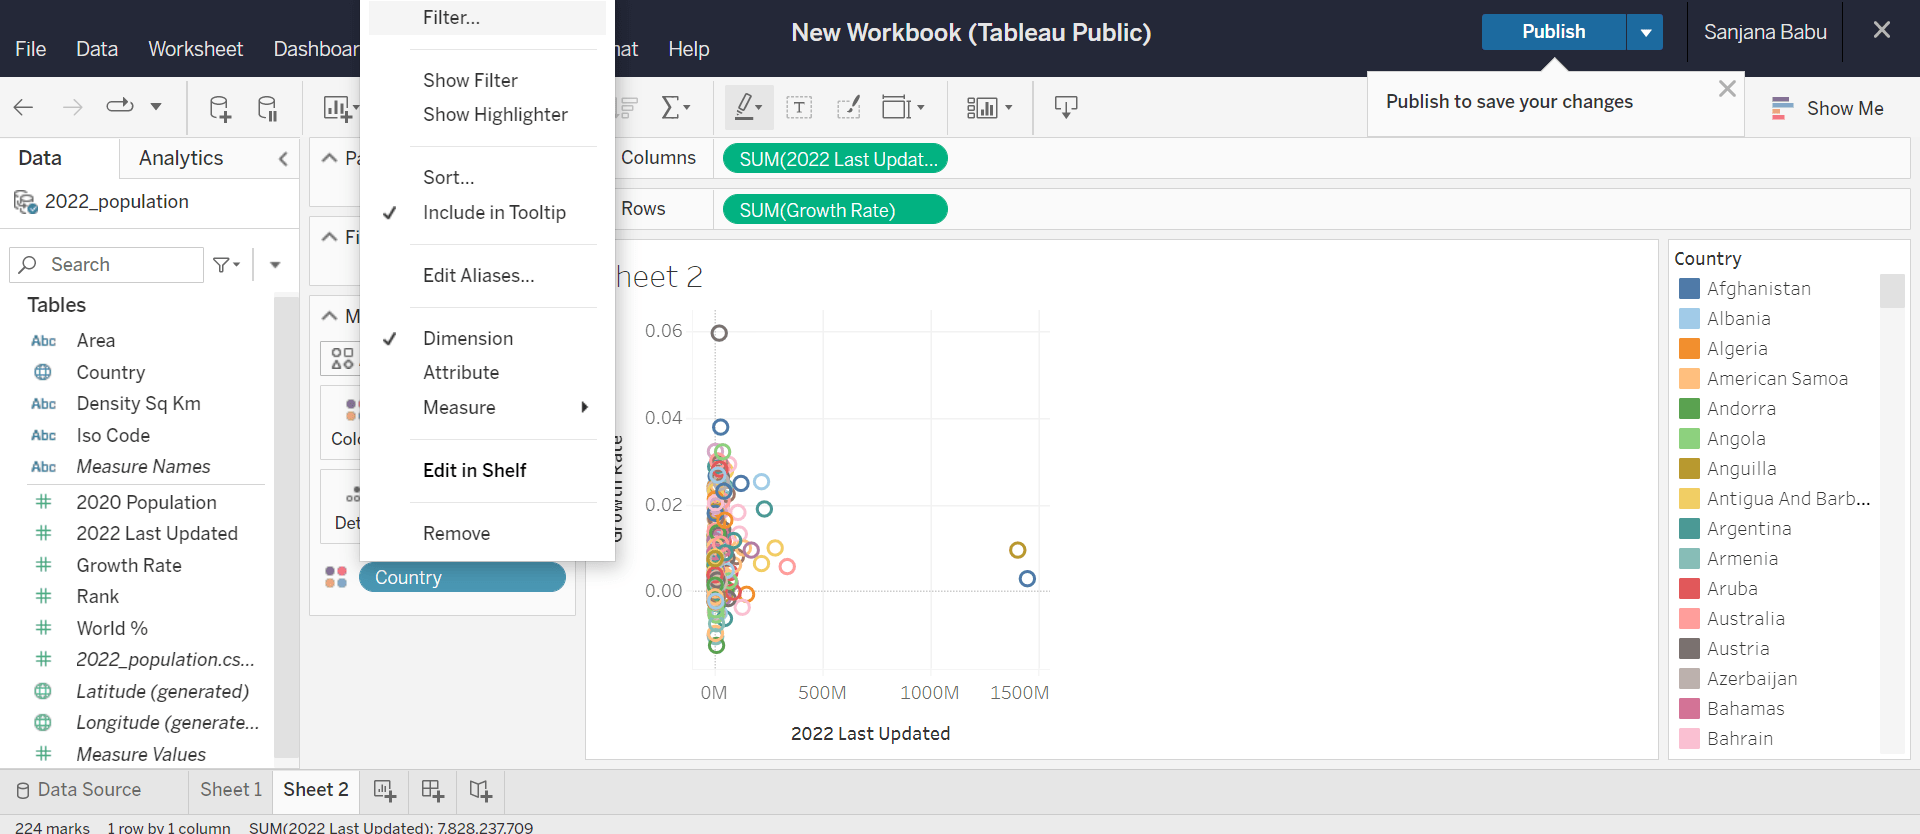
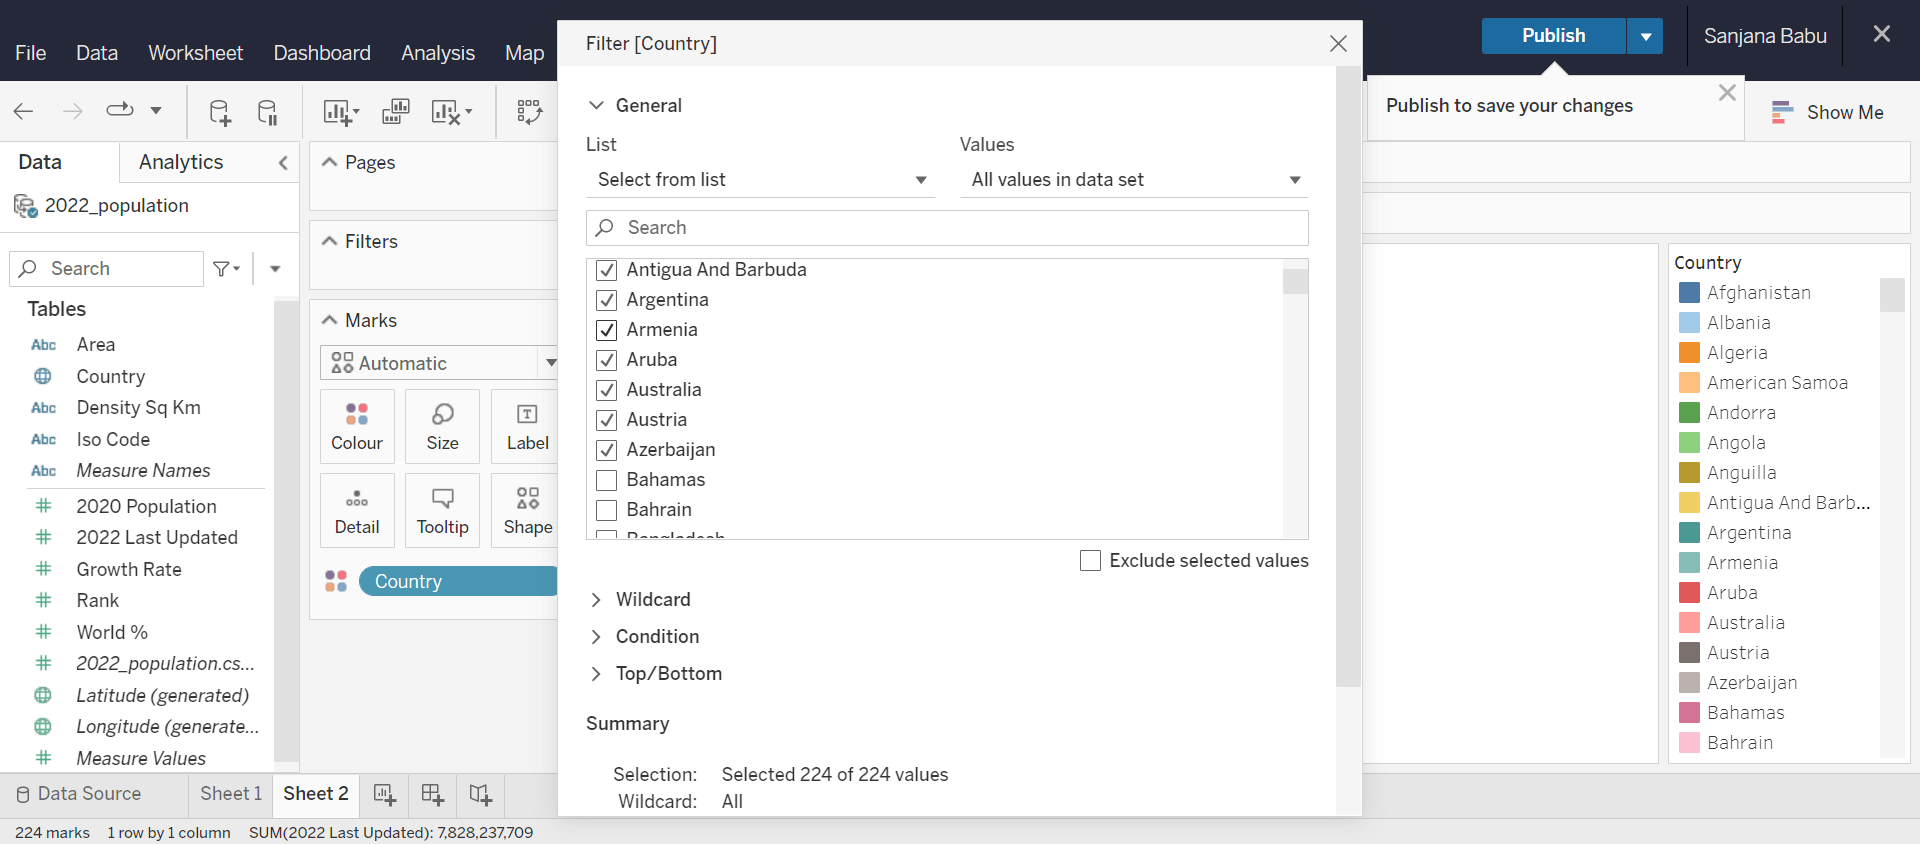
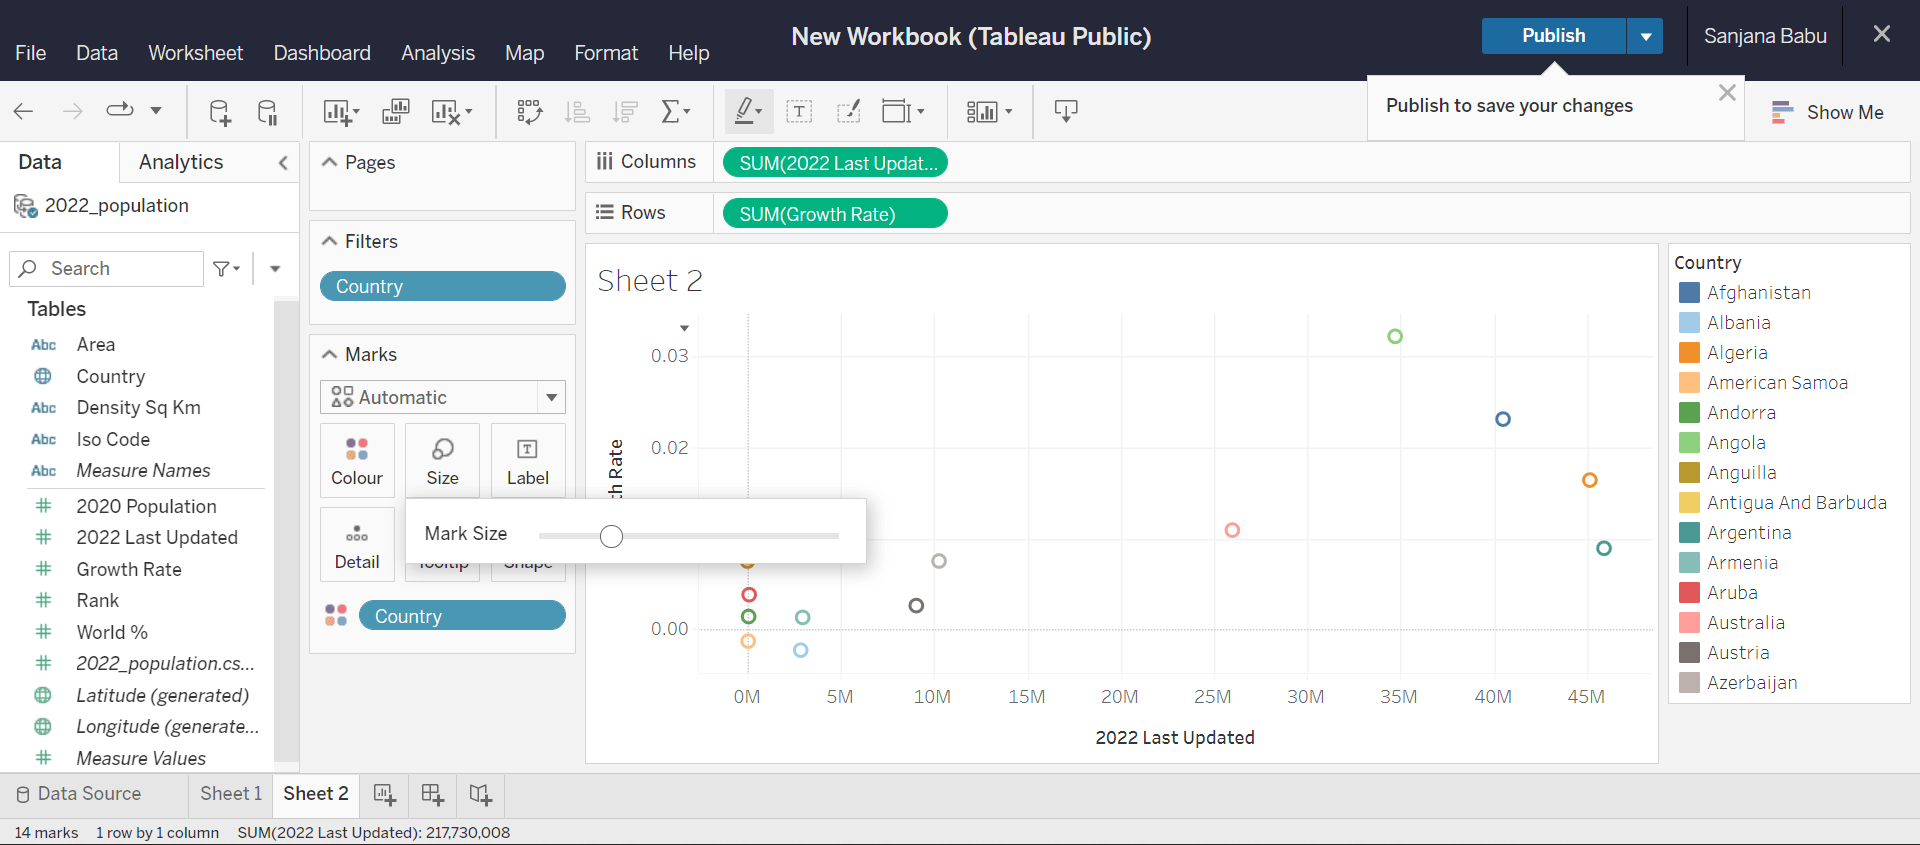
Scatter plot is used when we need to visualize relationships between two numerical variables. To create a scatter plot in Tableau, add measures into both rows and columns. Here we have chosen the measures '2022 Last Updated' and 'Growth Rate'. Then add the dimension 'Country' to the 'Colour' section in the marks. This will generate a scatter plot between Growth Rate and 2022 Last Updated population where the points are colour coded by the country name. Since our visualization is cluttered as many points representing the various countries are present, we click on the 'country' dimension added to the marks section and select the filter option.
This opens up a filter menu. Now we wish to keep only the countries whose names start with the letter "A". To achieve this, we can either manually select all countries starting with "A" in the general filter or we can give the constraint in the wildcard filter.
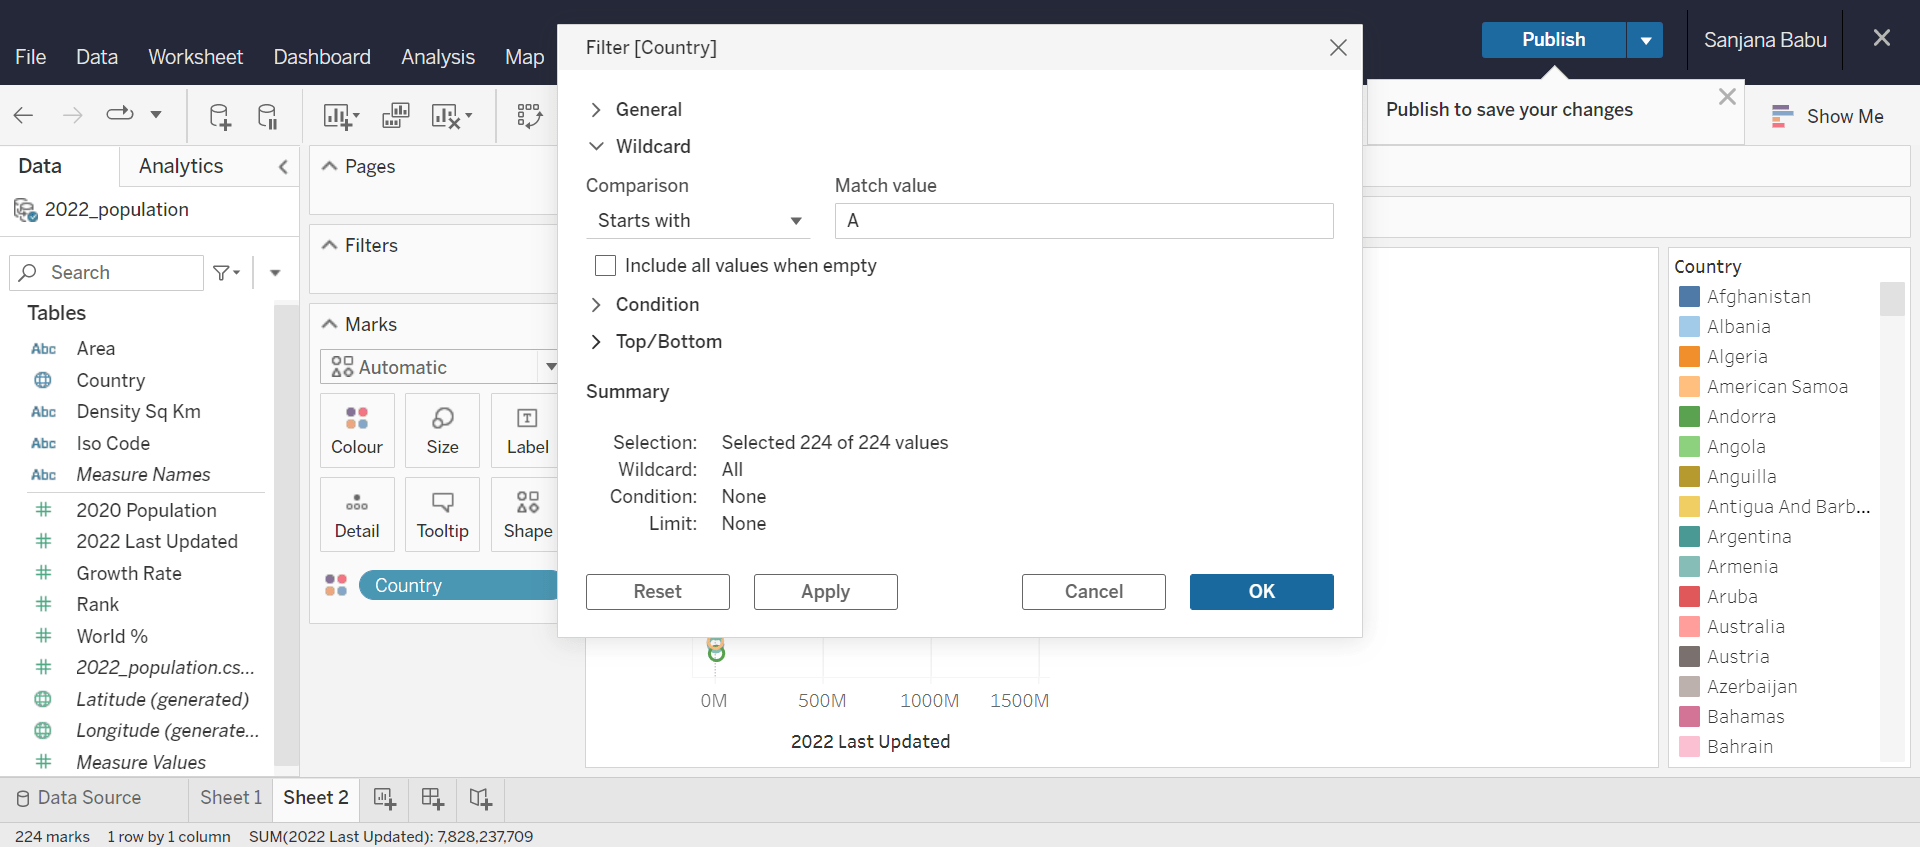
Click OK for the changes to be implemented. Now we have a scatter plot for only the countries whose names start with "A".
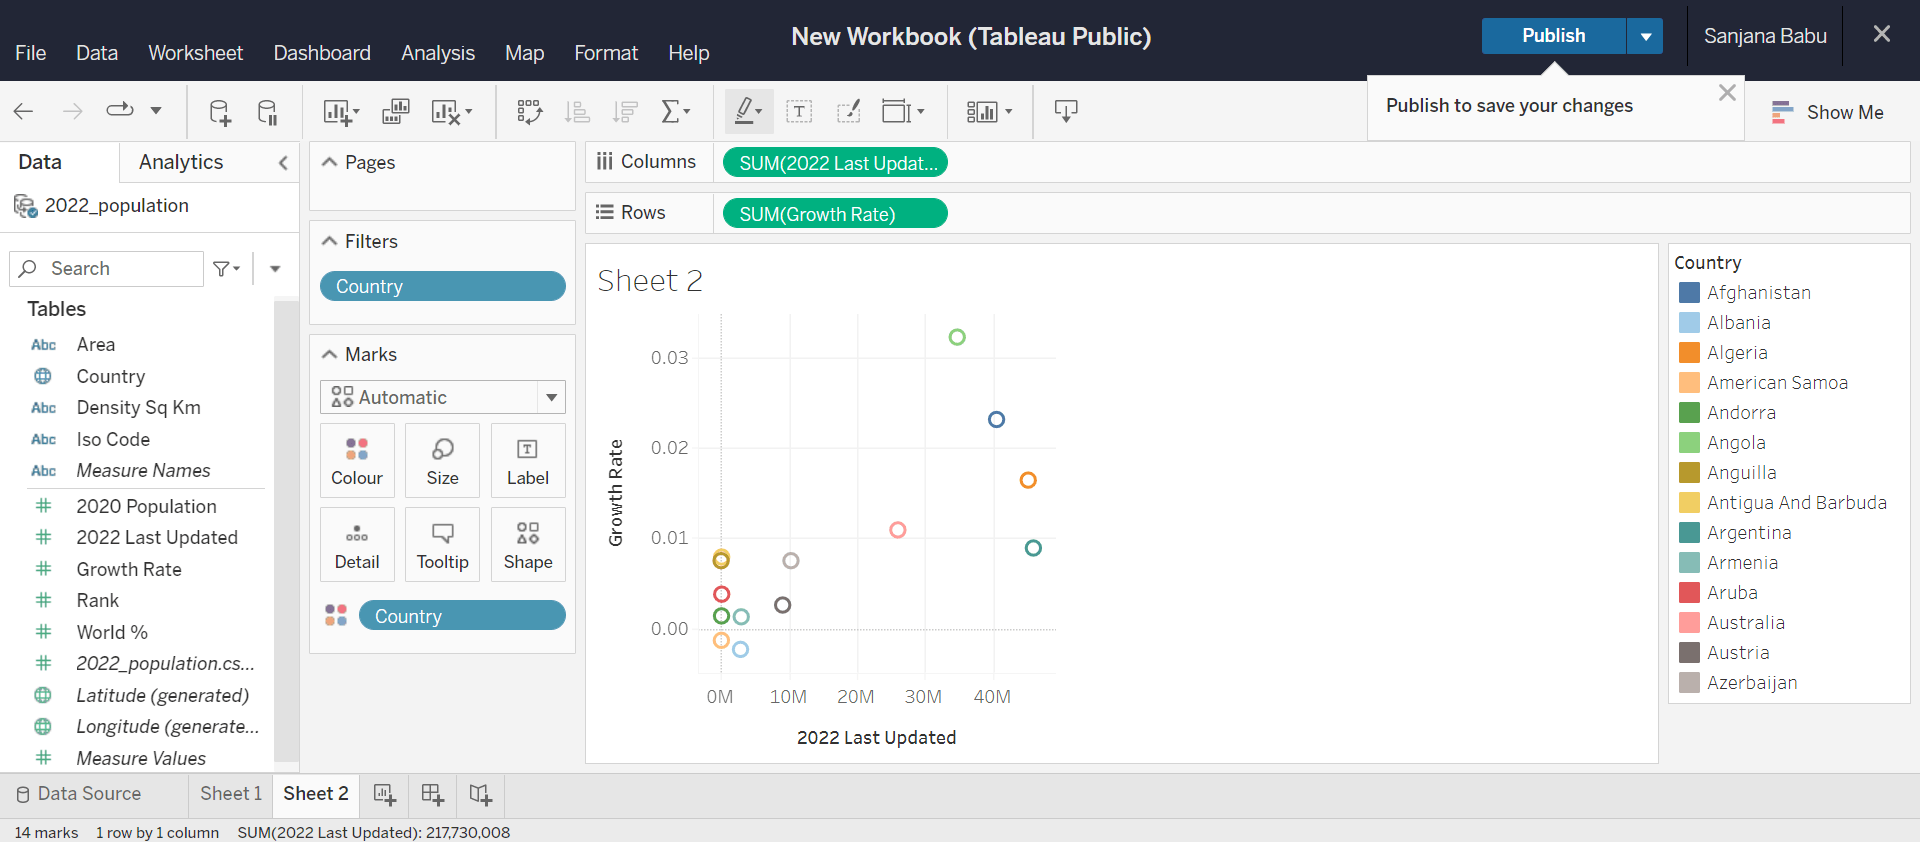
To adjust the size of the visualization, we go to the 'fit' icon in the toolbar and select the required size.
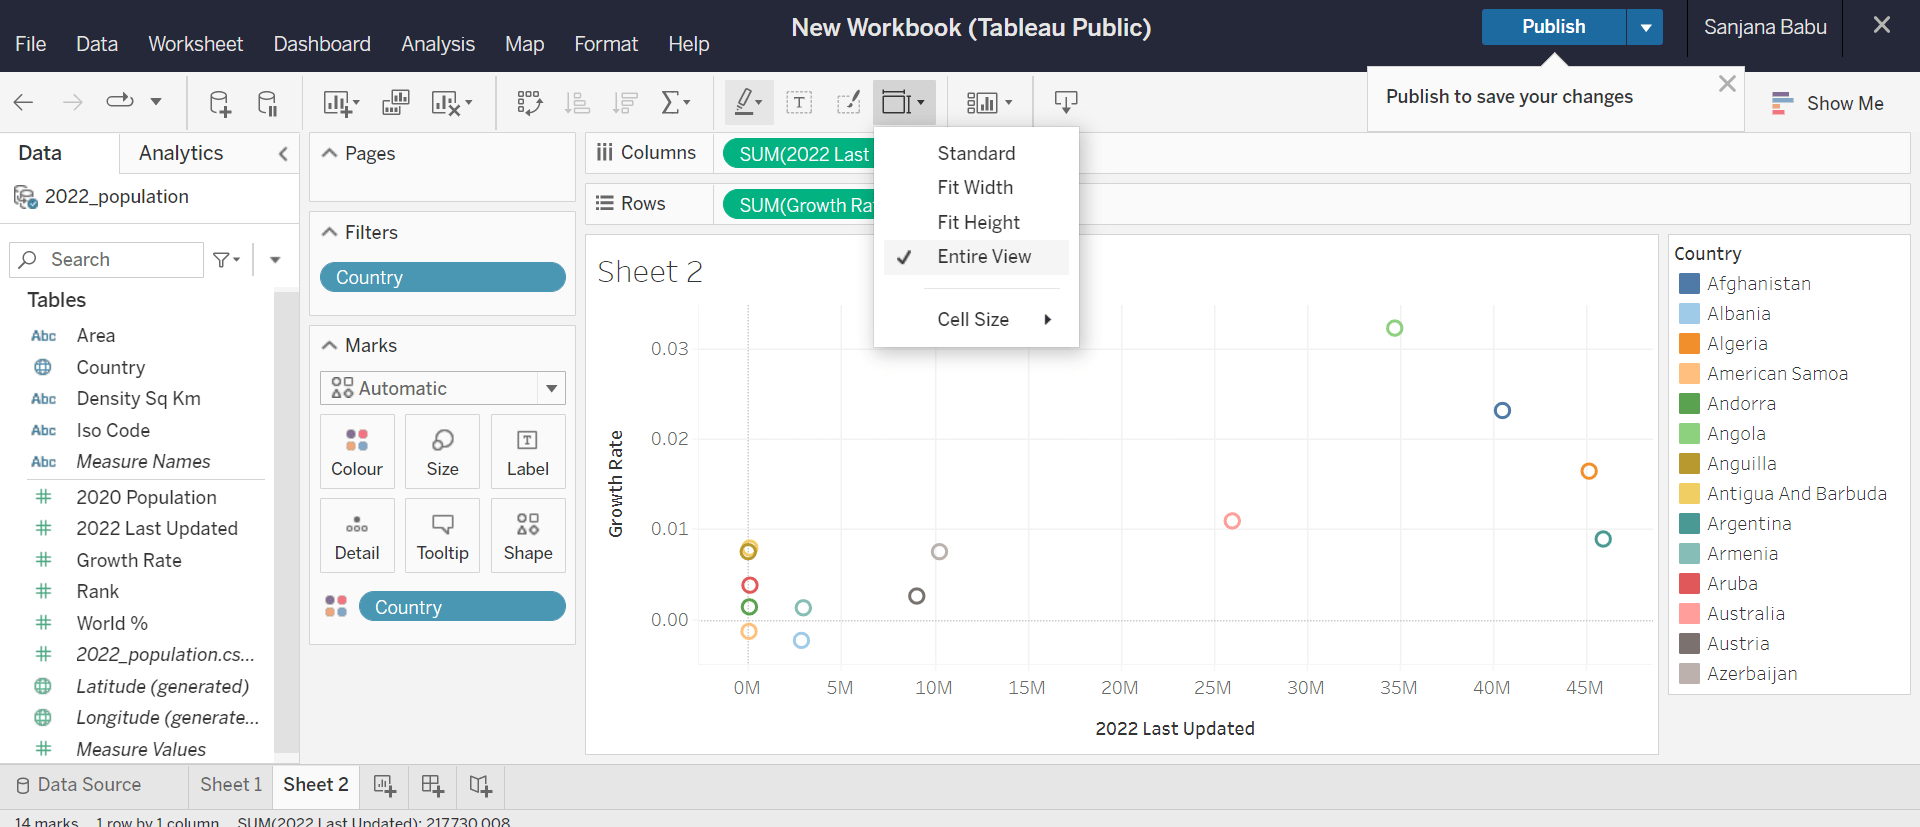
We can also customize the colours and the size of the points in the marks section by clicking on the appropriate option.
Bar graph
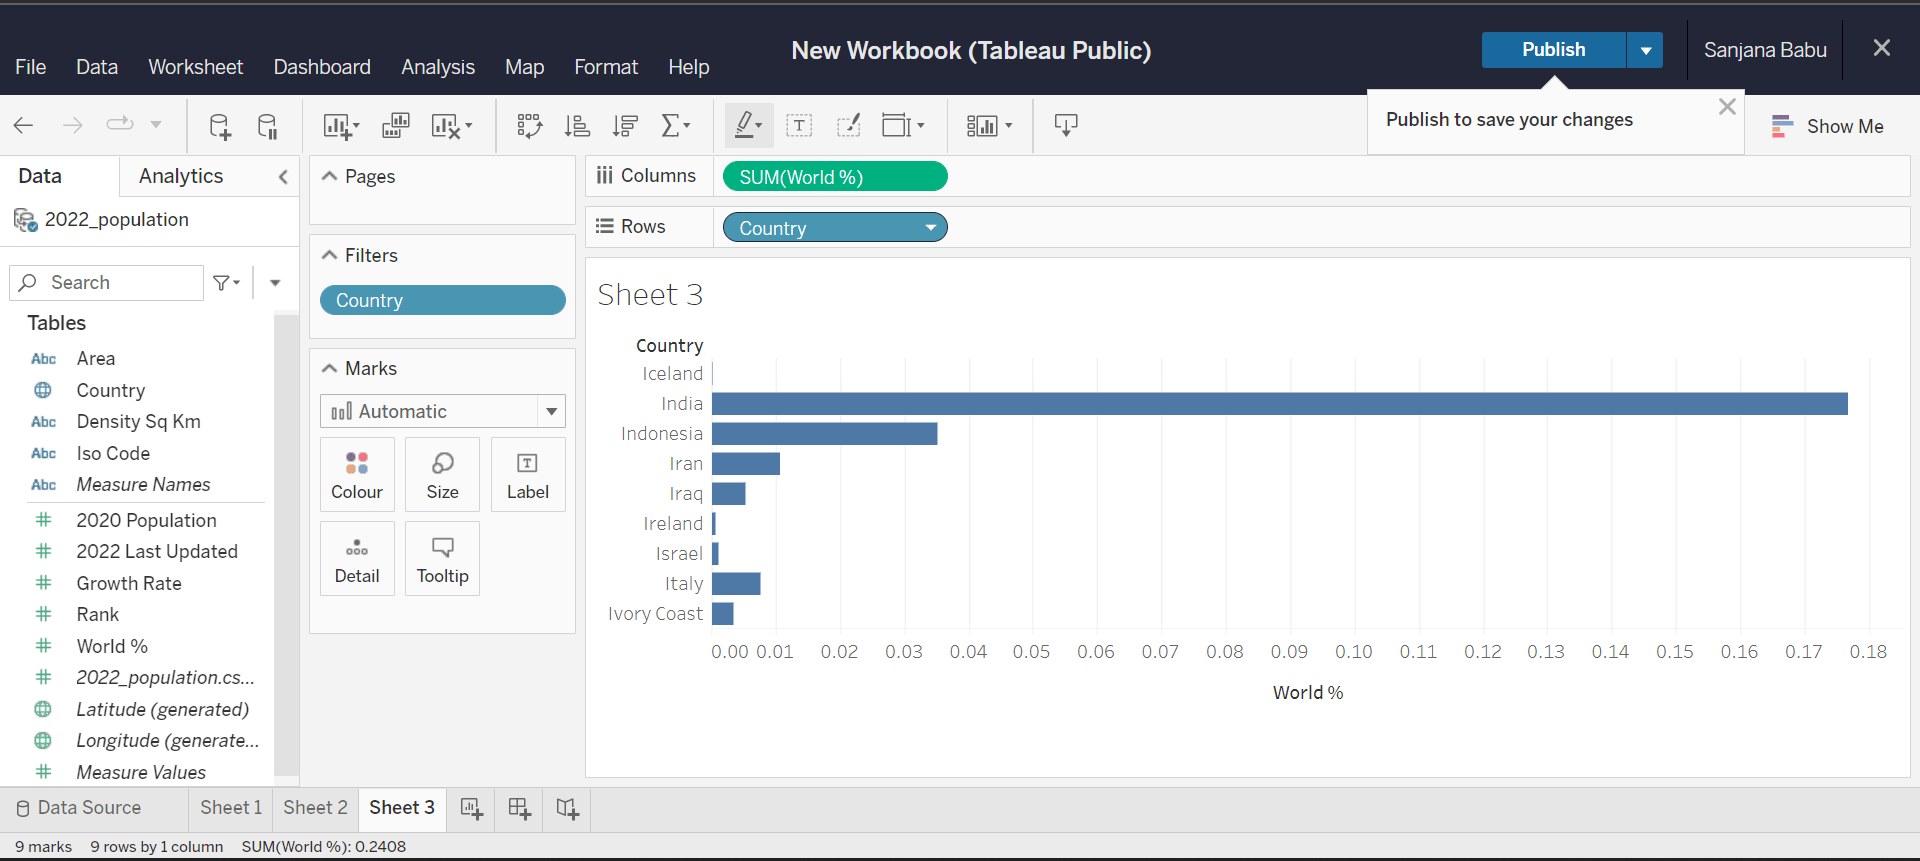
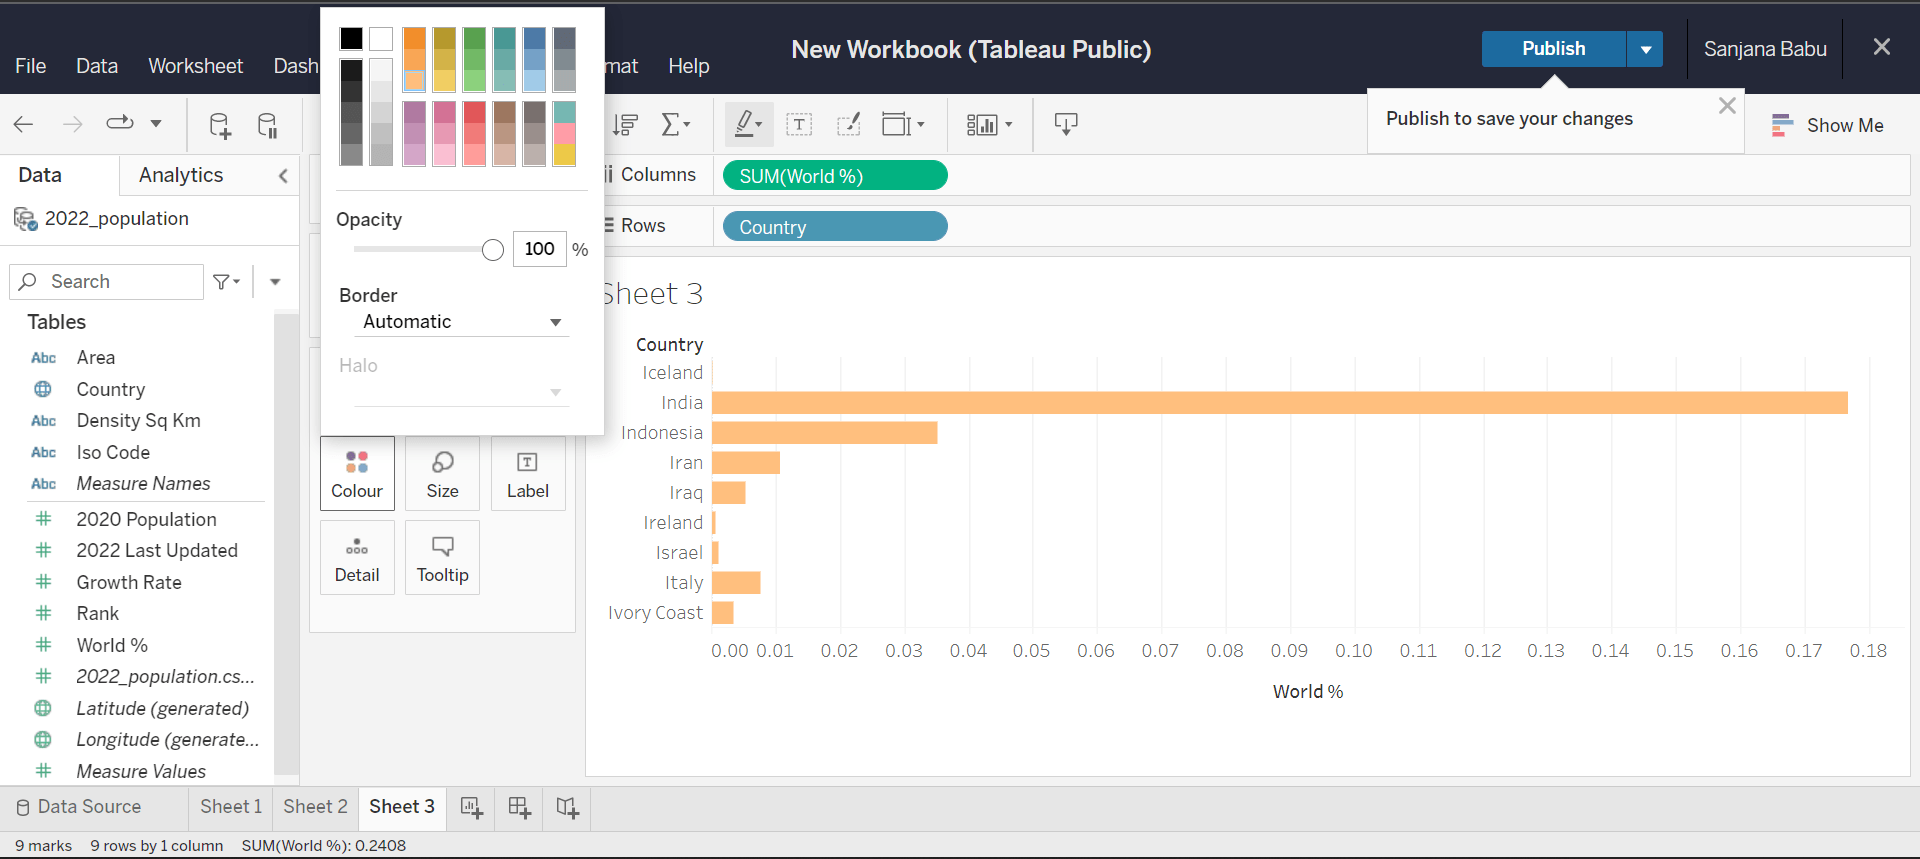
To create a bar graph in Tableau, we need atleast one dimension and a measure. Depending upon where we place them, we can either get a horizontal or vertical bar graph. If the dimension is in the 'Columns' section and the measure is in the 'Rows', we get a vertical chart. If their positions are interchanged, we obtain a horizontal chart. Here, we have used the dimension 'Country' and the measure 'World %' and have only displayed the data of countries whose name starts with "I" using the filter option we saw above.
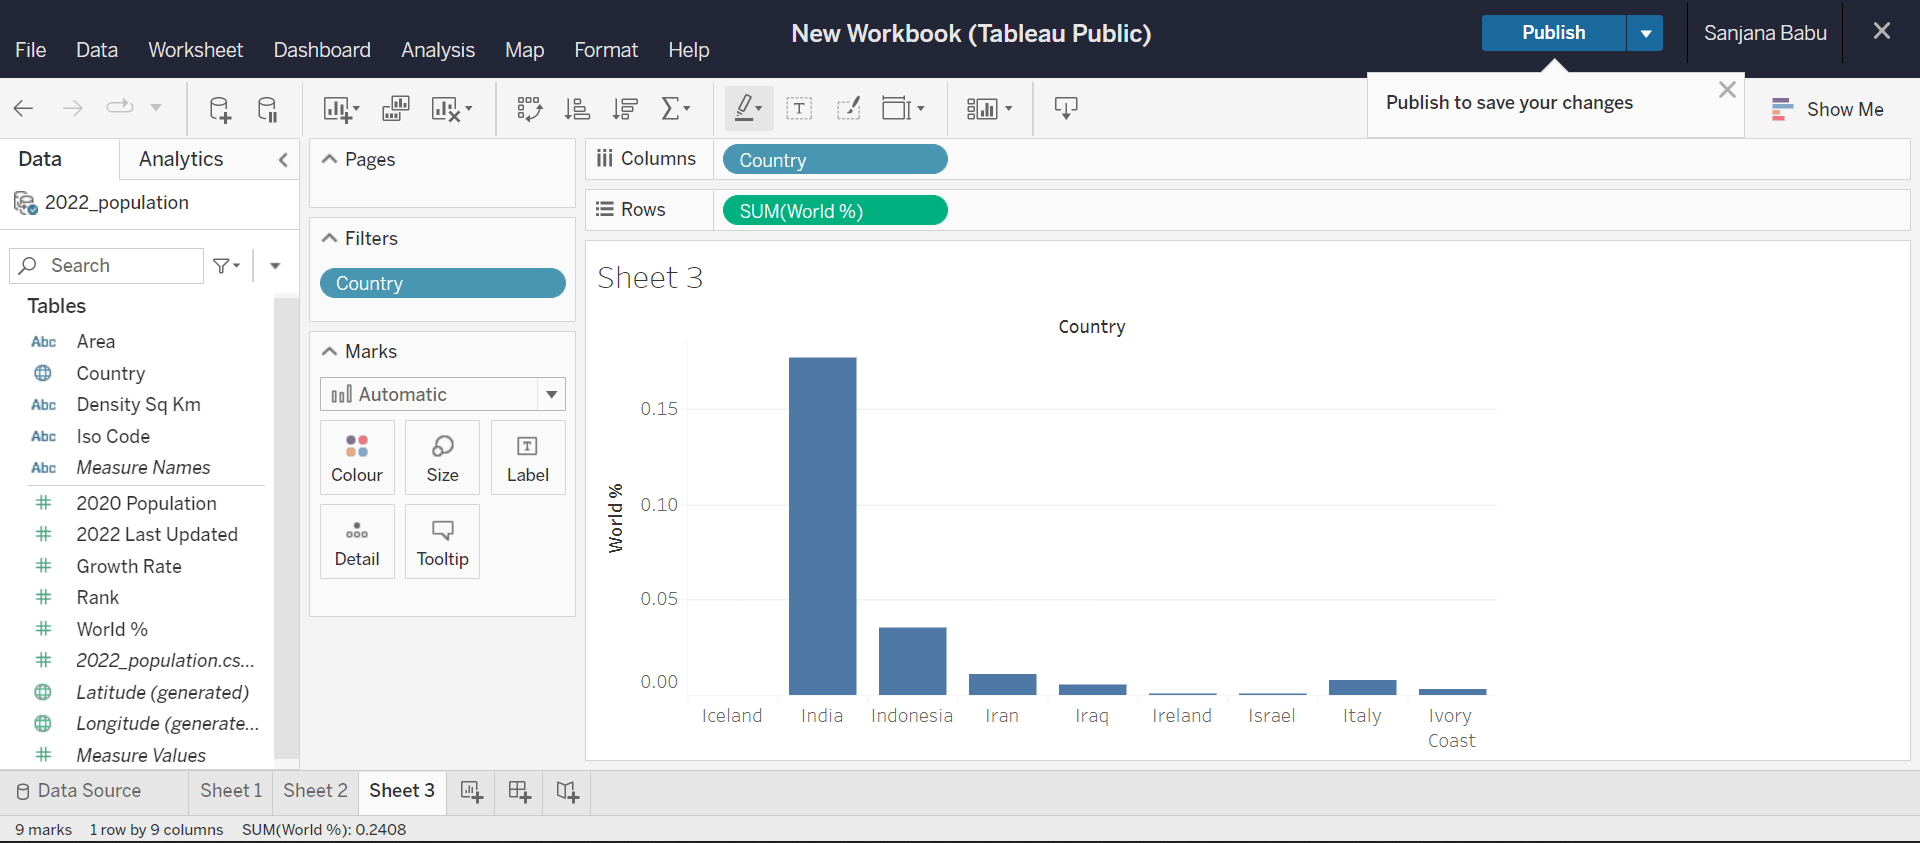
Here too, the colour of the bins can be changed by clicking on the 'Colour' option in the marks.
Pie chart
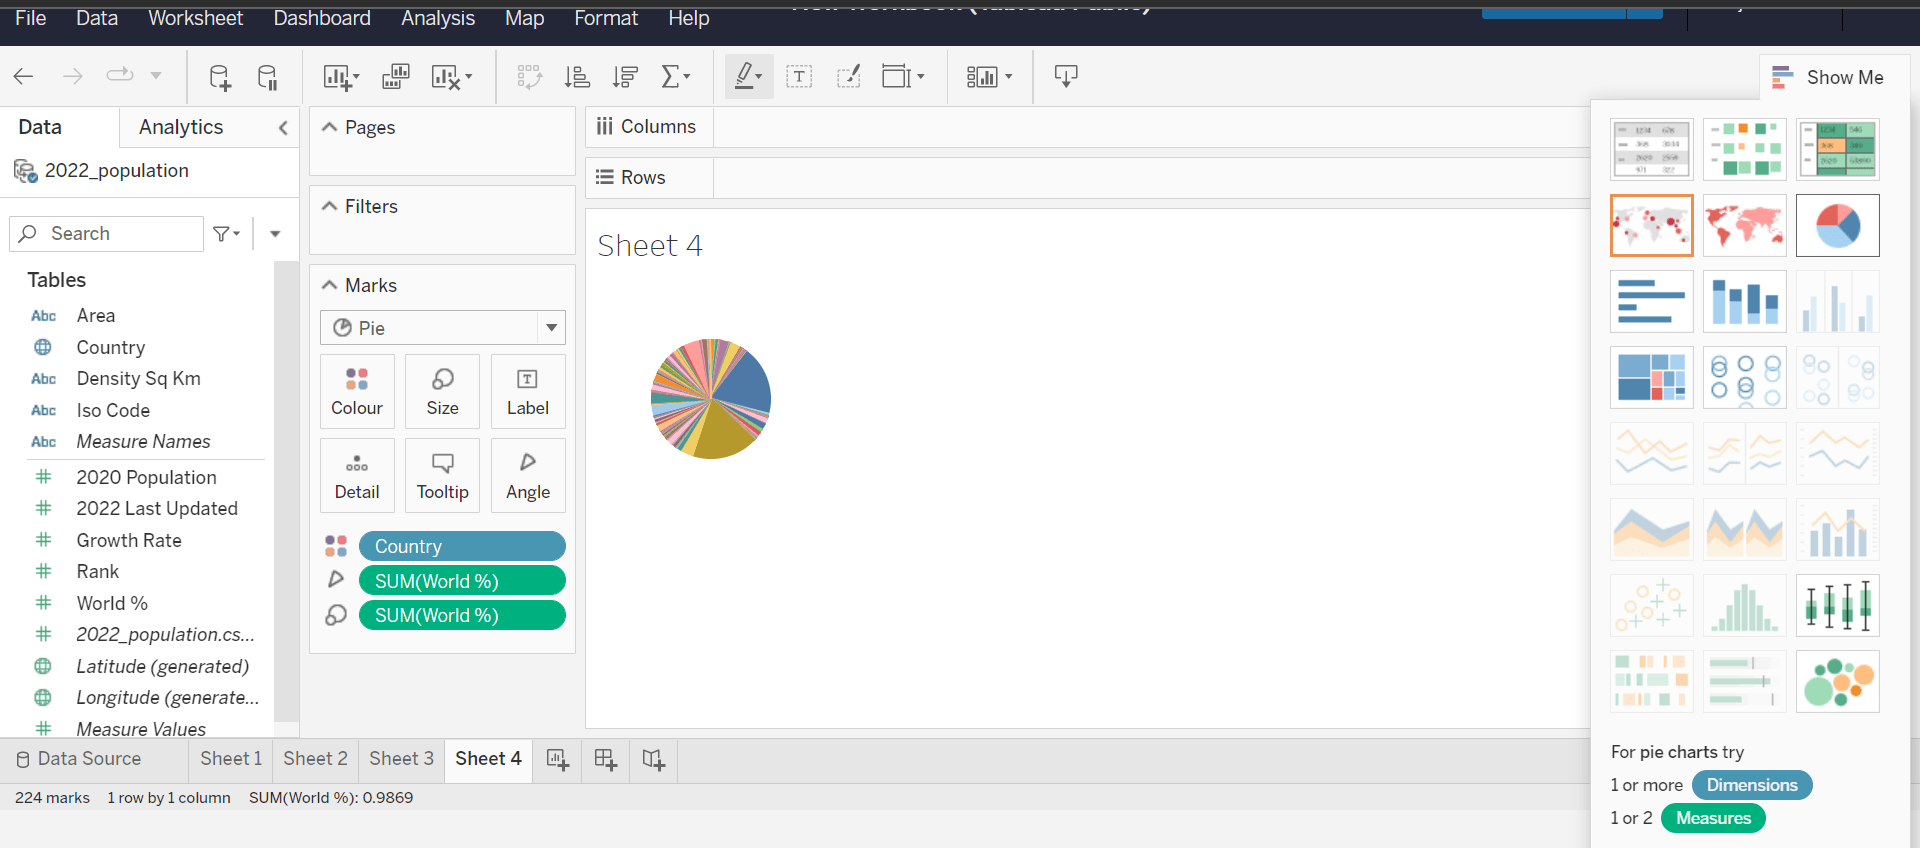
To create a pie chart in Tableau, add at least a dimension and a measure in the 'Rows' and 'Columns' section respectively. Click on the 'Show Me' button on the top right corner of your workspace. It will display the possible charts that can be created using the selected data. Select the pie chart from the menu. Your visualization will automatically be converted into a pie chart.
Bubble chart
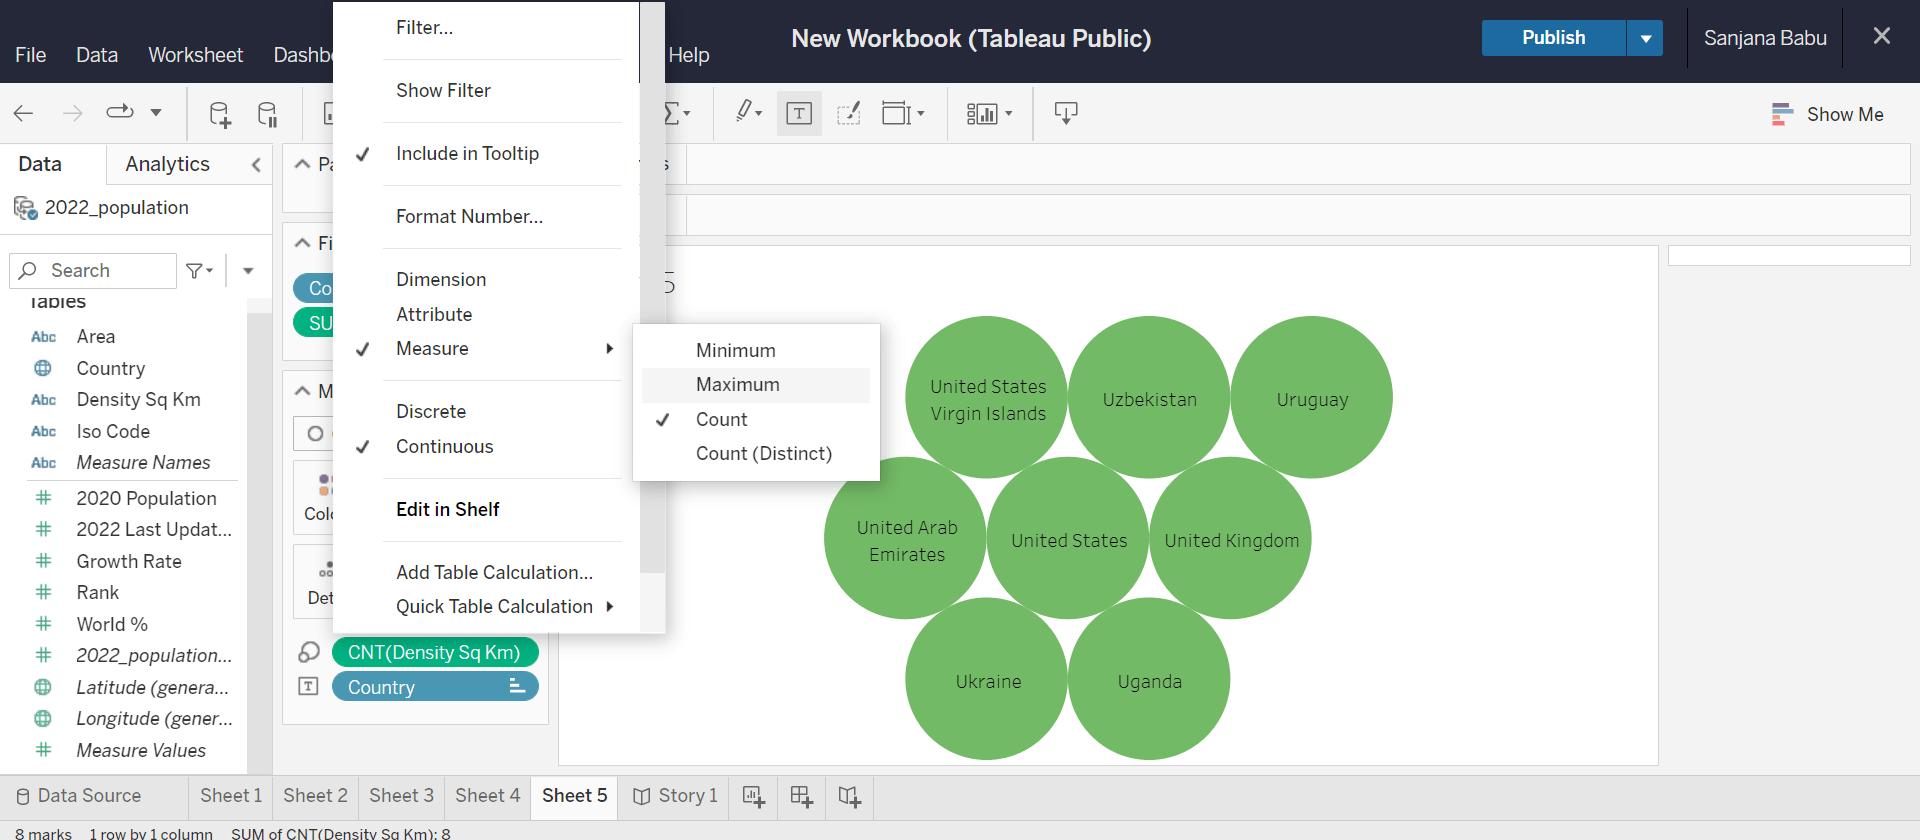
Now let us create a bubble chart where each bubble represents a country whose name starts with "U" and the size of the bubble corresponds to its maximum density per sq.km.
For this, in a new sheet, add 'Country' to label and 'Density Sq Km' to size in the marks section. Convert the dimension 'Density Sq Km' into a measure and set its aggregate value as 'Maximum', by clicking on that particular dimension in the marks section.
Make sure the chart type is selected as 'Circle' in the marks section.
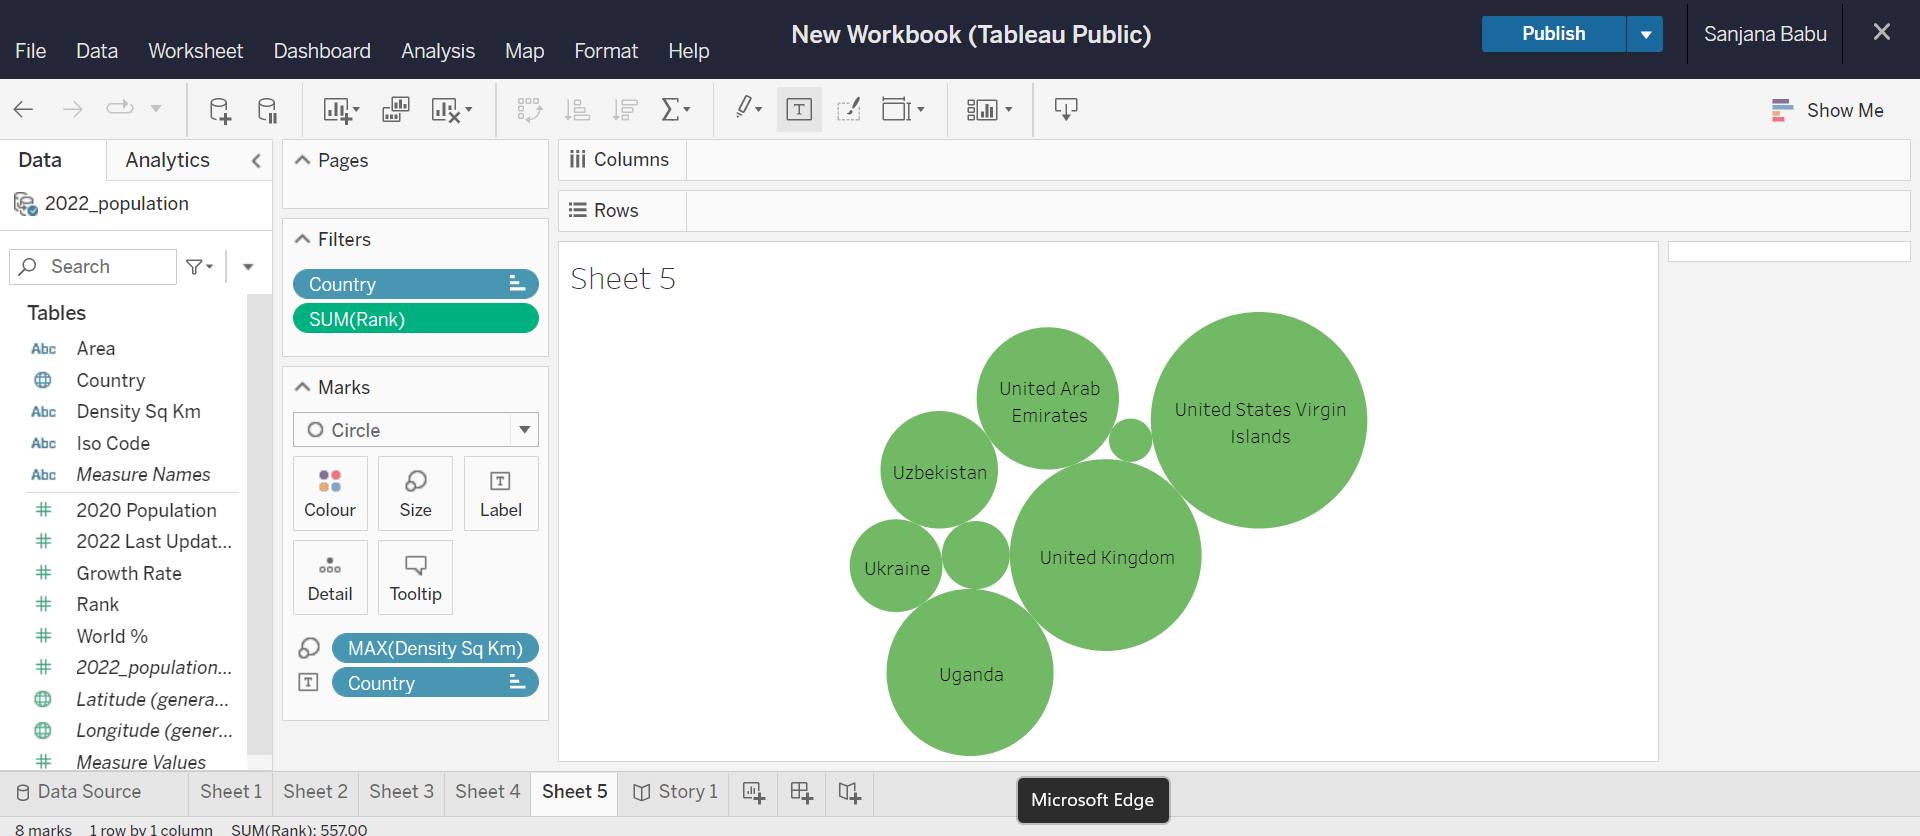
Now we have our bubble chart.
Creating a Story
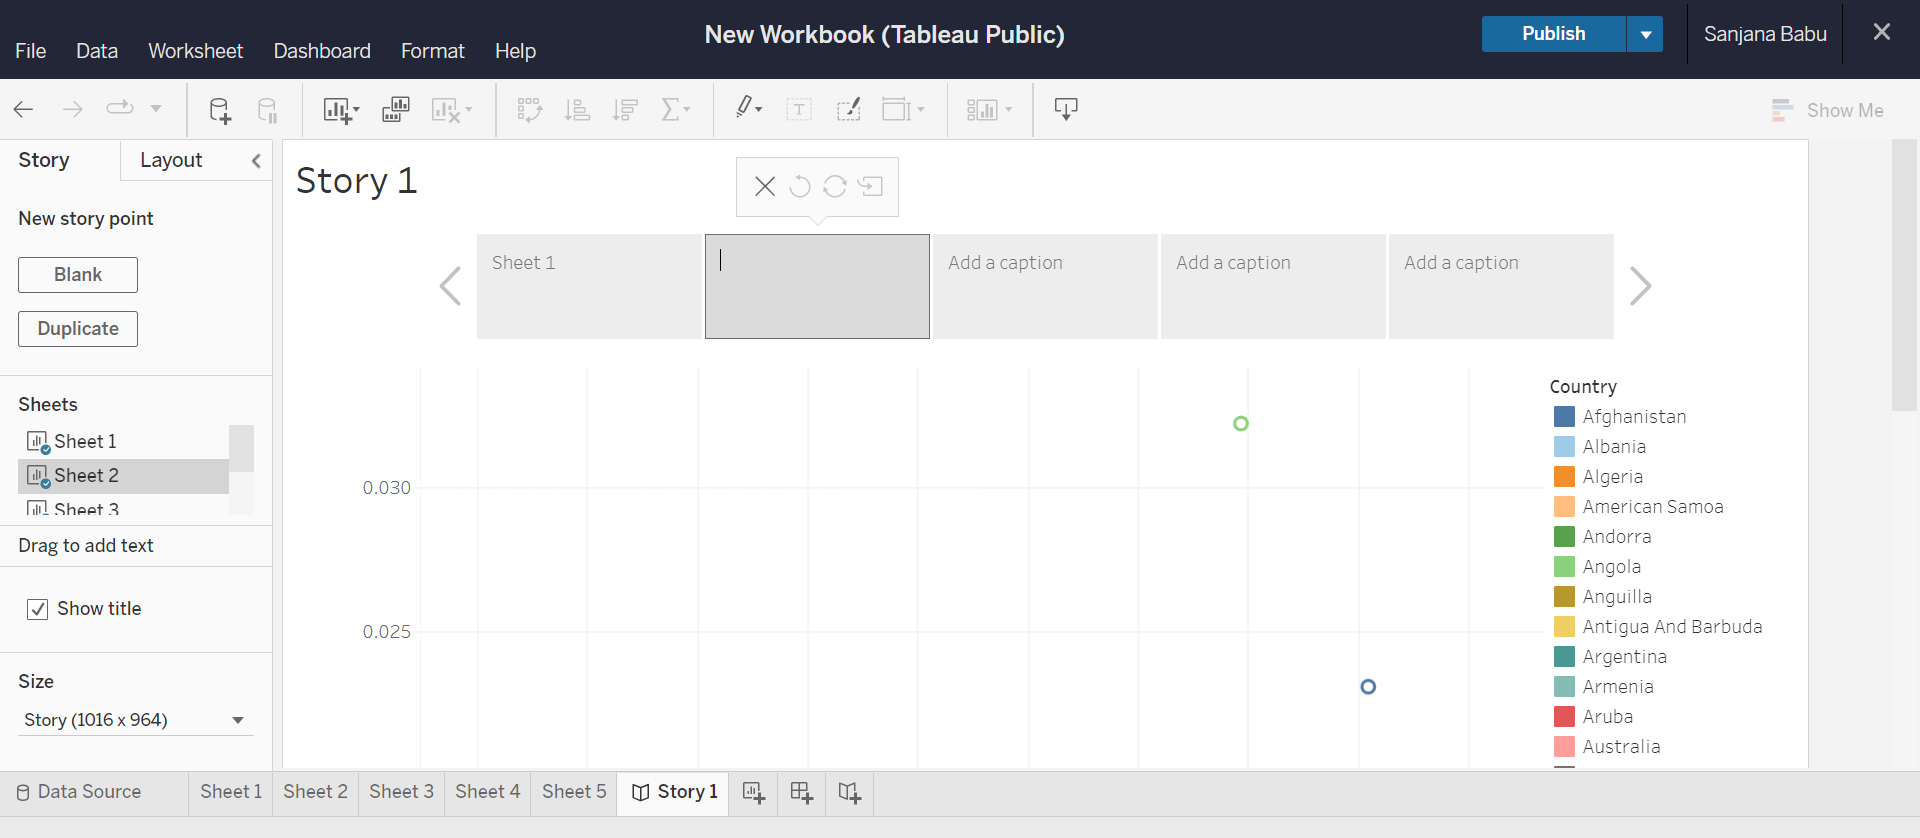
Tableau offers a cool concept of 'Story' which allows us to navigate to all our visualizations in the workbook from a single place. To create a story, click on the 'New Story' button in the bottom menu. We will have a list of all our sheets shown in the left. Drag and drop a sheet into the story. To add another sheet, click the 'Blank' option in the 'New story point' menu on our left.
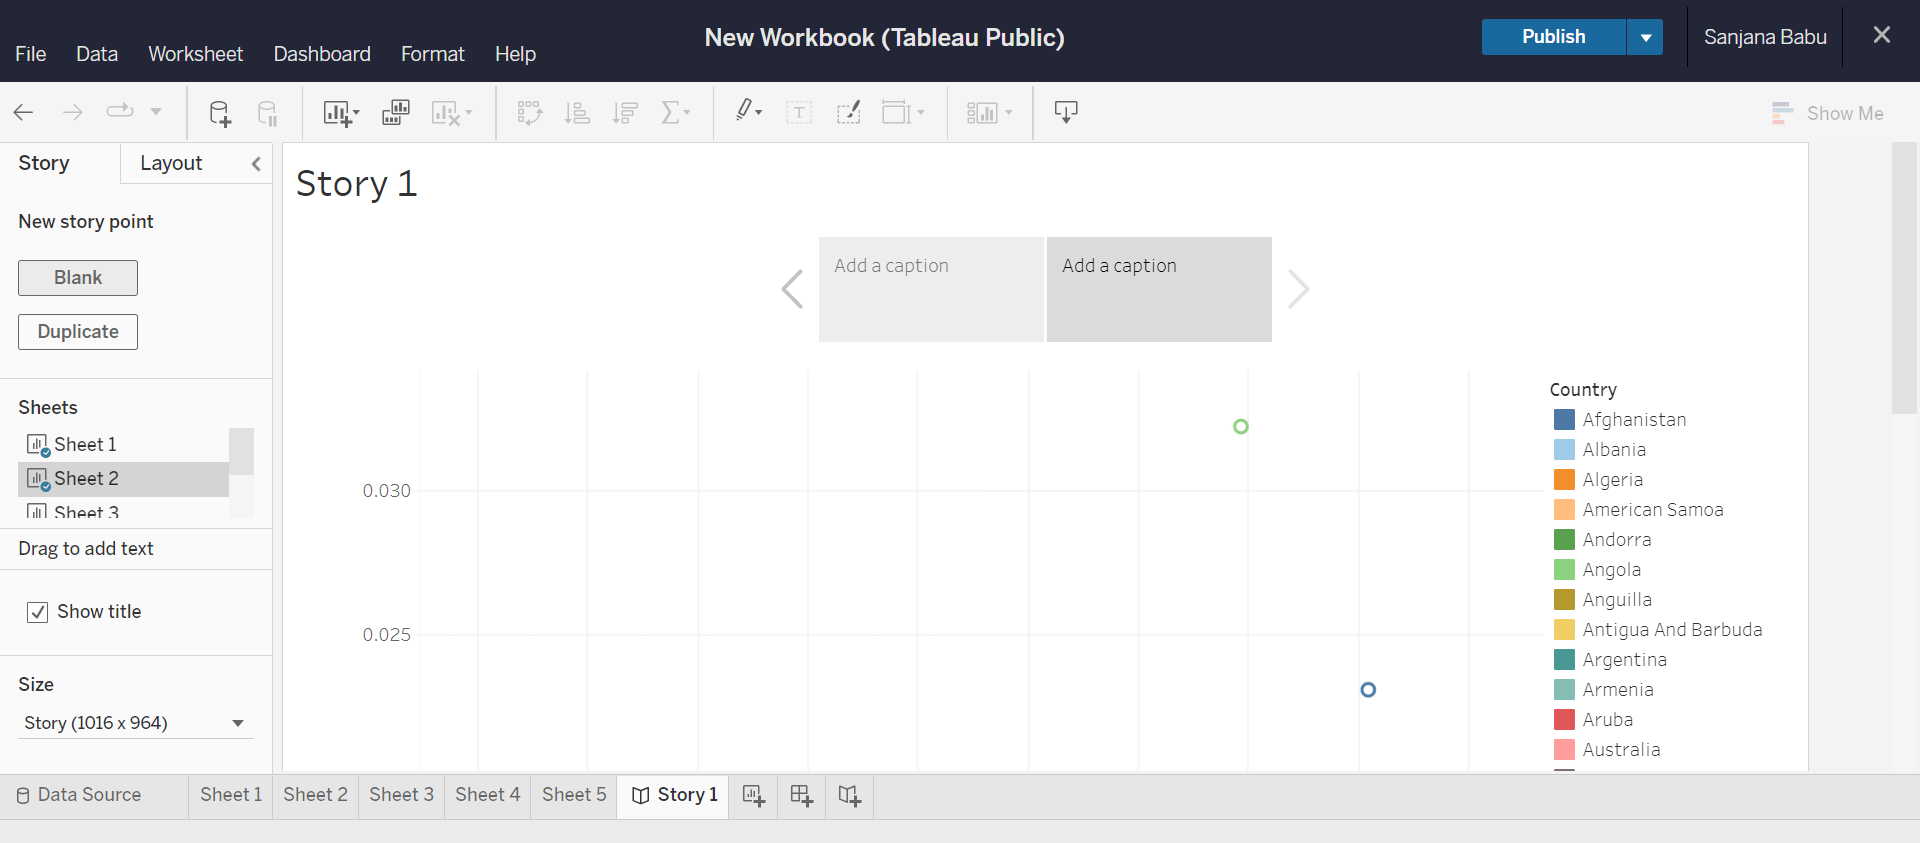
We can also add captions to each page in our story.
With this article at OpenGenus, you must have the complete idea of Data Visualization using Tableau.