
Open-Source Internship opportunity by OpenGenus for programmers. Apply now.
The law of large numbers is one of the intuitive laws in probability and statistics.
Table of contents
- Law of large numbers
- Weak Law of large numbers
- Strong Law of large numbers
Law of large numbers
In words, the law of large numbers states that As the number of trials or observations increases, the actual or observed average approaches the theoretical or expected average.
This makes it easier to predict how events will turn out in the long run and have confidence in our prediction made.
There are two variations of this law. The strong and weak law of large numbers. The weak law deals with the probability and strong law with the average.
Weak law of large numbers
The weak law of large numbers is also known as Khinchin's law. It states that the sample average converges in probabilty with the expected value.
Let us consider an example to understand this law better. We know that theoretically the probability of obtaining heads in a coin flip. How ever, it is not certain that we will get exactly 5 heads in 10 coin flips. We will consider each coin flip and plot the cumulative proportion of heads.
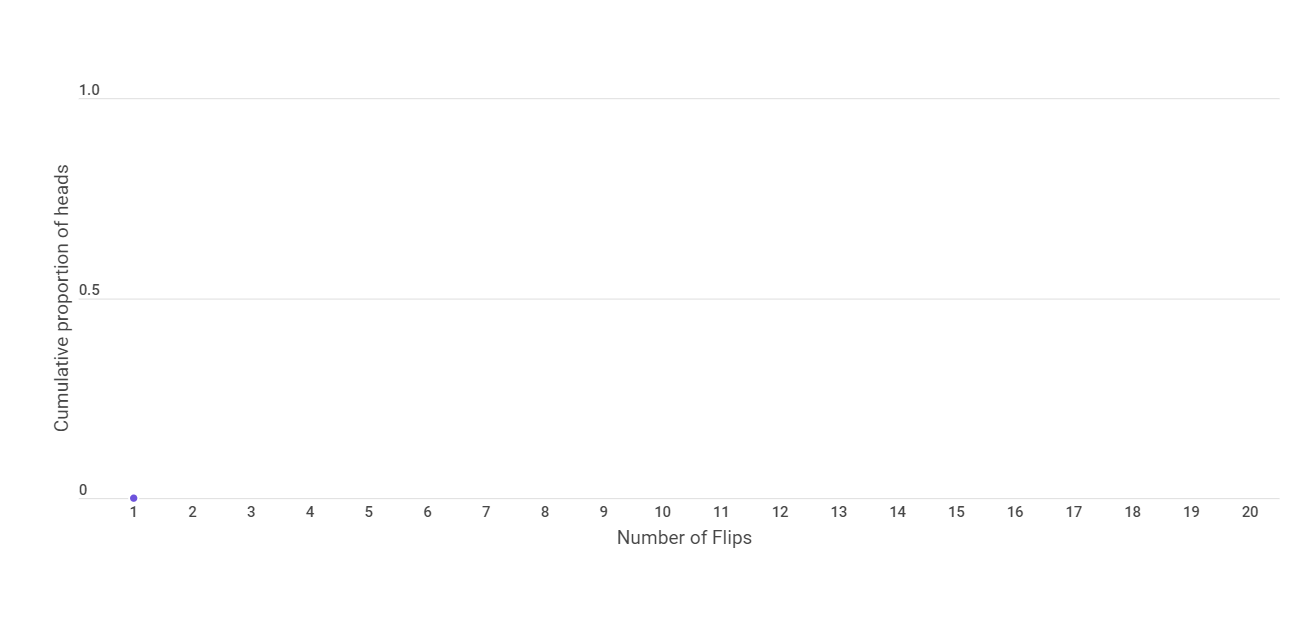
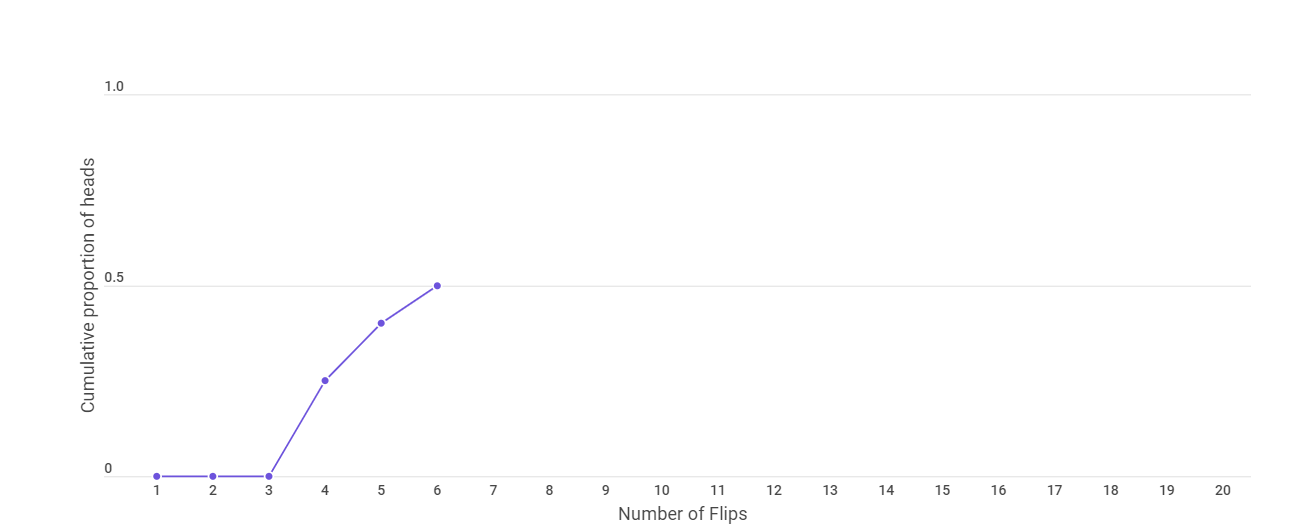
After the first flip, we get a tail. So our cumulative proportion of heads is 0.
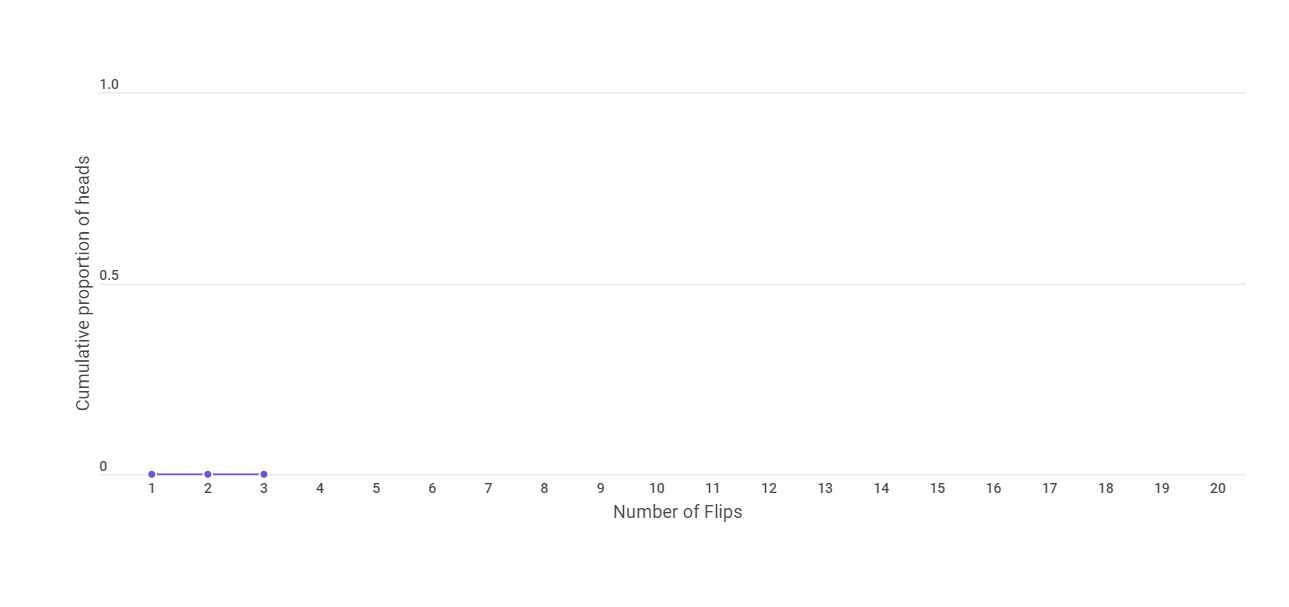
We get tail in our second adn third flip also. Hence the cumulative proportion of heads is still 0.
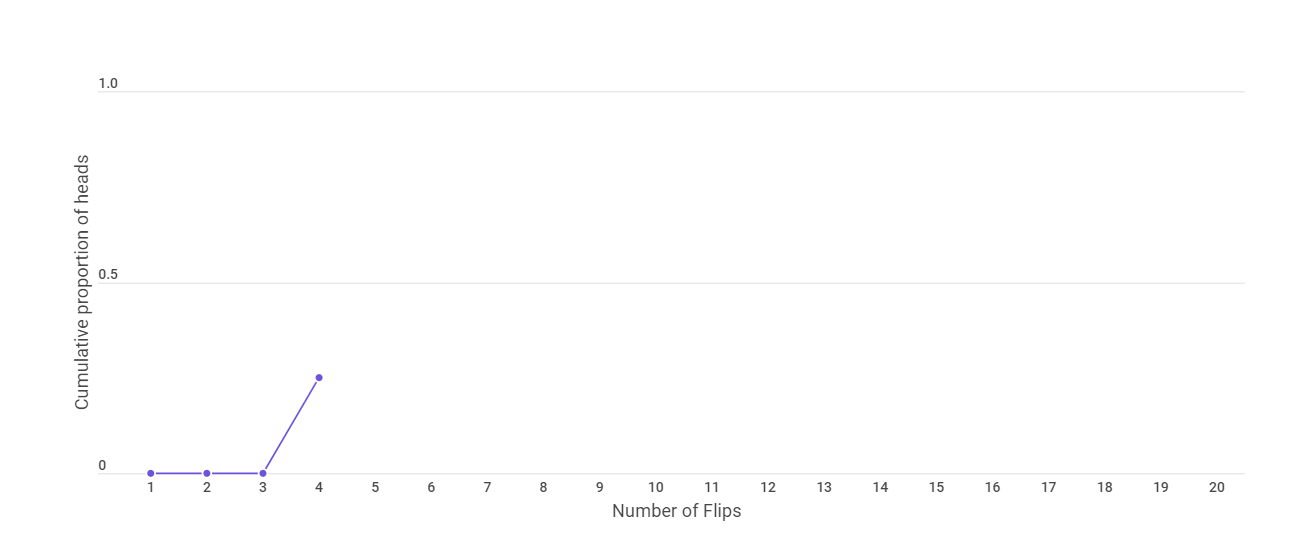
Now in the fourth flip, we get a head. This makes the cumulative proportion of heads as 0.25.
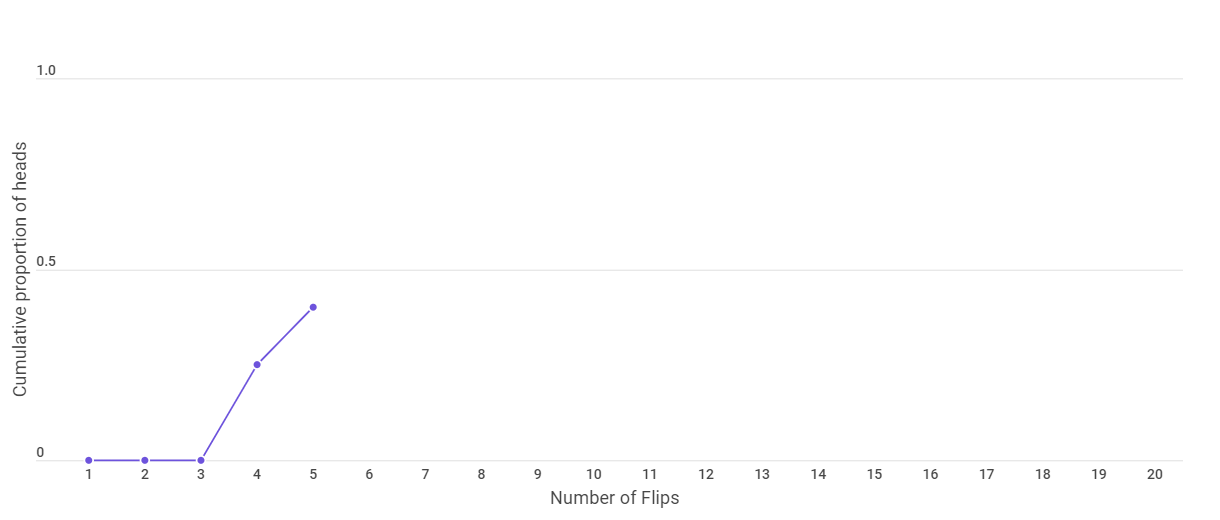
In the next flip too, we get a head ; which makes the cumulative proportion of heads to be 0.4 or 40%.
And the next flip too give a head, making our proportion of heads to be 50% which is the theoretical probability.
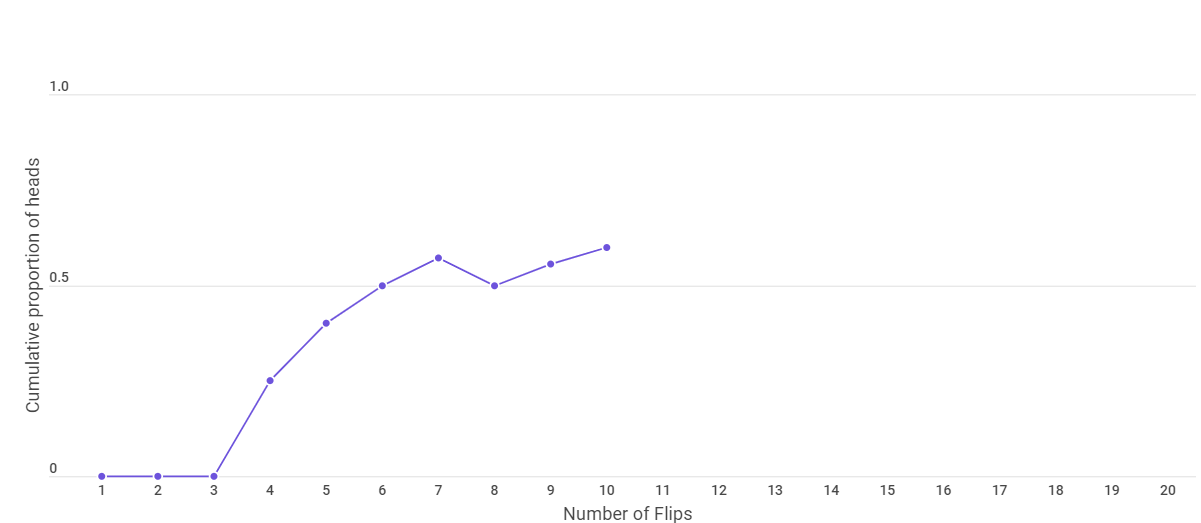
After 10 flips, the graph looks as follows.
The graph after 15 and 20 flips is given below.
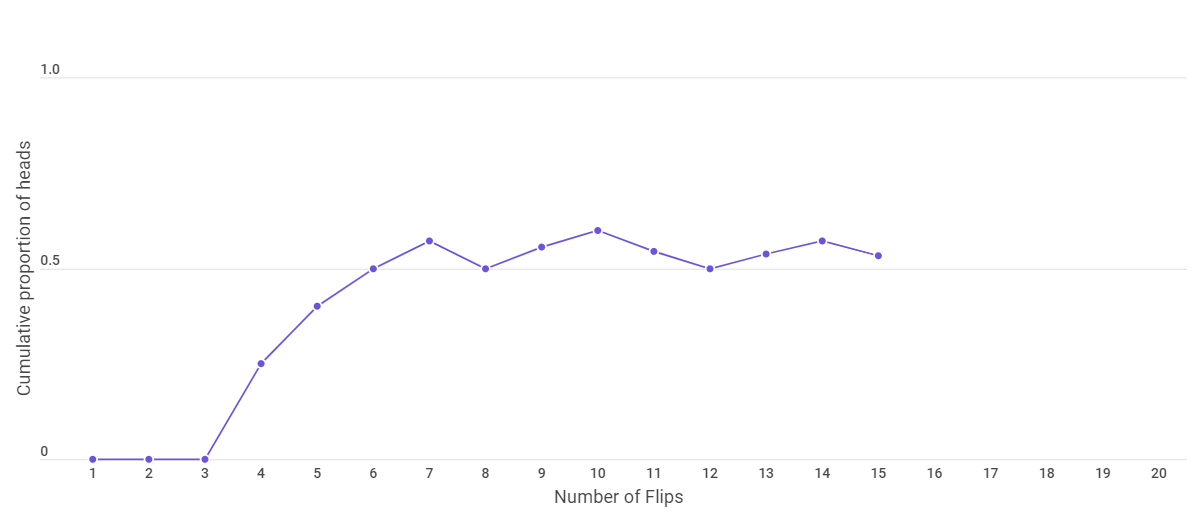
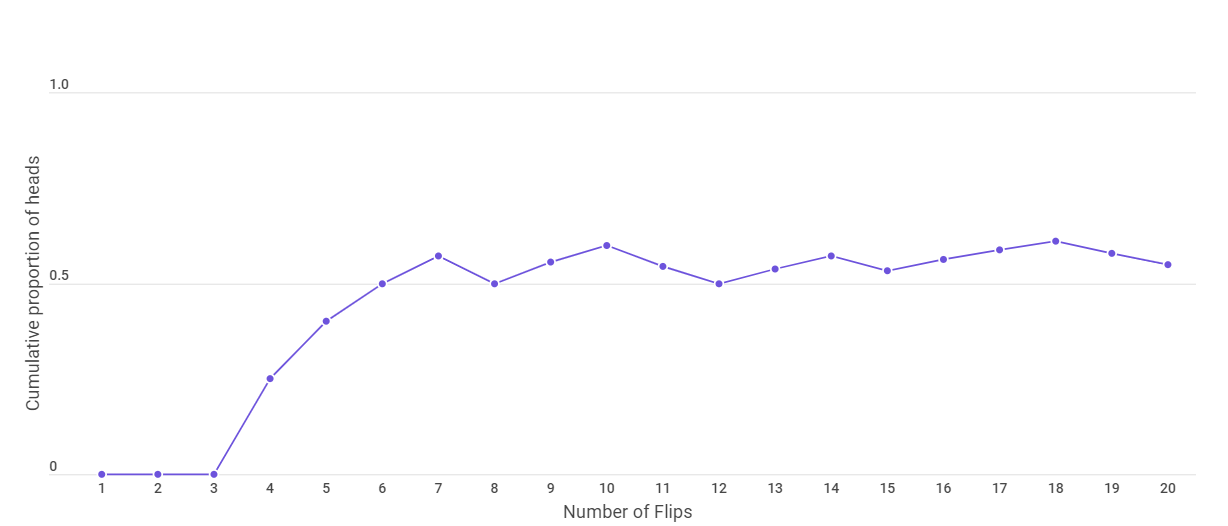
We find that the observed probability approaches the theoretical probability as we increase the number of flips. This is what is stated by the weak law of large numbers.
Strong law of large numbers
The strong law of large numbers is also known as Kolmogorov's law and it states that the sample average will be closer to the expected average as the sample size increases.
Let us see an example to understand this law. Let us consider a group of 100 people who have some number of cookies on the occassion of Christmas. And we want to know the average number of cookies they have.
If we ask the first person and she has 10 cookies, we have our first observation (10) which might be far away from the average of the group. After asking the second person (she has 20 cookies) and averaging the value (15), we are able to get a better estimate of the group's average. As we continue this process of adding observations and thereby increasing our sample size, we’ll generally get better and better estimates of the group’s average.
This is what is stated by the Strong law of large numbers.
