
Get this book -> Problems on Array: For Interviews and Competitive Programming
Reading time:
We know that K-Means calculates the mean of all the points in a cluster in every iteration, in order to proceed towards convergence. The Expectation Maximization Clustering algorithm is much more robust than K-Means, as it uses two parameters, Mean and Standard Deviation to define a particular cluster. This simple addition of calculating the Standard Deviation, helps the EM algorithm do well in a lot of fail cases of K-Means.
The normal or gaussian distribution is a continuous probability distribution. These distributions differ in their location and scale parameters: the mean of the distribution defines its location, and the standard deviation defines the scale.
Hence, wherever we talk about the parameters of the EM algorithm, we are referring to the mean and standard deviation that we are defining each cluster by.
As the name suggests, the EM algorithm is simply comprised of 2 steps, Expectation and Maximization.
Intuition:
Suppose we have a bunch of data points, and suppose we know that they come from K different Gaussian distributions.
Now, if we know which points came from which Gaussian distribution, we can easily use these points to find the mean and standard deviation, i.e. the parameters of the Gaussian distribution.
Also, if we know the parameters of the Gaussian distribution, we can guess which Gaussian distribution each data point is more likely to be a part of, using probability values.
So we need parameters to guess where each point came from, and we need to know where each point came from to estimate the parameters of the Gaussian distributions.
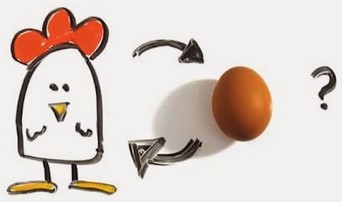
This is similar to the Chicken and Egg problem, as we need one to estimate the other, and the other to estimate one.
This is where the EM Algorithm is efficient.
It starts out with placing K Gaussian distributions randomly. These random Gaussian distributions will have parameters (mean and standard deviation). Now, for each data point, we can find out the probability of being in each Gaussian distribution. Once it has computed the probabilities, we can iteratively compute the parameters of the Gaussian distributions, to find the new mean and new standard deviation, such that it fits the assigned points better. We keep iterating till we reach convergence.
Understanding the algorithm
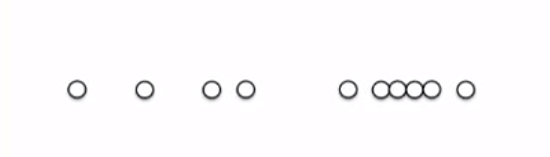
Let's take an example of a few points in 1 dimension, for which we have to perform Expectation Maximization Clustering.
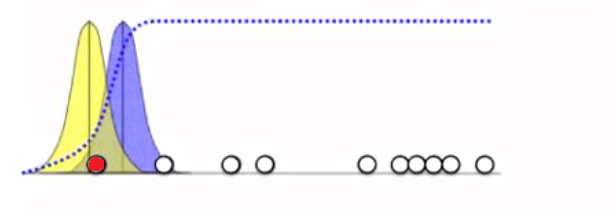
We will take 2 Gaussian distributions, such that we'll find each point to belong to either of the 2 Gaussian distributions. Our 2 Gaussians here are shown in Blue and Yellow. Our 2 Gaussians have the same variance in this case, and their mean is at their respective centers.
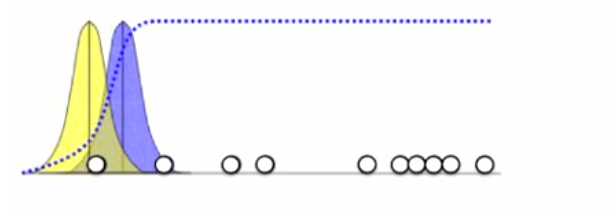
What we will try to figure out initially, how likely each of the points are to belong to the blue or yellow distribution. Let's take the points marked in red, to analyse how our algorithm will work.
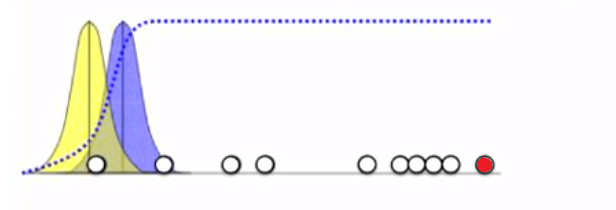
For the point as shown in the figure, on calculating probability, and even obviously, we can confidently say that it is much more likely to lie on the Blue Gaussian than the Yellow one.
However, for the point shown in the following figure, it is much more likely to fall in the Yellow distribution, than the blue one.
Similarly, we will calculate the probability of each point for lying in the blue and yellow distributions, and colour it according to the likeliness of blue and yellow:
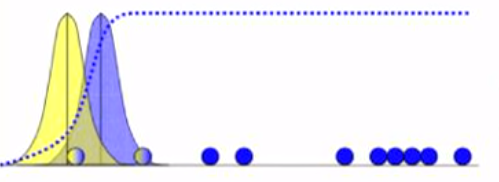
We notice, that this is just like K-Means, except that in K-Means, we would've fully coloured each point, whereas we fractionally colour each point in EM Clustering.
This way, each point belongs to both yellow and blue distributions.
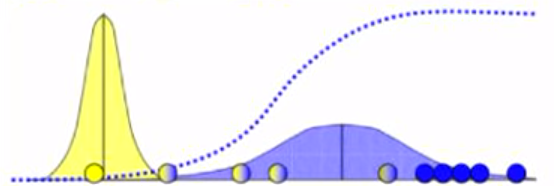
Now that we have the probability of each point lying in the blue and yellow distributions, we use these values, to calculate the new mean and new variance of the 2 distributions. We use this new mean and variance to plot our new blue and yellow distributions
Quite obviously, the one 'majority' yellow point will keep the yellow gaussian almost at it's place, whereas the many 'majority' blue points pull the blue gaussian towards the right
We repeat the same procedure of using the new gaussian distributions with the points, for our second iteration, and solve to get an updated distribution. We can go on to solve for multiple iterations, and our final distribution would look similar to this:
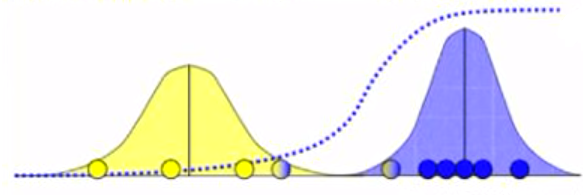
This is the procedure to estimate the means and variances, just beginning with a set of points. That is how Expectation Maximization Clustering algorithm works.
Simplified steps of EM Clustering
Initially,we set the number of clusters K, and randomly initialize each cluster with Gaussian distribution parameters.
STEP 1: Expectation: We compute the probability of each data point to lie in each cluster.
STEP 2: Maximization: Based on STEP 1, we will calculate new Gaussian parameters for each cluster, such that we maximize the probability for the points to be present in their respective clusters.
Essentially, we repeat STEP 1 and STEP 2, until our parameters remain the same.
Soft Clustering
Hard clustering means we have non-overlapping clusters, where each instance belongs to one and only one cluster. In a soft clustering method, a single individual can belong to multiple clusters, often with a confidence (belief) associated with each cluster.
Expectation Maximization Clustering is a Soft Clustering method. This means, that it will not form fixed, non-intersecting clusters. There is no rule for one point to belong to one cluster, and one cluster only. In EM Clustering, we talk about probability of each data point to be present in either of the clusters. It is completely possible for multiple clusters to partly share a portion of the data point, since we are only talking about respective probabilities of the point with respect to the clusters.
What do we do when a point is equidistant from 2 clusters?
One interesting thing to note here, is the case when a cluster has a 50/50 chance of being in either of 2 clusters. This is where soft clustering is different from hard clustering. The point can mutually co-exist as a part of either cluster, as we represent the probability instead of being deterministic. In an algorithm like K-Means, it would've been assigned to either cluster depending on how the clusters are initialized.
Comparison with K Means
K-Means
- Hard Clustering of a point to one particular cluster.
- Cluster is only defined by mean.
- We can only have spherical clusters
- It makes use of the L2 norm when optimizing
Expectation-Maximization
- Soft Clustering(It gives a probability of any point belonging to a cluster).
- Cluster is defined by mean and standard deviation
- We can have elliptical clusters too
- It does not depend on L2 norm, but is based on Expectation, the probability of the point belonging to a particular cluster. This makes K-means biased towards spherical clusters.
K-means is a variant of EM, with the assumptions that clusters are spherical.
Application
- Image segmentation
- Estimating motion models for tracking
- Hidden Markov Models