
Get this book -> Problems on Array: For Interviews and Competitive Programming
In this article, we discuss the voronoi diagram in depth and how to use Fortunes Sweep Line algorithm to compute it. This is an important topic in Computational Geometry.
Table of contents:
- Introduction to Voronoi Diagram
- Simple case
- More points
- Voronoi cells, edges and vertices
- Voronoi cell
- Voronoi edge
- Voronoi vertex
- Shape and complexity of voronoi diagram
- Characterization of voronoi vertex and edges
- Alternative definition
- Computing the voronoi diagram (beach line)
- Brute force Approach
- Optimized approach
- Relationship between beach line and voronoi diagram
- Fortunes sweep algorithm
- Time and Space Complexity Analysis
Introduction to Voronoi Diagram
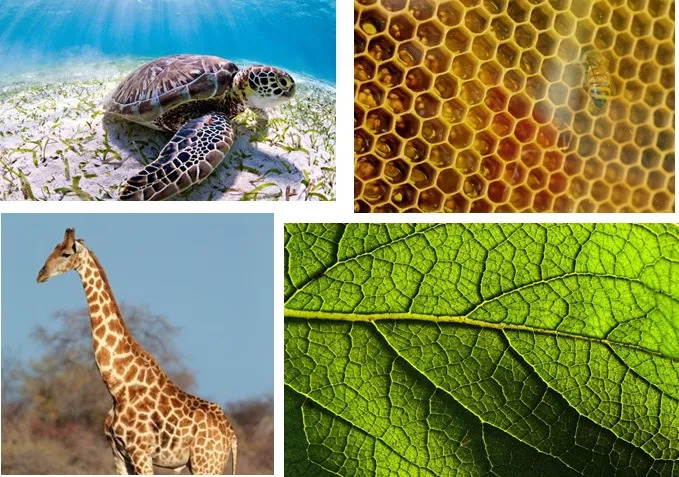
The pictures above show voronoi diagrams in nature.
Imagine a city with a number of hospitals, post offices or schools. When a person needs a service from one of these institutions, we would like them to go to the nearest institution from where they are.
We need a map showing the institution's catchment area such that for anyone in that area, the institution is closest to the person than any other.
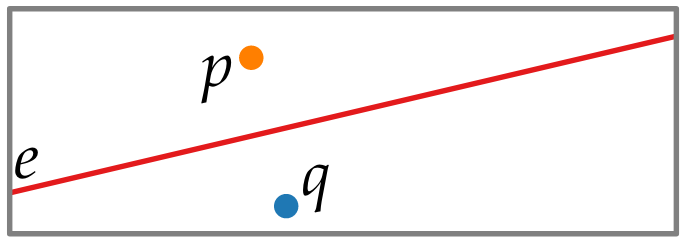
Simple case
We have two hospitals on a map and we need to decide which is closest. To decide we pre-process the whole map and find out before hand every point closest to the hospitals in the map.
Take a look at the image.
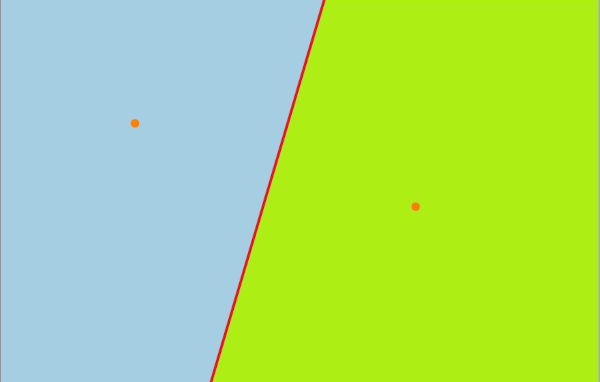
We divide the map into two regions whereby each region knows the closest hospital.
After that we just have to figure out which region we are in and the hospital in that region is the closest to where we are.
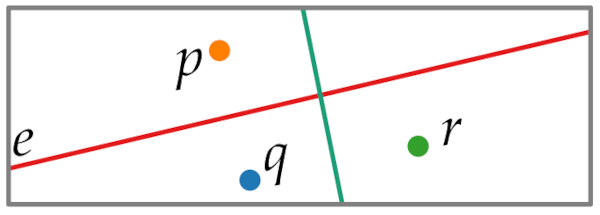
Formally, we take the bisection of the two points, if we are on the right side then q is the closer hospital and vice versa. If we are on th border then we can choose either hospital.
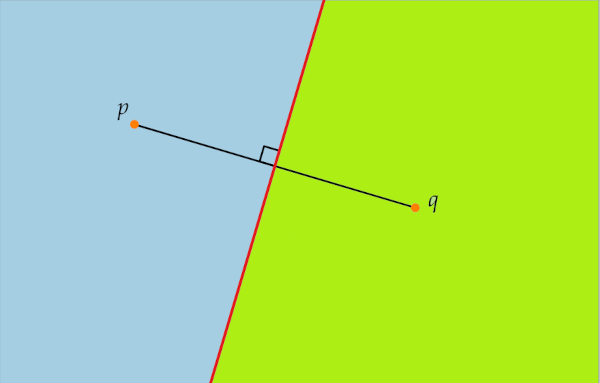
If we join the segments between p and q, the we define the bisection of p and q as the set of all points in the plane where the distance to p is the same as the distance to q.
This is denoted by the red line.
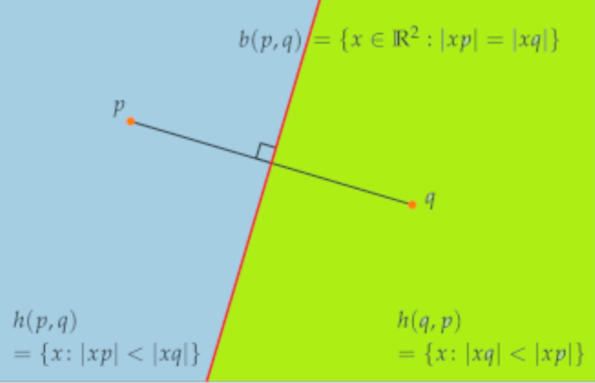
, where points for distance to p is smaller than distance to q
, where points for distance to q is smaller than distance to p
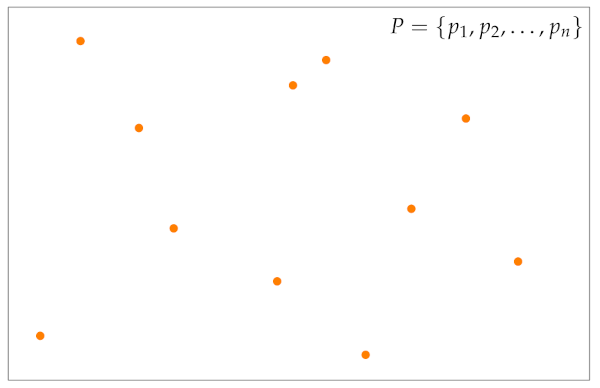
More points
We have n number of hospitals in a map denoted by the orange dots.
Using the above analogy of intersection of points, given the map above if we continue intersecting regions until we have accounted for all hospitals in the region. We end up with the diagram below.
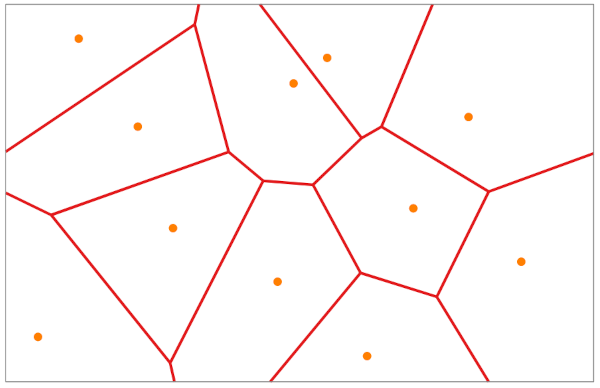
The diagram is the division of the map into points that are closer to one of the given points than any other. This is called a voronoi diagram.
Voronoi cells, edges and vertices
Given a set of points we will define the above in terms of these points.
We also have the voronoi diagram vor(P).
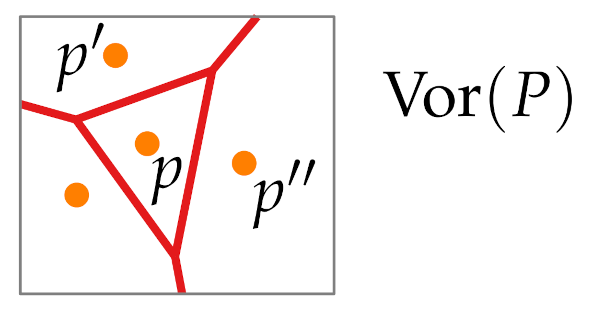
Voronoi cell
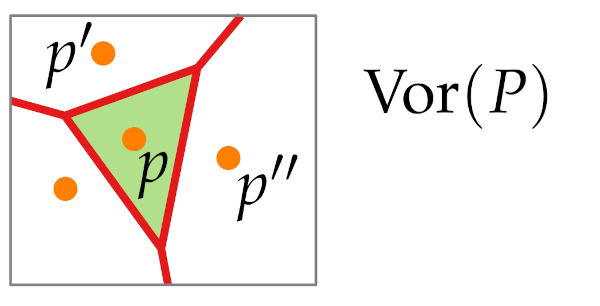
A voronoi cell of a single point p is defined as a set of all points in a plane where the distance to p is smaller than the distance to all other points of this set.
To get a cell, just like the two point case we can use a bisector that will give us region of the cell of each of these points, we do the same for all pairs of points we find the half plane that is closer to p than to another point q, then we intersect these to get the exact cell.
A vornoi cell exists for all points in the diagram, that is each point has to ie in its own voronoi cell.
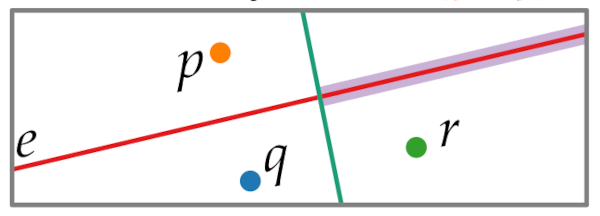
Voronoi edge
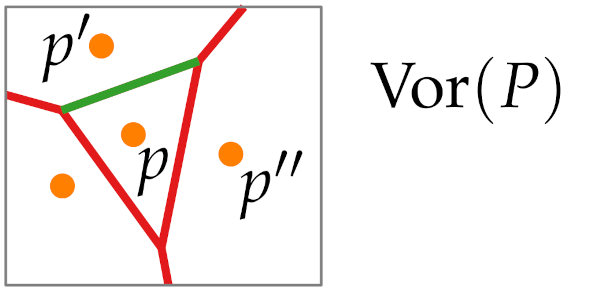
We define it using two points. Its an edge between cell p and
These are the points that are closer to both p and and there is no other point that is closer.
We can find it by intersecting the boundaries of the voronoi cells, note: they could give an empty set.
We also need to exclude the ends(voronoi vertex) of the segments and only deal with the relative interiors(relInt) of the intersection.
Voronoi vertex
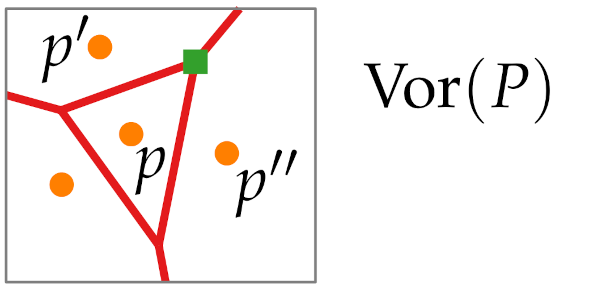
We define it using 3 points , where the boundary of voronoi cell of the 3 points meet.
It has 3 closest points in the set, all the 3 points have the same distance from it.
It has the same definition as the edges but with 3 points instead of 2.
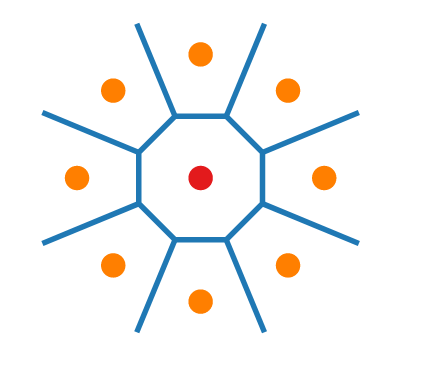
We can also have many points with the same distance, e.g; all points lying around a circle center, and if we stand at the center all points will be the same distance.
With that we conclude that a voronoi diagram V(P) is a sub-division of a plane and also a geometric graph.
That is vertices and edges describe a geometric graph, and the cells act as the faces.
Shape and complexity of voronoi diagram
Theorem: Let be a set of n points (sites). If all sites are collinear, vor(P) will consist of n - 1 parallel lines, otherwise vor(p) is connected and its edges are line segments or half lines.
Proof 1, (n-1 parallel lines).
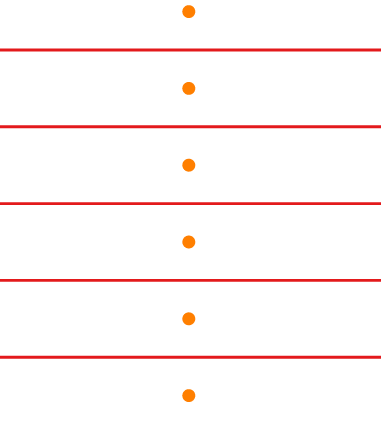
Considering the image above, we see that each two points are separated by a line, the voronoi diagram will be the set formed by the parallel lines.
proof 2, (non-collinearity).
We assume vor(P) contains an edge e that is a full line e=b(p, q).
We want to show that it is connected and its edges are line segments or half lines, (no lines).
let is not parallel to e.
is closer to r than to p and q.
We see e cannot completely lie inside voronoi diagram, therefore e is bounded to at least one side.
Proof 3, Non-connectivity.
We argue that there is a bisection between the two points which connects the two parts.
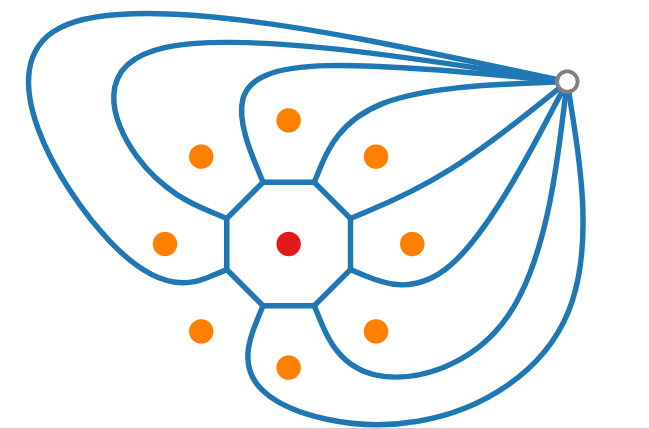
Complexity
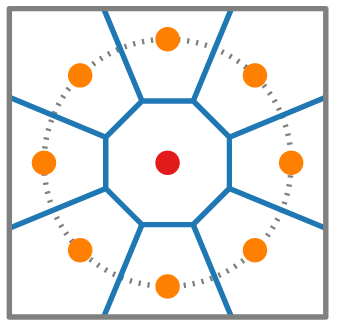
The middle cell shares and edge with all vertices that lie in the circle.
This show linear complexity for each cell which is quadratic for when it comes to the whole vornoi diagram.
However;
Theorem: Given a set of n sites, we state that Vor(P) consists of at most 2n-5 vertices and 3n -6 edges
We have n faces, 1 face for every site, every voronoi cell is a face.
Proof. (2n - 5) vertices.
Proving this will later translate to 3n -6 edges.
Consider the voronoi diagram below,
We have a connected planar graph, we can use Euler's polyhedron formula.
To overcome unbounded edges we use a dummy vertex therefore we have a planar graph whereby each edge has 2 endpoints.
We have n faces, therefore using the formula, number of vertices - number of edges plus number of faces is 2, we also include dummy vertex.
To estimate |V| and |E|, we make an observation that all vertices have a degree of 3, because 2 becomes a voronoi edge it will lie between two sites.
If we look at all voronoi vertices and count edges around each, we will have counted at least 3 for every vertex.
We counted the edges twice therefore, twice the number of edges is at least thrice the number of vertices.
minimum degree 3
Using the polyhedron formula.
with that we have proved for 2n - 5.
plug it into we find that the edges are at most 3n - 6.
Characterization of voronoi vertex and edges
We have defined intersection of half planes, intersection of the cells and intersection of 3 cells.
These computations are time consuming, that is finding a vertex with the intersection of 3 cells, we take triplets of cells which is cubic time complexity.
Alternative definition
For points in p, and any point x in the plane, the largest circle that is centered at x without sites in its interior is,
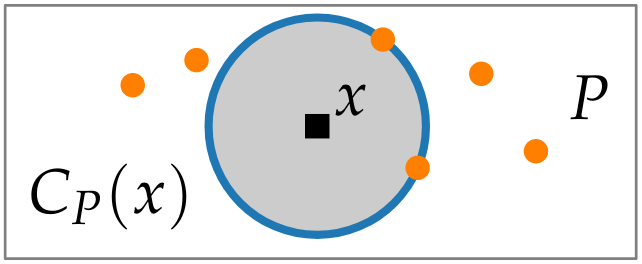
Therefore if we have a voronoi vertex, the intersection of the circle with sites set is at least 3.
There at least 3 vertices with same distance to x.
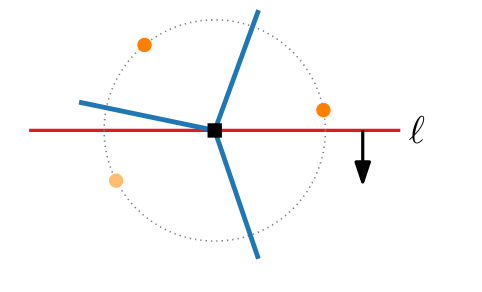
The bisection of 2 points , contains a voronoi edge iff there exists a point in the bisection such that largest circle centered at this point contains in its boundary.
Theorem:
(i) x Voronoi vertex
(ii) contains a Voronoi edge
- All cells are those where larger circle has ons side on boundary.
- All edges are those where large circle has two sides on its boundary.
- All vertices with 3 sides on its boundary.
Computing the voronoi diagram (beach line)
Brute force Approach
For each , compute .
We defined voronoi cells as an intersection between two half planes between two sites.
To compute a voronoi cell, we intersect n-1 half planes.
To compute the intersection we use line segment intersection algorithm.
The complexity for this algorithm is time.
By using half plane intersection algorithm we can do it in nlogn time.
For n sites, we have time complexity.
These are not optimal considering voronoi diagram has a linear time complexity.
Optimized approach
Given the diagram below, we can opt to use sweep line algorithm..
We perform a sweep from top to bottom and end up at a vertex.
The problem arises when we arrive at a vertex without exploring all points in the diagram.
We can opt to continue sweeping but we then have to come back to the vertex and restart the process of discovering points until all points have been explored, this takes us back to time complexity.
Solution
Fixed points , we take a single site, we find a point where distance to the site is same as distance to the sweep line.
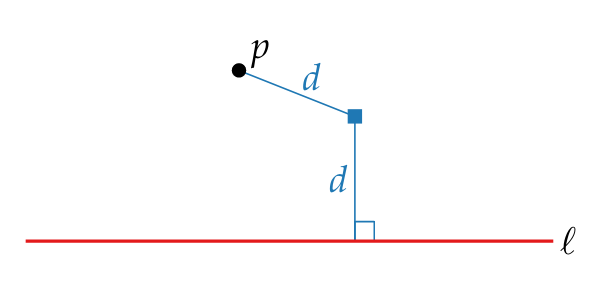
Given the fixed point x we know that no other points can be closer to point p than x therefore we know all fixed points where the distance from point p is same as distance to sweep line.
That is all points on the parabola.
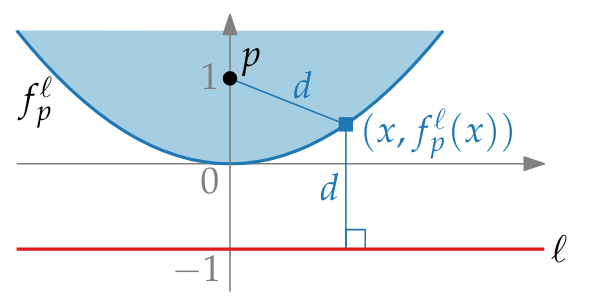
We define this parabola as the parabola with focus p and directrix l, for p=(0,1) and l:y = -1.
For a single site, for all points on the parabola and above the parabola, we have fixed points.
Therefore if we take all points and compute all parabola and take the lower envelope(beach line) of the union we would know what is fixed on the parabola and what is above the beach line woud also be fixed.
beachline = lower envelope
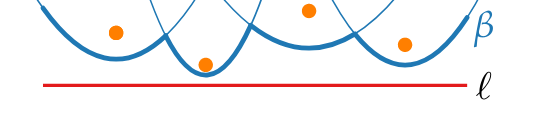
Given the 4 sites, we compute the 4 parabolas, and consider the beach line. Therefore everything above the beach line is fixed.
The points will be closer to a visited site than to a unvisited site.
From there we handle sites on or below the beach line.
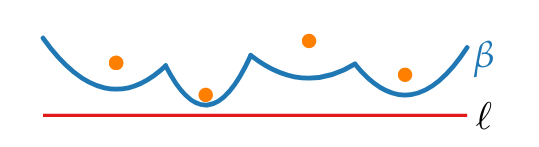
Observation: is x-monotone
Relationship between beach line and voronoi diagram
The links below should redirect you to a visual graph the shows how fortunes algorithm computes voronoi diagram.
This should give us a firmer grip on the concepts discussed and the ones we are about to discuss.
beach line visualization
beach line visualization video
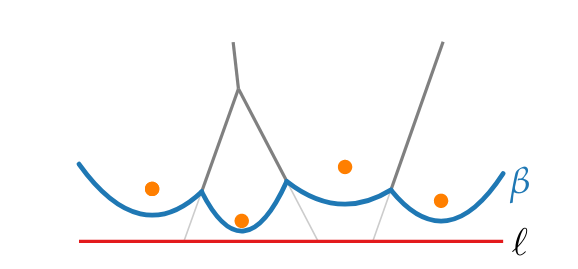
As we have seen from the cisual tools, we can construct a voronoi diagram using a sweep line and a beach line.
Notice how the parabolas intersect at the edges which gives the voronoi edges.
Also notice how the parabolas meet at the intersection of voronoi vertices where the distances from the sweep line to each site is equal.
We see that a voronoi diagram can be constructed from beach line and sweep line.
Note: The break points of the beachline trace out of the voronoi edges.
Lemma:
New arcs on only appear through site events, that is when sweep line l reaches a new site.
Corollary: consists of at most 2n - 1 arcs.
The first site gives 1 arc then every new one splits an old arc into two parts.
Circle events: this is when sweep line l reaches the lowest part of a circle through three sites above l whose arcs are consecutive on the beach line.
We get a voronoi vertex.
Lemma:
Arcs disappear from beach line only at circle events.
Lemma:
Voronoi vertices correspond 1:1 to cicle events.
Fortunes sweep algorithm
We know that we only have compute the beach line at each point to find the voronoi diagram.
Fortunes sweep algorithm
VoronoiDiagram(pCR^2)
Q <- new priorityQueue(P) //site events sorted by y-coords.
T <- new balancedBinarySearchTree() //store sweep status beachline
D <- DCEL() //save voronoi diagram
while not Q.empty() do
    p <- Q.extractMax()//take next event
    if p is a site event then
        handleSiteEvent(p)
    else //it is a circle event
        disArc <- arc on beachline that will disappear
        HandleCircleEvents(disArc)
return D.
Explanation:
- Start with a priority queue which contains all site events sorted by the y-coordinate.
- We store the sweep status in a balanced binary search tree which contain all parabolas that define the beach line, at most 2n-1.
- We use a doubly connected edge list graph data structure where we shall save the voronoi diagram.
- We traverse the event queue, and handle events.
- If it is a site event, we use subroutine handle site event(p)
- If it is a circle event, we find the disapperring arc and use subroutine handle the circle event(arc).
- In the end the all parabolas are part of the beach line, in the binary search tree they give unbounded edges that go to infinite. * We return the data structure D.
Handling Site event
When sweep line finds new site.
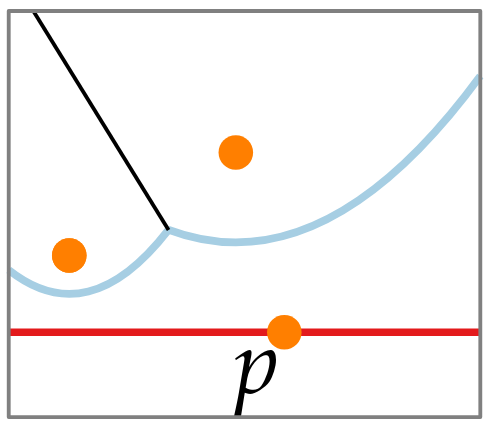
A new parabola starts at p.
- We find the arc that is vertically above p.
- If alpha has pointer to circle event in Q, we delete the event.
- Split into two new ones, left and right, let be the new arc of p
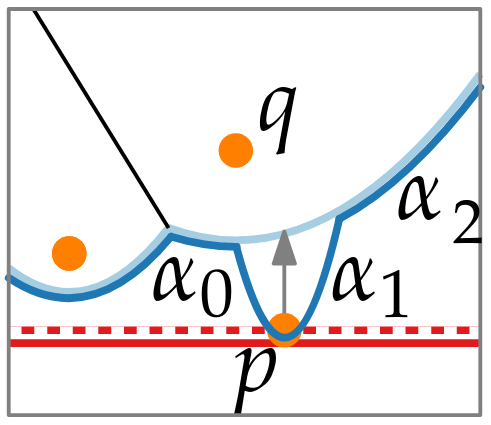
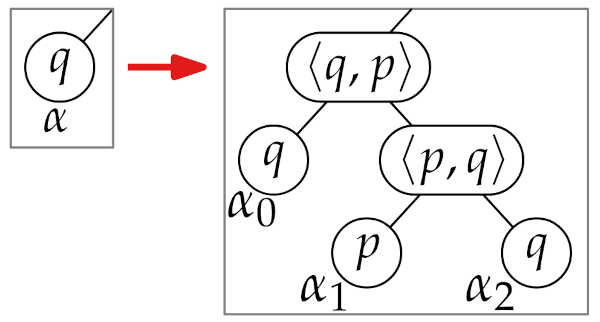
- We then add voronoi edges (p, q) and (q, p) to the doubly connected edge list.
- We find new circle events for (..., ) and (, ...).
Handling Circle event
The point that has 3 sites that have 3 consecutive arcs, the middle arc disappears.
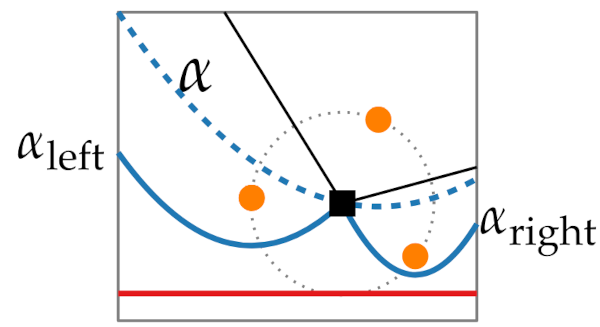
- We delete T.delete() from beach line and update break points.
- Because is not on beach line we delete all circle events involving alpha from Q
- We add voronoi vertex and voronoi edge() that correspond to new break points.
- We find new circle events between (..., and voronoi edge() and ( and voronoi edge().
Time and Space Complexity Analysis
All logarithmic time for n site events and there are at most 2n-5 circle events therefore we have O(nlogn) time complexity.
The space complexity is O(n) space.
In conclision.
Given a set P of n points in a plane fortunes sweep computes vor(P) in O(nlogn) time and O(n) space.
Questions.
Can you think of the applications of voronoi diagrams?
With this article at OpenGenus, you must have the complete idea of Voronoi Diagram.