
In this article, we give a detailed documentation of the development of OpenGenus Visual project which is an open-source Visualization tool for Algorithms and Data Structures.
OpenGenus Visual Project: on GitHub.
Try some of the visualizations:
- BFS Visualization
- DFS Visualization
- Number of Islands Visualization
- Larger Island by changing 0 to 1 Visualization
We have covered the common components and the overall structure of OpenGenus Visual which is our Visualization project for Algorithms and Data Structures. Use the visualization so that you can connect the components.
Controls.
Speed range button.
Increase or decrease speed of the visualization.

Obstacle range button.
Generate obstacles by either toggling the grid nodes or using the obstacle range button by increasing the number of obstacles generated per click.

Start button.
Start the visualization.
Manual button.
Run the visualization step by step.
Clear path button.
After running the visualization, clear the path and generate more obstacles or something.
Reload button.
Reload the grid after the visualization or if the grid becomes too cluttered.
Information icon.
Hover to view how to use controls on the top bar.

Start node.
This is the source node for the shortest path algorithm visualizations.

End node.
This is the destination node for the shortest path algorithm visualizations.

Unweighted node.
There is no cost assigned to this node, useful for unweighted graphs algorithms(bfs and dfs) and the island algorithms(number of islands and largest island).

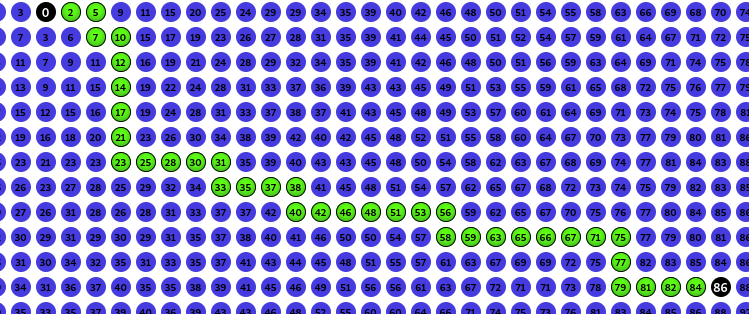
Weighted node
In the shortest path algorithms, weights are on the edges but in this project weights are assigned to a node on the graph denoting the cost of reaching that node.

Path.
The highlighted node show the shortest path from source to destination and its cost..
Obstacle.
The algorithms avoid obstacles, these could be buildings hindering short path to destinations or islands in the counting of islands and largest island algorithms.
The project file tree.
.
├── code
│ ├── assets
│ │ ├── css
│ │ │ └── visual
│ │ │ ├── index.css
│ │ │ └── pathFinding.css
│ │ ├── images
│ │ │ ├── fav1.ico
│ │ │ └── icons8-info-60.png
│ │ └── js
│ │ ├── common
│ │ │ └── index.js
│ │ └── visual
│ │ ├── Grid
│ │ │ ├── createGrid.js
│ │ │ ├── createWalls.js
│ │ │ ├── generateObstacles.js
│ │ │ └── index.js
│ │ ├── NoIslands
│ │ │ ├── bfsIslands.js
│ │ │ ├── dfsIslands.js
│ │ │ ├── index.js
│ │ │ └── largeIsland.js
│ │ └── PathFindingAlgorithms
│ │ ├── bellman-ford.js
│ │ ├── bfs.js
│ │ └── dfs.js
│ ├── bellman-ford-visual.html
│ ├── bfs-visual.html
│ ├── dfs-visual.html
│ ├── dijkstra-visual.html
│ ├── index.html
│ ├── islands-visual.html
│ └── max-Island-visual.html
└── README.md
.html
These files hold all the markup for the project.
index.html This is the homepage of the project and has links to all other pages.
Code.
assets.
This folder is responsible for all images, styling and interactivity of the project. It has images, javascript and css folders.
css
Contains files that are responsible for the styling of the project.
image.
Holds all images used in the project.
js
Contains all javascript files and folders responsible for the whole project from visualization to interactivity.
css.
visual
Holds all css files responsible for the styling of the project.
index.css
It is responsible for general styling of the project, that is, colors, body, fonts, navigation bar, responsive design etc.
pathFinding.css
Responsible for all styling dealing with the grid and visualization.
js.
Common
This folder contains common javascript file(s) used by all pages.
index.js
This file is currently responsible for the responsive hamburger menu navigation displayed on small screens.
Visual.
This stores all javascript files dealing with visualizing the algorithms.
Grid.
The grid folder stores all the important files dealing with the visualization, that is, generation of the grid, obstacle generation and a source for most visualization functions.
Creating a grid (/code/assets/js/visual/Grid/createGrid.js)
This deals with the creation of the grid, whether it is reloading, generating weights or clearing of the path, all is handled with functions from this file.
1. Generating weights.
The function below generates positive random numbers which we assign to nodes in the grid.
These values are equivalent to the weights of a node. In the case of bellman ford algorithm, we can generate negative weights by implementing the second function genRandomNeg(-ve value, +ve value)
Code.
genRandom = (maxVal) => {
	return (Math.random() * (maxVal - 1)) % maxVal;
};

//bellman ford
genRandomNeg = (min, max) => {
	return Math.random() * (max - min) + min;
};
2. Creating a node.
This function is responsible for the creation of a node, a node consists of row, column, wall, parent, cost and weight attributes.
The row and column give it a position on the grid, the wall is a boolean, this represents an obstacle on the grid, when the wall attribute is '1' that means there exists a wall thereby traversals will ignore such a node otherwise its default value is '0' representing no wall/obstacle.
The parent attribute is useful during traversal because it will store node coordinates which after traversal are needed for tracing a path from source to destination node.
The weight attribute represent the weights of edges on a practical graph, for example in dijkstra's algorithm which operated on weighted graphs, these weights are very useful as they are different for each node because of the randomization of values.
The cost attribute are first initialized to infinity, that is, during a traversal they are set to their respective values, the values are obtained by calculating weights of neighboring nodes to obtain a cost to reach that node from source node or from neighboring nodes.
We also set the weight of a node as the inner text of a node, this represent the cost of reaching to that node, in a practical graph this is the weight of an edge to that node/vertex.
We use this function for creating nodes for algorithms that operate on weighted graphs like dijkstra's and bellman ford's algorithm.
Code.
createNode = (row, col, weight) => {
	var node = document.createElement("div");
	node.setAttribute("class", "beforeStart");
	node.setAttribute("row", row);
	node.setAttribute("col", col);
	node.setAttribute("wall", 0);
	node.setAttribute("parent", null);
	node.setAttribute("cost", Number.POSITIVE_INFINITY);
	node.setAttribute("weight", weight);
	node.innerText = weight.toString();
	return node;
};
We use this function for creating nodes used by traversals that don't require edges/nodes with weights like breadth first and depth first traversals. Note that we don't assign weights to edges.
Code.
createEmptyNode = (row, col) => {
	var node = document.createElement("div");
	node.setAttribute("row", row);
	node.setAttribute("col", col);
	node.setAttribute("wall", 0);
	node.setAttribute("parent", null);
	node.setAttribute("class", "beforeStart");
	node.setAttribute("border", "1px solid #000");
	node.setAttribute("cost", Number.POSITIVE_INFINITY);
	return node;
};
3. Updating a node.
This function is responsible for updating parent, wall and weights attributes of a node.
We initialize the parent attribute to null, this will be updated during traversals.
Class beforeStart which is the class used for styling all nodes before traversing the grid, during and after traversal the styling will change.
It is triggered when a path is cleared, in this case all weights are randomized, the parent attribute is set to null and the cost to each node is set to positive infinity.
This function is applicable for graph algorithms that require weighted edges/nodes e.g, dijkstra's or bellman ford's algorithm.
Code.
updateNode = (node, row, col, weight, wall) => {
	node.setAttribute("row", row);
	node.setAttribute("col", col);
	node.setAttribute("parent", null);
	node.setAttribute("class", "beforeStart");
	node.setAttribute("cost", Number.POSITIVE_INFINITY);
	node.setAttribute("weight", weight);
	node.innerText = weight.toString();
	if (wall == 1) {
		node.setAttribute("wall", 1);
		node.className += " wall";
	} else {
		node.setAttribute("wall", 0);
	}
	return node;
};
This function is applicable for graph algorithms that require unweighted edges/nodes e.g, breadth first or depth first traversals. Note that we don't assign weights to edges.
Code.
updateEmptyNode = (node, row, col, wall) => {
	node.setAttribute("row", row);
	node.setAttribute("col", col);
	node.setAttribute("class", "beforeStart");
	node.setAttribute("parent", null);
	node.setAttribute("border", "1px solid #000");
	node.setAttribute("cost", Number.POSITIVE_INFINITY);
	node.innerText = "";
	if (wall == 1) {
		node.setAttribute("wall", 1);
		node.className += " wall";
	} else {
		node.setAttribute("wall", 0);
	}
	return node;
};
4. Creating the board/grid.
These functions combine the creating nodes functions to generate a grid in the DOM. It assigns the discussed attributes to create both weighted and unweighted n nodes.
This function creates uses the createNode() function discussed above to create a grid with weighted used in graph algorithms for weighted graphs such as dijkstra's and bellman ford's algorithm
Code
createBoard = () => {
	var grid = document.querySelector("#gridContainer");
	grid.innerHTML = "";
	for (var i = 0; i < rowSize; i++) {
		for (var j = 0; j < colSize; j++) {
			if (algorithmType.classList.contains("dijkstras")) {
				let weight = Math.round(genRandom(5));
				let newNode = createNode(i, j, weight);
				grid.appendChild(newNode);
			} else if (algorithmType.classList.contains("bellman-ford")) {
				let weight = Math.round(genRandomNeg(1, 5));
				let newNode = createNode(i, j, weight);
				grid.appendChild(newNode);
			}
		}
	}
};
This function creates uses the createEmptyNode() function discussed above to create a grid with nodes without weights used in graph algorithms for unweighted graphs
Code.
createEmptyBoard = () => {
	var grid = document.querySelector("#gridContainer");
	grid.innerHTML = "";
	for (var i = 0; i < rowSize; i++) {
		for (var j = 0; j < colSize; j++) {
			let newNode = createEmptyNode(i, j);
			grid.appendChild(newNode);
		}
	}
};
5. Refreshing a grid.
After a traversal, we may want to clear the highlighted shortest path and add more obstacles.
These functions are responsible for clearing the grid after a traversal, note that the already created obstacles will not be removed and the weights assigned to each node in weighted graphs will persist.
This function uses the updateNode() function discussed in previous sections to update a grid in a weighted graph traversal algorithm.
Code.
export const refreshBoard = () => {
	for (var i = 0; i < rowSize; i++) {
		for (var j = 0; j < colSize; j++) {
			var node = document.querySelector(`div[row="${i}"][col="${j}"]`);
			var weight = parseInt(node.getAttribute("weight"));
			if (node.getAttribute("wall") == 1) {
				updateNode(node, i, j, weight, 1);
			} else {
				updateNode(node, i, j, weight, 0);
			}
		}
	}
	createStartNode(startRow, startCol);
	createEndNode(endRow, endCol);
};
This function uses the updateEmptyNode() function discussed in previous sections to update a grid in a unweighted graph traversal algorithms.
Code
refreshEmptyBoard = () => {
	for (var i = 0; i < rowSize; i++) {
		for (var j = 0; j < colSize; j++) {
			var node = document.querySelector(`div[row="${i}"][col="${j}"]`);
			if (node.getAttribute("wall") == 1) {
				updateEmptyNode(node, i, j, 1);
			} else {
				updateEmptyNode(node, i, j, 0);
			}
		}
	}
	createStartNode(startRow, startCol);
	createEndNode(endRow, endCol);
};
6. Creating the source and destination nodes.
During creating of the grid, we select tow nodes which will act as the source and destination nodes. These nodes are useful when we need to highlight the shortest path from source to destination after a traversal is complete.
Note that during solving the problem of number of islands, we don't initialize the source and destination nodes because in such a case we are given a grid and we find islands not a path.
This function is responsible for creating the start node/source node.
export const createStartNode = (x1 = 0, y1 = 0) => {
	var startNode = document.querySelector(`div[row='${x1}'][col='${y1}']`);
	startNode.setAttribute("cost", 0);
	startNode.setAttribute("class", "pathNode");
	if (!algorithmType.classList.contains("numIslands")) {
		startNode.innerHTML = "A";
	}
};
This function is responsible for creating the end node/destination node.
Code.
export const createEndNode = (x2 = rowSize - 1, y2 = colSize - 1) => {
	var endNode = document.querySelector(`div[row='${x2}'][col='${y2}']`);
	endNode.setAttribute("class", "pathNode");
	if (!algorithmType.classList.contains("numIslands")) {
		endNode.innerHTML = "B";
	}
};
Creating walls/obstacles. (/code/assets/js/visual/Grid/createWalls.js)
This file is responsible for creating obstacles in the grid by toggling a node of the grid.
When a node is clicked an obstacle is created, during traversal these created obstacles are ignored, in a practical sense while using a navigation application, this could be buildings in the way of a shortest path.
Code.
setWall = (e) => {
	if (mouseDown) {
		if (e.target.classList.contains("beforeStart")) {
			const row = e.target.getAttribute("row");
			const col = e.target.getAttribute("col");
			if (
				(row == startRow && col == startCol) ||
				(endRow == row && endCol == col)
			) {
				window.alert("Create a valid wall");
			} else {
				e.target.classList.toggle("wall");
				if (e.target.classList.contains("wall")) {
					e.target.setAttribute("wall", 1);
				} else {
					e.target.setAttribute("wall", 0);
				}
			}
		}
	}
};
Generating walls/obstacles. (/code/assets/js/visual/Grid/generateObstacles.js)
As the name suggests it is responsible for creating random walls/obstacles on the grid, there is range slider button in the DOM whereby a user can decide the number of obstacles to generate per click of the generate button.
1. Getting a node.
This function gets a random node from the DOM, which will be set as an obstacle when the generate button is clicked.
It avoids setting the source and destination nodes using the pathNode attribute as walls because then the algorithm will not work.
If a selected node is a wall then when the generate button is clicked, the wall will be removed.
Code.
obstacles = (x = 0, y = 0) => {
	var node = document.querySelector(`div[row='${x}'][col='${y}']`);
	if (node.classList.contains("pathNode")) {
		return;
	} else {
		node.classList.toggle("wall");
		if (node.classList.contains("wall")) {
			node.setAttribute("wall", 1);
		} else {
			node.setAttribute("wall", 0);
		}
	}
};
2. Setting walls/obstacles.
This function is responsible for randomizing the selection of nodes in the grid. All this depends on the slider value which will dictate the number of obstacles to be generated.
We use two arrays, one for rows and columns and later we merge values from the two arrays to come up with a random node which we set as an obstacle/wall.
export const setObstacles = () => {
	var obstacleSlider = document.querySelector(".obstacleSlider");
	obstacleSlider.setAttribute("max", rowSize + colSize);

	var rows = [];
	var cols = [];
	for (let i = 1; i < rowSize; i++) {
		rows.push(i);
	}
	for (let i = 1; i < colSize; i++) {
		cols.push(i);
	}
	var arr1 = rows.slice(),
		arr2 = cols.slice();

	arr1.sort(function () {
		return 0.5 - Math.random();
	});
	arr2.sort(function () {
		return 0.5 - Math.random();
	});

	var trimVal = Math.floor(
		(arr1.length * obstacleSlider.value) / (rowSize + colSize)
	);

	arr1.splice(0, arr1.length - trimVal);

	while (arr1.length) {
		var rowVal = arr1.pop(),
			colVal = arr2[0] == rowVal ? arr2.pop() : arr2.shift();
		obstacles(rowVal, colVal);
	}
};
Tying it all together. (/code/assets/js/visual/Grid/index.js)
This file contains variables and functions responsible for the source and destination node coordinates, button event listeners, conditionally starting the visualization, clearing paths after visualization, initialization of the board on page load and reloading the grid.
1. Getting DOM elements.
We first get elements from the DOM, these are the grid and control buttons. We export some of these elements to avoid redeclaration in other files.
Code.
export const gridContainer = document.querySelector("#gridContainer");
export const clearPathBtn = document.querySelector(".clearPath");
export const resetBtn = document.querySelector(".reset");
const weightBtn = document.querySelector(".weight");
const algoBtn = document.querySelector(".algo");
export const startBtn = document.querySelector(".start");
export const wallBtn = document.querySelector(".setWalls");
export const speedSlider = document.querySelector(".speedSlider");
const islandAlgoBtn = document.querySelector(".islandsAlgo");
export const stepsContainer = document.querySelector(".notification");
export const algorithmType = document.querySelector(".algorithm");
export var manualStart = document.querySelector(".manual");
manualStart.setAttribute("disabled", "true");
2. Initialization.
We initialize variables, these are the size of the grid, starting(source) node and ending(destination) nodes and more control buttons.
Code.
export var rowSize = 20;
export var colSize = 40;
export var startRow = 4;
export var startCol = 5;
export var endRow = 15;
export var endCol = 32;
export var mouseDown = false;
export var weightType = weightBtn.options[weightBtn.selectedIndex].value;
export var algorithm = algoBtn.options[algoBtn.selectedIndex].value;
export var islandAlgo =
	islandAlgoBtn.options[islandAlgoBtn.selectedIndex].value;
3. Steps Arrays.
We use these arrays to store traversal steps which we later use for the step by step visualization of an algorithm.
We also initialize path arrays which will be used to store path steps, after running the traversal algorithm, we shall highlight a path from source to destination.
Code.
export let bfsSteps = [];
export let dfsSteps = [];
export let bellmanSteps = [];
export let dijkstrasPath = [];
export let bellmanFordPath = [];
4. Event listeners.
We add event listeners for various buttons and actions such as setting obstacles, running algorithms, reloading the page and clearing path after traversal.
Code.
gridContainer.addEventListener("mousedown", () => {
	mouseDown = true;
});
gridContainer.addEventListener("mouseup", () => {
	mouseDown = false;
});
gridContainer.addEventListener("mouseover", () => {
	setWall;
});
wallBtn.addEventListener("click", setObstacles);

islandAlgoBtn.addEventListener("change", () => {
	window.location.reload();
});
5. Clearing path.
After visualizing a graph traversal, we can opt to clear the highlighted shortest path an test the algorithm on a different set of obstacles.
This function clears the path by utilizing the refreshEmptyBoard() function for unweighted graph traversal algorithms and refreshBoard() function for weighted graph algorithms.
It is triggered when the clear path button is clicked.
Code.
clearPath = () => {
	gridContainer.addEventListener("mousedown", setWall);
	gridContainer.addEventListener("mouseup", setWall);
	gridContainer.addEventListener("mouseover", setWall);
	if (
		algorithmType.classList.contains("bfs") ||
		algorithmType.classList.contains("dfs") ||
		algorithmType.classList.contains("numIslands") ||
		algorithmType.classList.contains("maxIsland")
	) {
		refreshEmptyBoard();
	} else if (
		algorithmType.classList.contains("dijkstras") ||
		algorithmType.classList.contains("bellman-ford")
	) {
		refreshBoard();
	}
	startBtn.style.visibility = "visible";
};
6. Display steps.
After the first visualization and storing the data, we use the stored data to log the steps taken to reach the destination from source.
Code.
notification = (row, col, erow, ecol) => {
	var step = document.createElement("div");
	step.classList.add("step");
	var push = document.createElement("p");
	var explore = document.createElement("p");
	var costText = document.createElement("p");
	if (algorithmType.classList.contains("bellman-ford")) {
		if (bellmanSteps.length == 0) {
			push.textContent = `Selected (${row}, ${col}) as path.`;
		} else {
			if (
				bellmanSteps.length <=
				bellmanStepsLength - bellmanStepsLength / relaxations
			) {
				push.textContent = `Relaxing (${row}, ${col}): current cost ${prevCost}, updated cost ${
					cost || "inf"
				}.`;
				explore.textContent = `Processing (${erow}, ${ecol}).`;
			} else {
				push.textContent = `Pushed (${row}, ${col}) to dist[] array.`;
				explore.textContent = `Exploring (${erow}, ${ecol}).`;
			}
		}
	} else if (
		algorithmType.classList.contains("dijkstras") ||
		algorithmType.classList.contains("bfs")
	) {
		if (bfsSteps.length == 0) {
			push.textContent = `Selected (${row}, ${col}) as path.`;
		} else {
			push.textContent = `Pushed (${row}, ${col}) to array.`;
			explore.textContent = `Processing (${erow}, ${ecol}).`;
			costText.textContent = `Cost from source is ${cost}`;
		}
	} else if (algorithmType.classList.contains("dfs")) {
		if (row == erow && col == ecol) {
			push.textContent = `Pushed (${erow}, ${ecol}) to stack.`;
			explore.textContent = `Exploring (${erow}, ${ecol}).`;
		} else {
			push.textContent = `Popped (${row}, ${col}) from stack.`;
		}
	}
	step.appendChild(push);
	step.appendChild(explore);
	step.appendChild(costText);
	stepsContainer.append(step);
	stepsContainer.scrollTop = stepsContainer.scrollHeight;

	step.addEventListener("click", () => {
		let node = document.querySelector(`div[row='${row}'][col='${col}']`);
		let node1 = document.querySelector(`div[row='${erow}'][col='${ecol}']`);
		setTimeout(() => {
			node.setAttribute("class", "pathColor");
			node1.setAttribute("class", "pathColor");
		}, 1000);
		node1.setAttribute("class", "manualStep");
		node.setAttribute("class", "chosenPath");
	});
};
7. Step by step visualization.
After visualizing the algorithm one may want to see the steps taken to obtain the shortest path from source to destination and how the relaxation works.
This function goes step by step in exploring the algorithm on the click of a button or enter button on the keyboard.
Code.
let isPath = true;
stepper = (steps) => {
	gridContainer.removeEventListener("mousedown", setWall);
	gridContainer.removeEventListener("mouseover", setWall);
	// wallBtn.setAttribute("disabled", true);
	if (isPath) {
		clearPath();
		bellmanFordPath.splice(
			0,
			bellmanFordPath.length - bellmanFordPath.length / 5
		);
		startBtn.setAttribute("disabled", "true");
		clearPathBtn.setAttribute("disabled", "true");
		stepsContainer.classList.remove("notification");
		stepsContainer.classList.add("show");
		wallBtn.setAttribute("disabled", "true");
		isPath = false;
	}
	if (steps.length == 0) {
		if (
			algorithmType.classList.contains("dijkstras") ||
			algorithmType.classList.contains("bfs")
		) {
			if (dijkstrasPath.length == 0) {
				alert("Steps completed!");
			} else {
				//draw path
				var pcol = dijkstrasPath[0][0];
				var prow = dijkstrasPath[0][1];
				setTimeout(() => {
					node.setAttribute("class", "pathColor");
				}, 1000);
				node.setAttribute("class", "chosenPath");
				notification(pcol, prow, 0, 0);
				dijkstrasPath.shift();
			}
		} else if (algorithmType.classList.contains("bellman-ford")) {
			if (bellmanFordPath.length == 0) {
				alert("Bellman ford steps completed!");
			} else {
				//draw path
				var pcol = bellmanFordPath[0][0];
				var prow = bellmanFordPath[0][1];
				let node = document.querySelector(
					`div[row='${pcol}'][col='${prow}']`
				);
				node.setAttribute("class", "chosenPath");
				notification(pcol, prow, 0, 0);
				bellmanFordPath.shift();
			}
		} else {
			alert("Completed Steps");
		}
	} else {
		var cr = steps[0][0];
		var cc = steps[0][1];
		var cost = steps[0][2];
		var er = steps[0][3];
		var ec = steps[0][4];
		let node = document.querySelector(`div[row='${cr}'][col='${cc}']`);
		setTimeout(() => {
			node.setAttribute("class", "pathColor");
		}, 1000);
		node.setAttribute("class", "chosenPath");
		//relaxation for bellman ford nodes
		let prevCost = node.innerHTML;
		node.innerHTML = cost || "inf";
		notification(cr, cc, er, ec, cost, prevCost);
		steps.shift();
};
8. Starting the visualization.
This function conditionally starts a visualization depending on the algorithm being implemented on a page.
It is also responsible for running a visualization step by step when the manual button is clicked.
The function is triggered when the start button is clicked.
Code.
startVisualization = () => {
	if (algorithmType.classList.contains("bfs")) {
		bfs(startRow, startCol, endRow, endCol);
		manualStart.addEventListener("click", () => {
			stepper(bfsSteps);
		});
	} else if (algorithmType.classList.contains("dfs")) {
		dfs(startRow, startCol, endRow, endCol);
		manualStart.addEventListener("click", () => {
			stepper(dfsSteps);
		});
	} else if (algorithmType.classList.contains("dijkstras")) {
		bfs(startRow, startCol, endRow, endCol);
		manualStart.addEventListener("click", () => {
			stepper(bfsSteps);
		});
	} else if (algorithmType.classList.contains("bellman-ford")) {
		bellmanFord(startRow, startCol, endRow, endCol);
		manualStart.addEventListener("click", () => {
			stepper(bellmanSteps);
		});
	} else if (algorithmType.classList.contains("numIslands")) {
		if (islandAlgo === "bfs") {
			bfsIslands();
		} else if (islandAlgo === "dfs") {
			dfsIslands();
		}
	} else if (algorithmType.classList.contains("maxIsland")) {
		maxIsland();
	}
};
startBtn.addEventListener("click", startVisualization);
9. Initializing the grid.
When the window in the DOM is loaded, functions to create the grid whether it is an implementation of a weighted or unweighted graph algorithm are executed.
We also create the source and destination nodes.
Code.
window.onload = () => {
	gridContainer.addEventListener("mousedown", setWall);
	gridContainer.addEventListener("mouseup", setWall);
	gridContainer.addEventListener("mouseover", setWall);
	if (
		algorithmType.classList.contains("bfs") ||
		algorithmType.classList.contains("dfs") ||
		algorithmType.classList.contains("numIslands") ||
		algorithmType.classList.contains("maxIsland")
	) {
		createEmptyBoard();
	} else if (
		algorithmType.classList.contains("dijkstras") ||
		algorithmType.classList.contains("bellman-ford")
	) {
		createBoard();
	}
	if (
		algorithmType.classList.contains("bfs") ||
		algorithmType.classList.contains("dfs") ||
		algorithmType.classList.contains("dijkstras") ||
		algorithmType.classList.contains("bellman-ford")
	) {
		createStartNode(startRow, startCol);
		createEndNode(endRow, endCol);
	} else if (
		algorithmType.classList.contains("numIslands") ||
		algorithmType.classList.contains("maxIslands")
	) {
		if (islandAlgo === "bfs") {
			createStartNode(0, 0);
			createEndNode(19, 39);
			document
				.querySelector(`div[row='${0}'][col='${0}']`)
				.classList.add("islandsPathNode");
			document
				.querySelector(`div[row='${19}'][col='${39}']`)
				.classList.add("islandsPathNode");
		} else if (
			islandAlgo === "dfs" ||
			algorithmType.classList.contains("maxIslands")
		) {
			createStartNode(0, 0);
			createEndNode(0, 1);
			document
				.querySelector(`div[row='${0}'][col='${0}']`)
				.classList.add("islandsPathNode");
			document
				.querySelector(`div[row='${0}'][col='${1}']`)
				.classList.add("islandsPathNode");
		}
	}
};
Path finding algorithms.
The folder holds files responsible for the shortest path algorithms, that is breadth first search, depth first search, dijkstra's algorithm and bellman ford's algorithm.
These files are discussed in depth in the links provided at the end of this article.
bellmanFord.js
Responsible for the visualization of the bellman ford single source shortest path algorithm.
bfs.js
Conditionally Responsible for the visualization of both breadth first searchh and dijkstra's algorithm, that is, if we are on the page for breadth first search, then then a grid without weights is generated and breadth first traversal is implemented otherwise a grid with weights is generated and dijkstra's algorithm is implemented.
dfs.js
Holds functions for the implementation of depth first traversal.
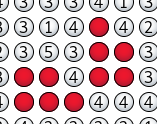
Islands.
This file stores visualizations of algorithmic problems dealing with islands, that is, counting the number of islands and getting the largest island by flipping 0. to 1s.
bfsIslands
This is a visualization of counting the number of islands given a grid by using breadth first search traversal of the grid.
dfsIslands
This is a visualization of counting the number of islands given a grid by using depth first search traversal of the grid.
largeIsland.js
This is a visualization of estimating the largest island by flipping 0s to 1s using breadth first search.
index.js
The code here is used to generate a matrix from the given grid that we use for the breadth first approach for finding the number of islands, depth first approach and the largest island problem.
References.
- breadth first search, depth first search
- Dijkstra's algorithm
- bellman ford's algorithm
- Number of islands
- Largest island
Visualizations: