
Reading time: 30 minutes
This article is for those people who are going to willing to build their career in python and data analysis. Most of you reading this post are probably familiar and heard about Pandas, and have probably used it in many projects.
But too those who have never used it or are completely new to this,
Pandas is one of the most used python libraries for understanding data and manipulating it.
All the code and dataset used in this article can be found here

I personally use pandas on an almost daily basis, because of its easy to access syntax and rich functionality. Hope after reading this article, it will help you dive into the ocean of data analysis with python and pandas.
So, let's get on with it. Enjoy reading! 🙂
This article is structured as follows:
- Introduction and Installations
- Pandas Data Structures
- Understanding with Pandas DataFrame
- Visualization in Pandas
- Conclusion
1) Introduction and Installation
What is Pandas? Pandas is an extremely popular open-source library, for handling tabular data, data manipulation and its analysis.
Pandas is like excel for Python, with tables (which in pandas are called DataFrames), rows and columns (which in pandas are called Series).
Why to use pandas?
As per the official documentation:
”fast, flexible, and expressive data structures designed to make working with “relational” or “labeled” data both easy and intuitive.”
In short Pandas is a data wrangling library.
How to install Pandas?
For Anaconda, Pandas is pre-installed in the base environment. But, it is always advised to create new environments for new projects. The reference to create environments can be referred here.
To install pandas in new environment, activate the environment and then use following command.
conda install pandas
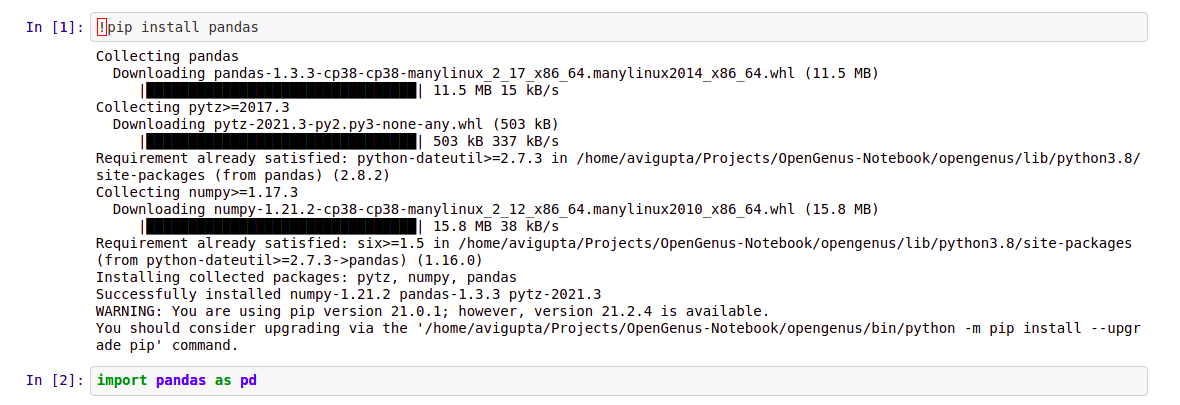
If pip is being used, pandas can be installed as:
pip install pandas
For importing pandas to be used, we use a well used abbreviation as
import pandas as pd
2) Pandas Data Structures
In order to master pandas you have to start from scratch with two main data structures: DataFrame and Series.
Pandas uses to store data, the Pandas Series and the Pandas Dataframe. Think of Pandas Series as an 1 column Excel spreadsheet, with an additional index column. While for Pandas Dataframe,
The basic data structure of Pandas is DataFrame which represents data in tabular form with labeled rows and columns.
Pandas Series
Series is a one-dimensional labeled array capable of holding any data type (integers, strings, floating point numbers, Python objects, etc.).
The axis labels are collectively referred to as the index. It is an object which is similar to Python built-in list data structure but differs from it because it has associated label with each element or so-called index.
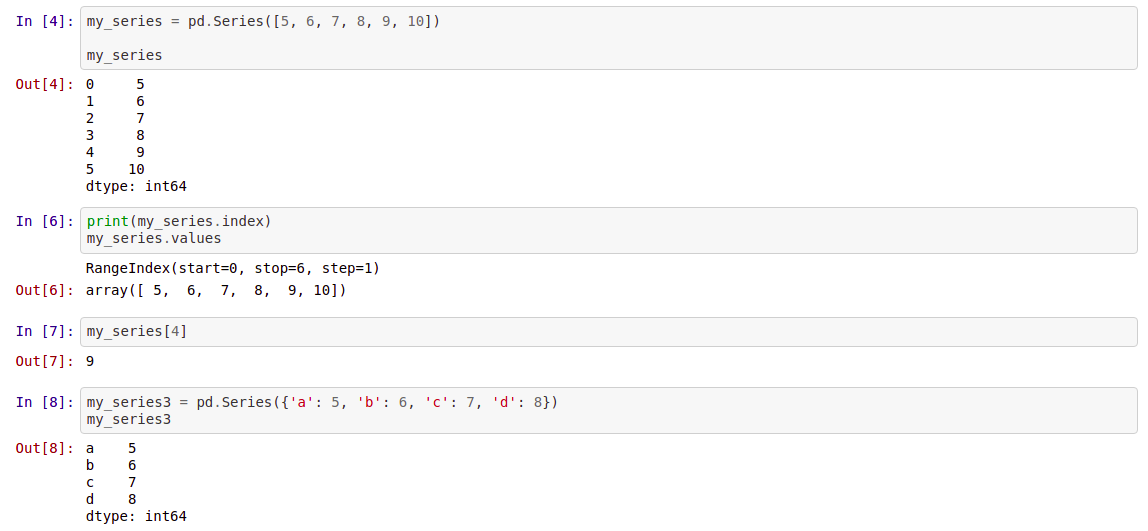
The basic method to create a Series is to call
my_series=pd.series([5,6,7,8,9,10])
We use the pd.Series() command, and provide a list.
If index is not provided explicitly, then pandas creates RangeIndex starting from 0 to N-1, where N is a total number of elements. We also can create a Series from an 1-dim Numpy array.
Series has attributes to extract its values and index
my_series.index
my_series.values
You can retrieve elements by the particular index number
my_series[4]
Because Series is very similar to dictionary, where key is an index and value is an element, we can do this
my_series3 = pd.Series({'a': 5, 'b': 6, 'c': 7, 'd': 8})
How Pandas Series is different from 1-D Numpy Array?
- Pandas Series can hold a variety of data types whereas Numpy supports only numerical data type
- Pandas Series supports index labels
Pandas Dataframe
Pandas Dataframe is a two dimensional labeled data structure. It consists of rows and columns.Each column in Pandas DataFrame is a Pandas Series.
Simply said, DataFrame is a table. It has rows and columns. Each column in a DataFrame is a Series object, rows consist of elements inside Series.
How to Create Pandas DataFrames?
We can create pandas dataframe from dictionaries,json objects,csv file etc.
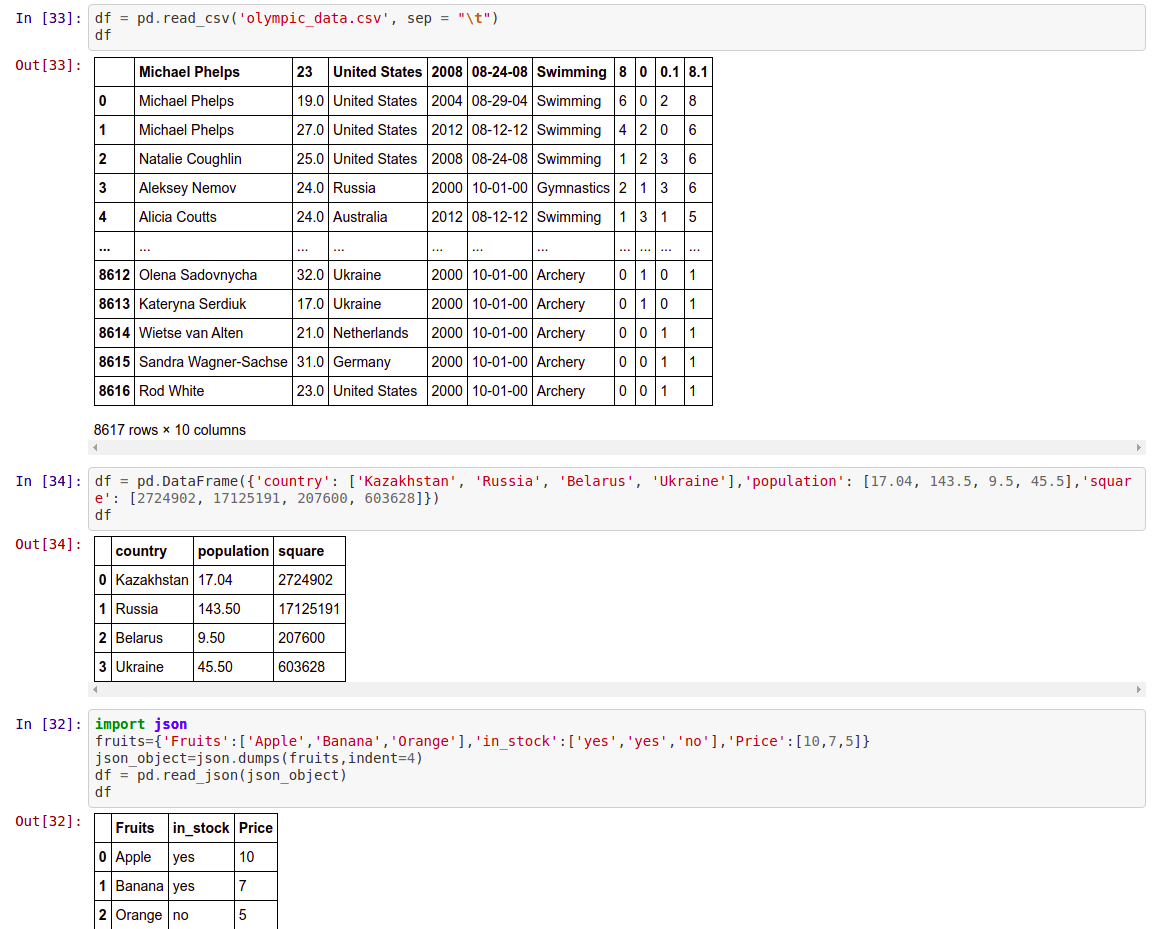
From CSV
df=pd.read_csv()
From dictionary
df = pd.DataFrame({'country': ['Kazakhstan', 'Russia', 'Belarus', 'Ukraine'],'population': [17.04, 143.5, 9.5, 45.5],'square': [2724902, 17125191, 207600, 603628]})
From Json object
import json
fruits={'Fruits':['Apple','Banana','Orange'],'in_stock':['yes','yes','no'],'Price':[10,7,5]}
json_object=json.dumps(fruits,indent=4)
df = pd.read_json(json_object)
3) Understanding with Pandas DataFrame
Reading the DataFrame
The first thing we should do, once we have downloaded or collected some data is to read such data into a pandas DataFrame. This is one of the main Pandas objects, along with the Series, and like I mentioned before, it resembles a table with columns and rows.
df = pd.read_csv('filename.csv', sep=',')
The method read_csv, reads data from a csv file that is located in the same directory as the script or notebook that we are running the code from. Pandas also has functions for reading from Excel sheets, HTML documents, or SQL databases.
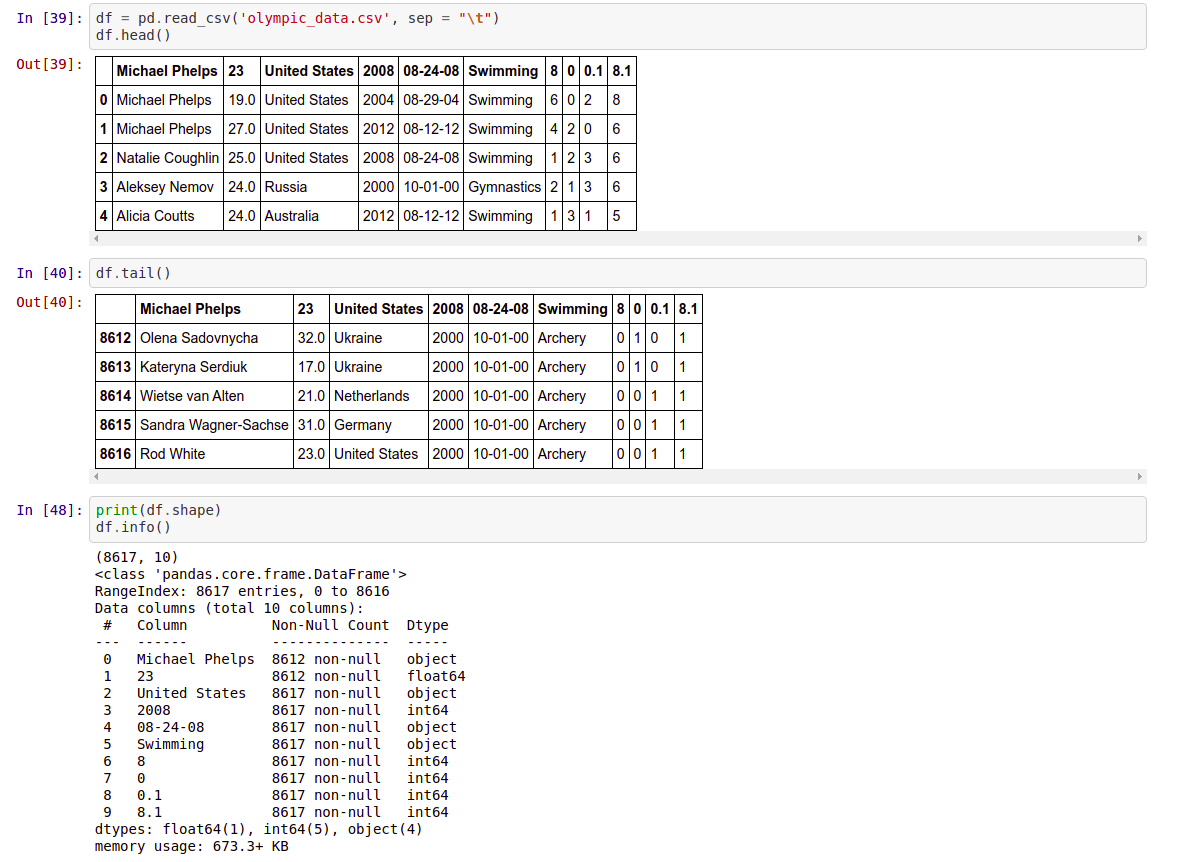
df.head() →Returns first 5 rows of dataframe (by default). Otherwise, it returns the first ’n’ rows mentioned.
df.head()
df.tail() →Returns the last 5 rows of the dataframe(by default). Otherwise it returns the last ’n’ rows mentioned.
df.tail()
df.shape → Return the number of rows and columns of the dataframe.
df.shape
df.info() →It prints the concise summary of the dataframe. This method prints information of the dataframe like column names, its datatypes, nonnull values, and memory usage
df.info()
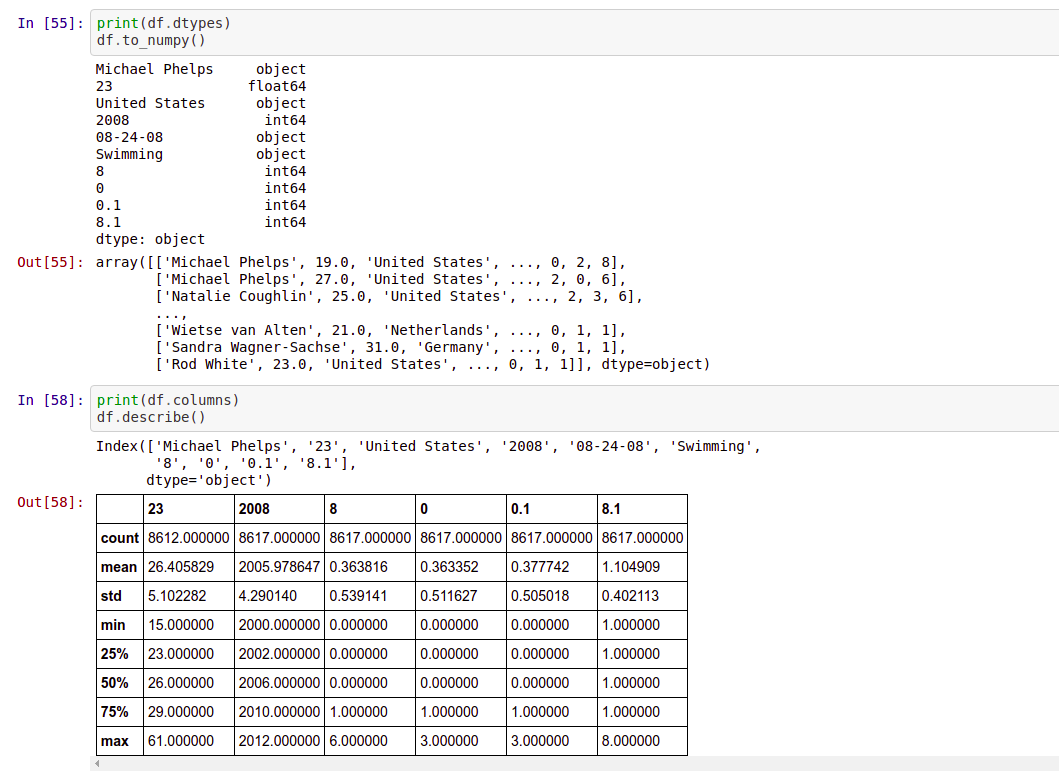
df.dtypes → Returns a series with the datatypes of each column in the dataframe.
df.dtypes
df.to_numpy() → This also returns the NumPy representation of the dataframe.
df.to_numpy()
df.columns → Return the column labels of the dataframe
df.columns
df.describe() → Generates descriptive statistics. It describes the summary of all numerical columns in the dataframe.
df.describe()
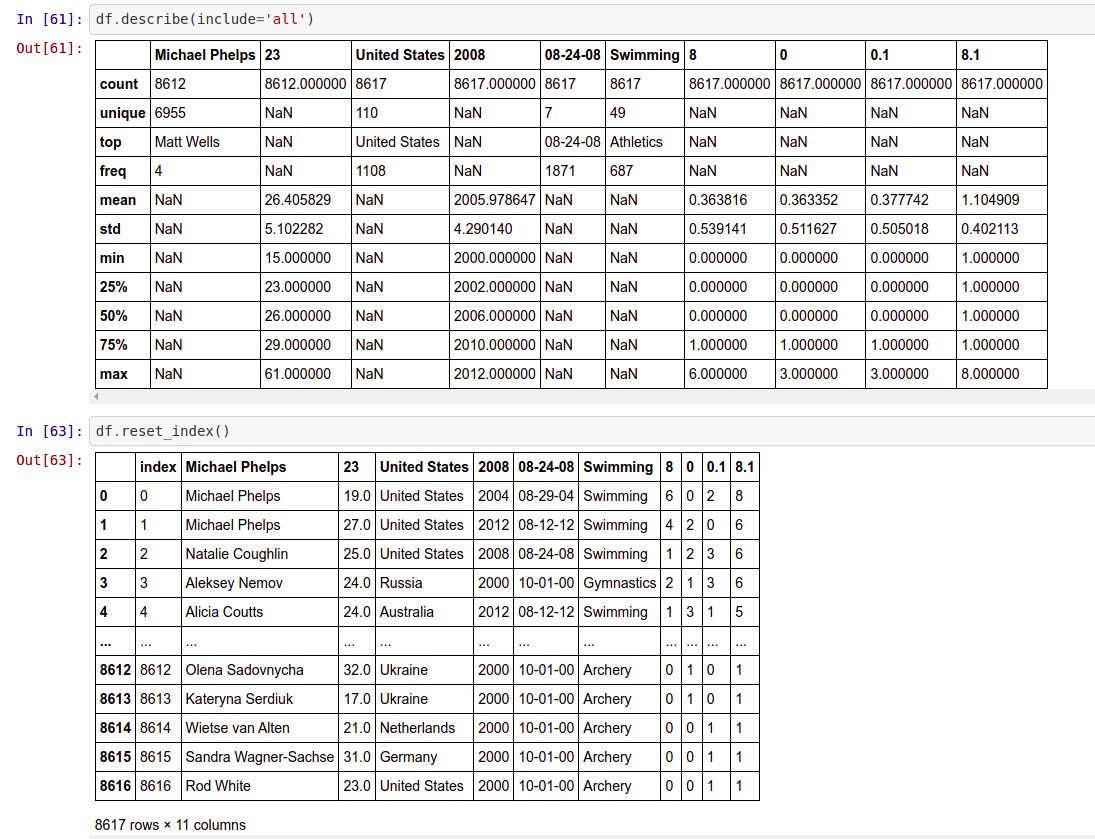
df.describe(include='all') → It describes the summary of all columns in the dataframe.
df.describe(include='all')
df.set_index() → sets the dataframe index using the existing columns. By default it will have RangeIndex (0 to n-1)
[To modify the df, have to mentin inplace=True or have to assign to df itself. If not, it will return a new dataframe and the original df is not modified..]
df.set_index()
df.reset_index() → Reset the index of the dataframe and use the default -index.
df.reset_index()
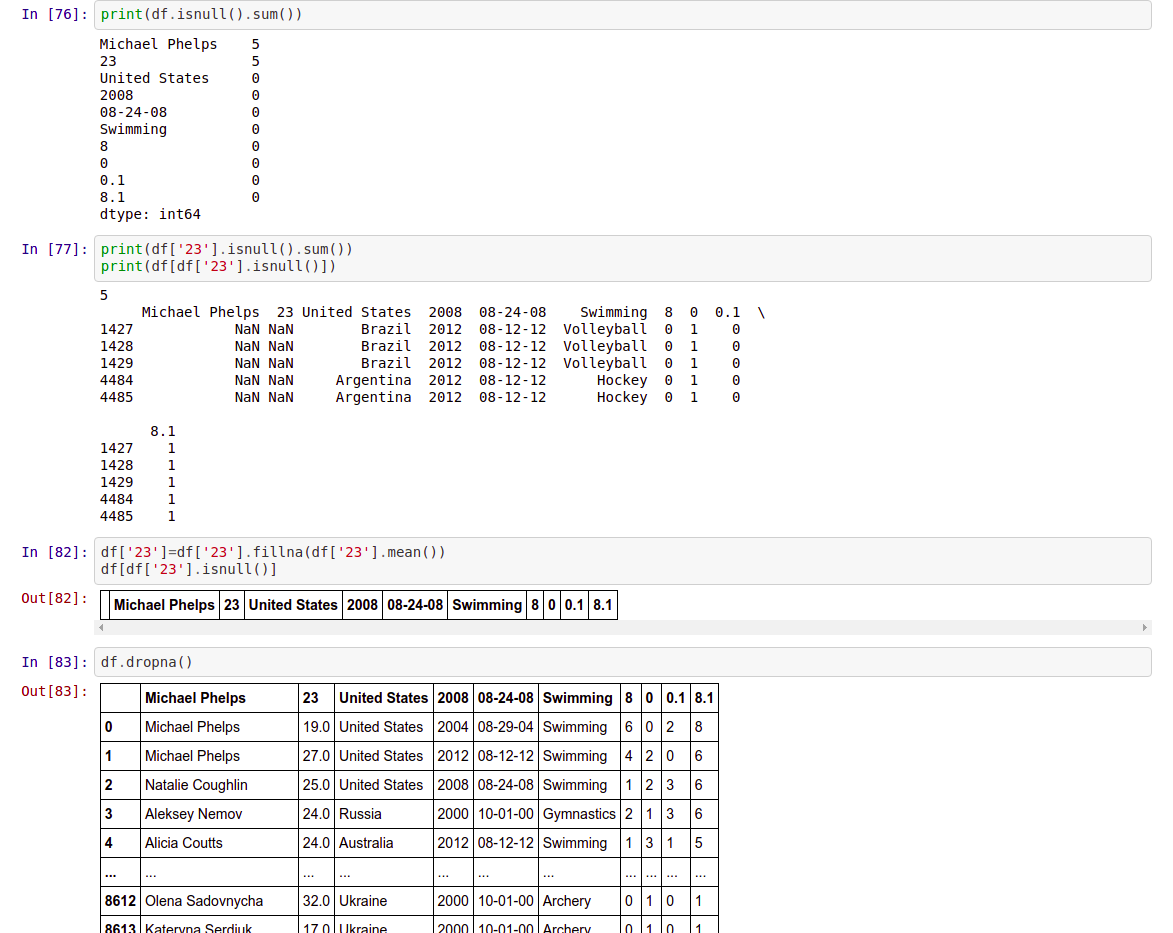
How to drop/fill the null values in the dataframe?
Suppose we want to check whether a pandas dataframe has null values.
df.isnull().sum() → Returns the sum of null values in each column in the df
df.isnull().sum()
df["col_name"].isnull().sum() → Returns the sum of null values for that particular column in the df.
df["23"].isnull().sum()
If we want to look into the rows which have null values
df[df["col_name"].isnull()] → Returns the row which has null values in the “Price” column.
df[df["23"].isnull()]
After looking into the rows, we can decide whether to drop or fill the null values.
If we want to fill the null values with a mean value
df[“col_name”].fillna(df[“col_name”].mean())
df[“col_name”].fillna(df[“col_name”].mean())
To drop all the rows having null values
df.dropna()
df.dropna()
To modify the original df, have to mention inplace=True or have to assign it to the original df itself.
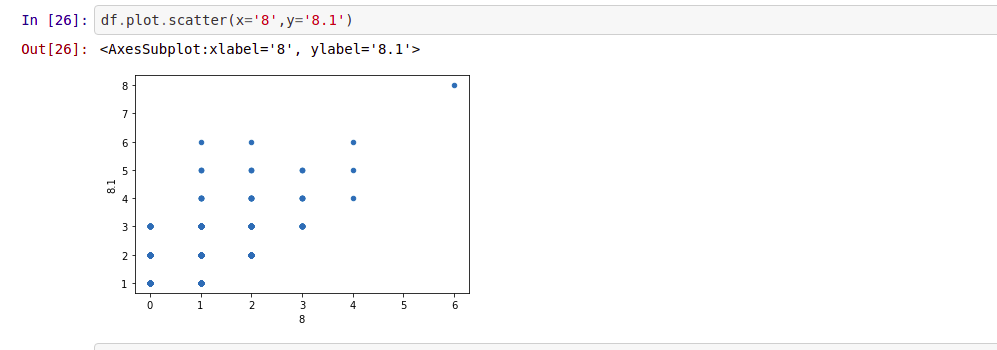
4) Visualization in Pandas
It’s good to get the statistics for the data, and to know how to select certain parts of the DataFrame, but it’s certainly nice to see some graphical interpretation of the dataset.let’s take a look to simple plots with Pandas.
5) Conclusion
This article is just the tip of the iceberg, I cannot emphasize enough that there are dozens more functions and methods, which all could not get covered and presented, but you can find them in the official Pandas documentations.
Also, as you will work with your own data, you will encounter many of them, by your own.and I encourage you guys to try it and share your experiences, But as a beginning step, to familiarize with our friend Pandas, you will certainly find the above tips useful.
Thank you for reading my article at OpenGenus, I hope you found it helpful and please do share it with others!