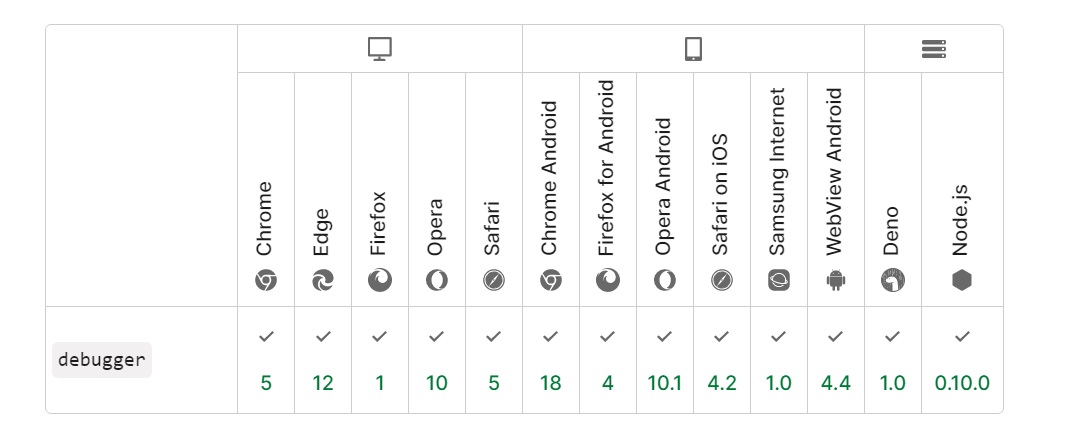
Error will most likely occur whenever you write a code. The debugger in JavaScript is a function that request any available debugging functionality, such as setting a breakpoint. If no debugging functionality is used, it will have no effect on the code.
A written programming code can contain syntax errors or logical errors. And in most cases many of the erros are syntax or logical errors, many of these errors are burdensome to diagnose and fix. Based on experience, when a code has an error, you will nto get an error message and will have no idea where to search for errors. Debugging is the when we diagnose and fix errors in a programming code.
JavaScript Debuggers:
As mentioned earlier, debugging can a burdensome experience but most browsers have a built-in JavaScript debugger which makes it easier for programmers to debug. Some of the functionality of browsers built-in debuggers is that it can be switched on and off. You can also activate debugging in your browser using the F12 key and select Console in the debugger menu.
Albeit with a debugger you can set breakpoints and this will enable you to inspect variables while the code is executing
Methods of debugging JavaScript
The different ways to debug JavaScript code/ a web page are as follows:
- The console.log()
- Setting Breakpoints
- The debugger Keyword
- Console.info()
- Console.debug()
- Console.warn()
- Console.assert()
- Console.time()
- Search DOM elements in console
- Stack trace for a function
- Debug() on a function
- Monitor() on a function
We will dive into each method.
1. The console.log()
If you are using a browser that supports debugging functionality, console.log() can be used to dispaly JavaScripts values in the debugger tab
Example:
<!DOCTYPE html>
<html>
<body>

<h1>OpenGenus Article</h1>

<script>
a = 5;
b = 6;
c = a + b;
console.log(c);
</script>

</body>
</html>
2. Setting Breakpoints
Another method that can be implemented is by setting breakpoints in your JavaScript Code. Once set, the JavaScript will stop execution at each breakpoint to allow you probe the code values. Afterwards you resume the execution
You can set breakpoints at any of the following points:
- At the the line of code.
- At a particular conditional statements.
- At the DOM node.
- On the Event listeners.
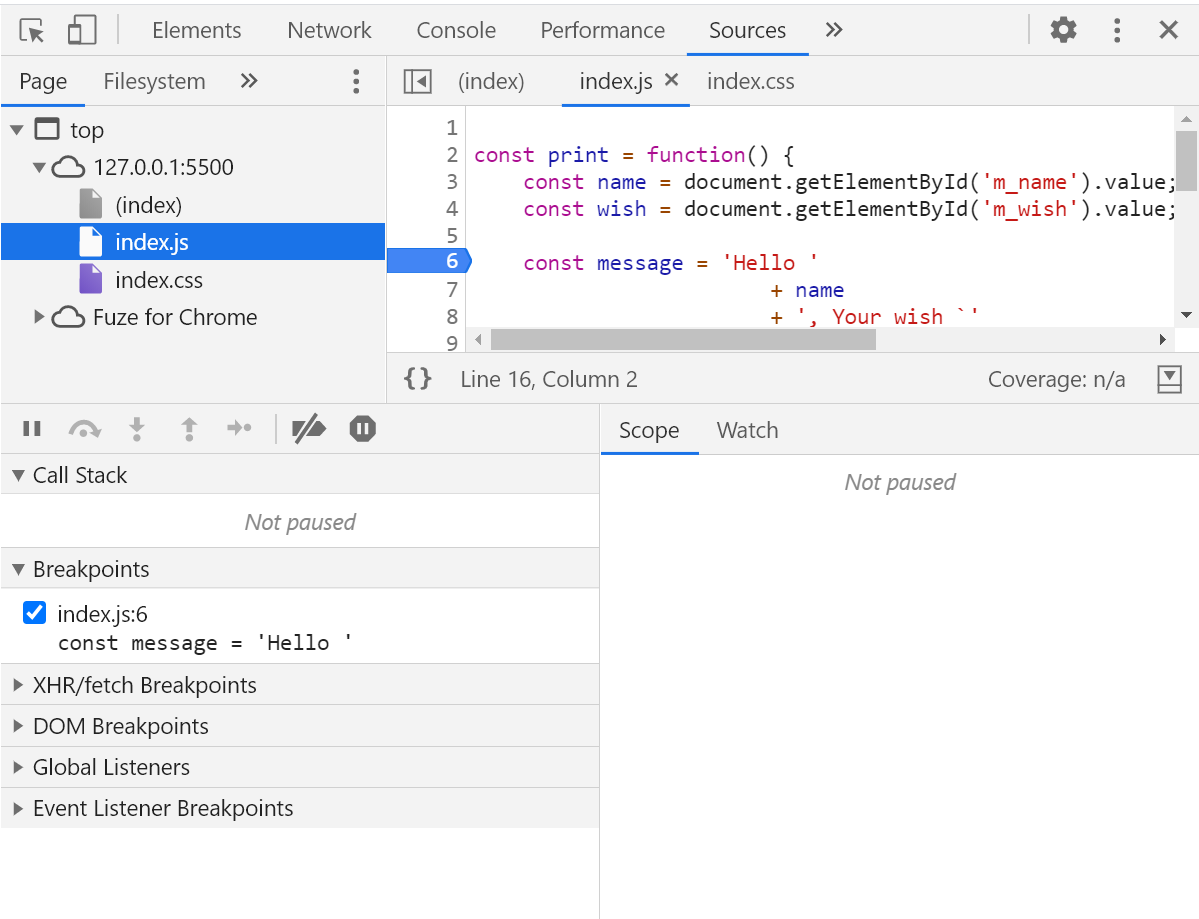
At the line of code
For you to set a line-of-code breakpoint follow the outlines steps
- Click on the Sources tab.
- Then you will browse the source file from the File navigation section.
- Go to the line of the code in the Code Editor section on the right.
- Click on the line number column and set a breakpoint on a line.
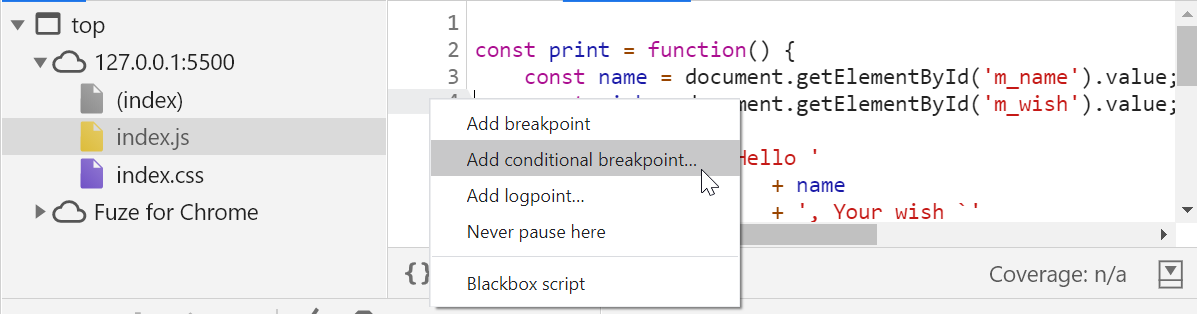
At a particular conditional breakpoint
Follow the steps below to set a conditional breakpoint.
- Click the Source tab.
- Browse the source file from the file navigation section.
- Then go to to the line of the code in the code editor section on the right.
- Next step is to Right-click on the line number and select the
Add conditional breakpointoption.
The browser will display a dialog box below the line of code, and you can input the set condition
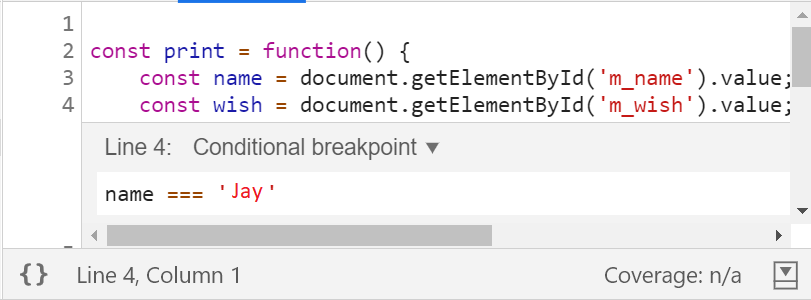
Next click or press Enter to activate the breakpoint. The breakpoint will be indicated in the line column
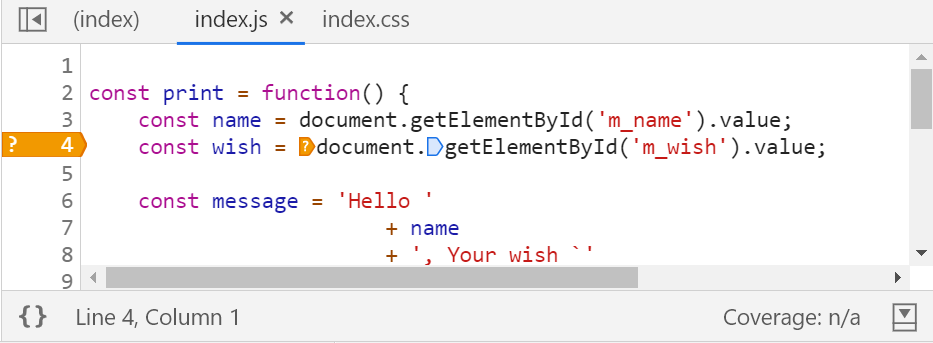
The execution of the code will be paused whenever the function print() is invoked with the set condition (Jay)
At the DOM node
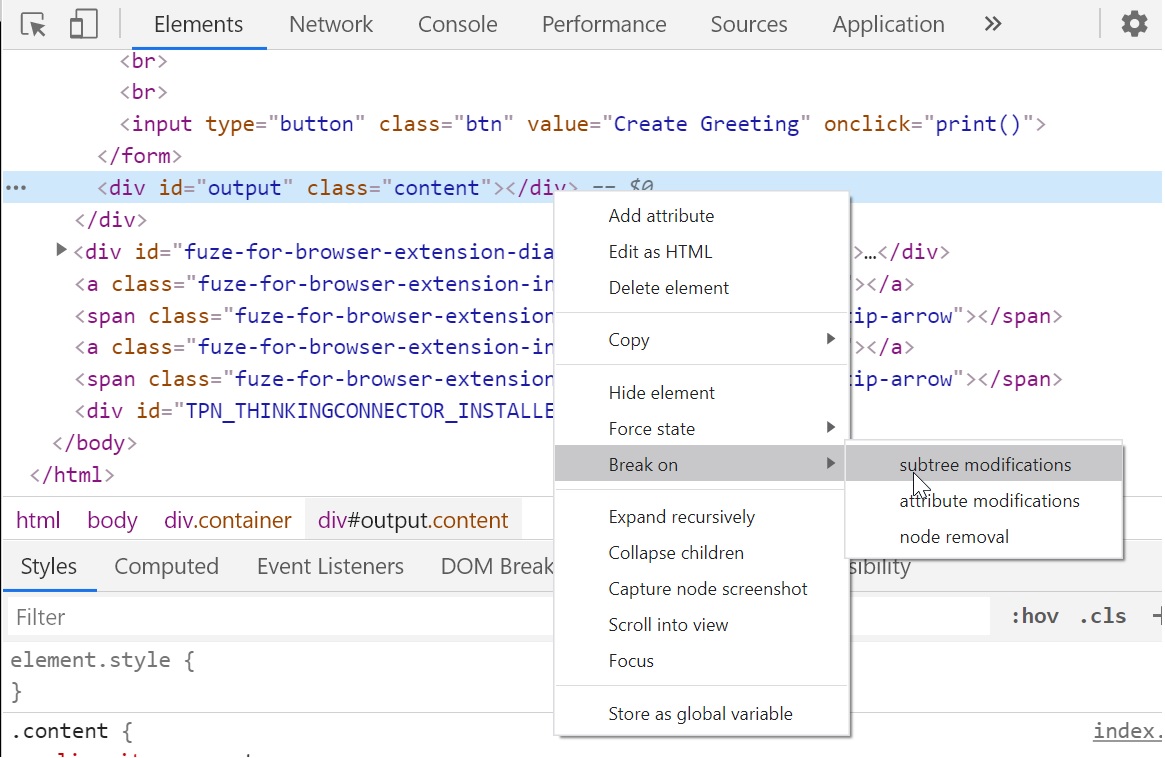
Here you can set breakpoints to pause your programming code execution when something is added, removed or, changed in the DOM.
Follow the steps listed to set breakpoints on DOM change:
- First click the
Elementstab. - Then go to the element that you want to set the breakpoint on.
- Right-click on the element to get a context menu. Select Break on and then select one of:
Subtree modifications,Attribute modifications, orNode removal.
Set breakpoint on the event listeners
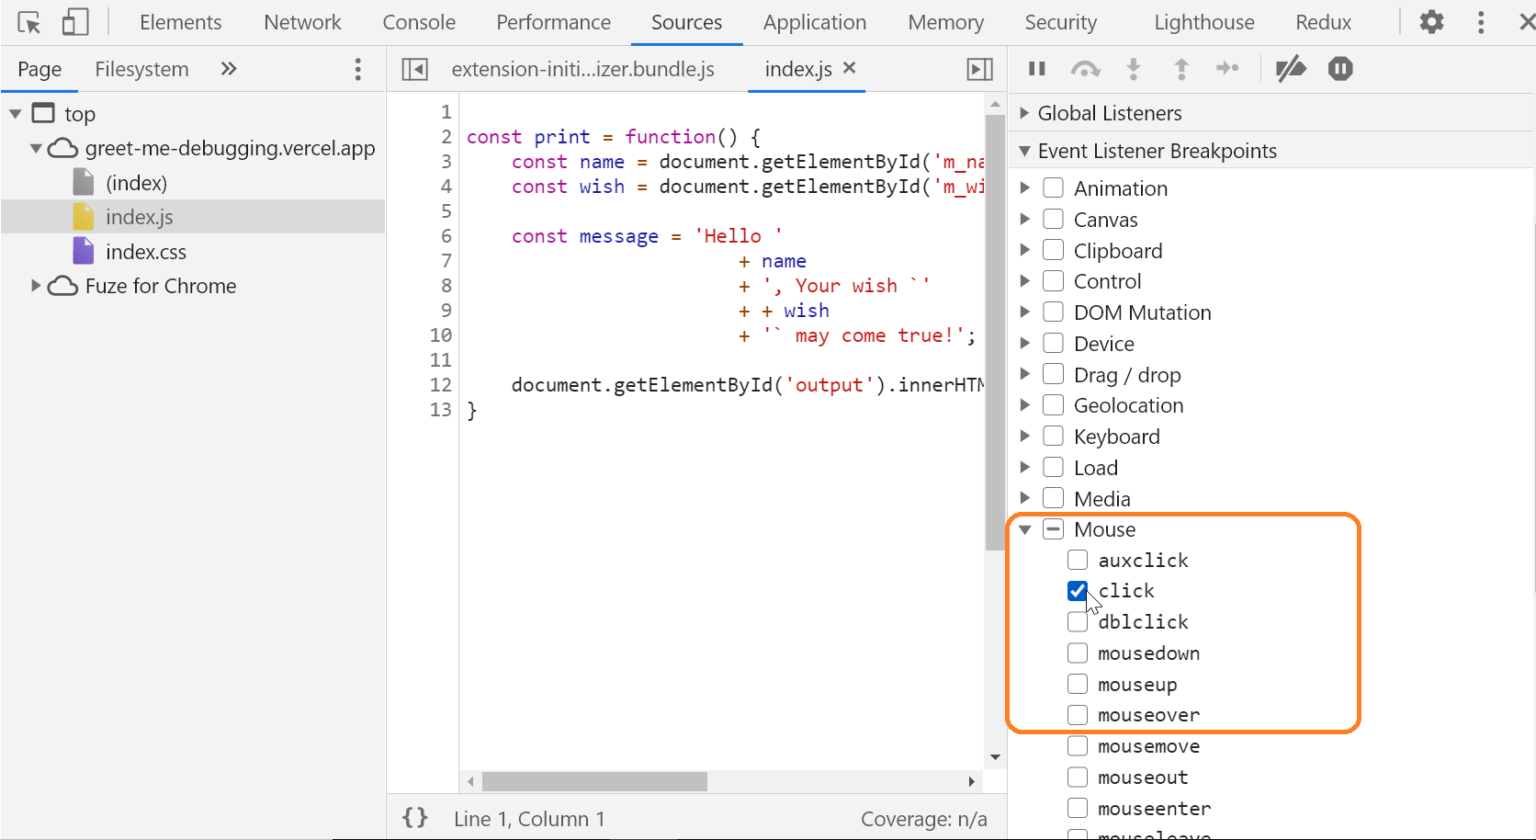
To set a breakpoint on event listeners:
- First step is to click the
Sourcestab. - Next expand the
Event Listener Breakpointsin thedebugger section. - Them select the list of event listeners from the category list to set breakpoints.
3. The debugger Keyword
Alternatively you can use a debugger keyword to stop the execution of JavaScript, and calls the debugging function its made avaialble in the code. This is similar to you setting a breakpoint. If there is no debugging, the debugger statement will not be effective.
Example:
let x = 15 * 5;
debugger;
document.getElementById("demo").innerHTML = x;
Other notable methods include:
4. Console.info()
The console.info() method has similarities to console.log(). Console.info() is used to print informations needed for debugging.
Code:
console.info("Testing the log info method")
5. Console.debug()
Using the Dev Tools uou can use the console.debug() method for debugging purpose. Its advisable to note that the output of console.debug() method will not be visible in Chrome developer tools. To make it visible you will enable the console filter option for all levels.
Code:
var userId = "UserOne";
var userId2 = "UserTwo";
var userId3 = "UserThree";

console.log("Console log"+ " " +  userId)

console.info("Console info" + " " +  userId2);

console.debug("Console debug" + " " +  userId3);
6. Console.warn()
This method simply refered to as console.warn() will display a warning message in the console. You will have to pass a message as a parameter and this particular message can be an object, array, or any variable.
var testVariable = 404;
var testObj = { firstname : "Ravidu", lastname : "Perera" };

console.warn("This is a Warning message")

// passing a variable
console.warn(testVariable)

// pass an object as a warning
console.warn(testObj)
7. Console.assert()
The console.assert() method print a message in the console if the expression is evaluated as false. To enable it you will need to pass a Boolean expression as a method parameter.
Code:
let x = 1;
let y = 2;
console.assert(x + y == 4, "Expression is false")
console.assert(x + y == 3, "Expression is True")
console.assert(document.getElementById("Test"), "No element found with ID 'Test'");
8. Console.time()
This is also know as Time, TimeLog and TimeEnd method. You can implement console.time() to measure accurately the execution time of the functions. This will help identify low-performing functions.
Code:
console.time("MyTimer")
for (var i = 0; i < addToCartButtons.length; i++) {
  var button = addToCartButtons[i];
  button.addEventListener('click', addToCartClicked)
}
console.timeEnd("MyTimer")

// MyTimer: 0.408935546875 ms
9. Search DOM elements in console
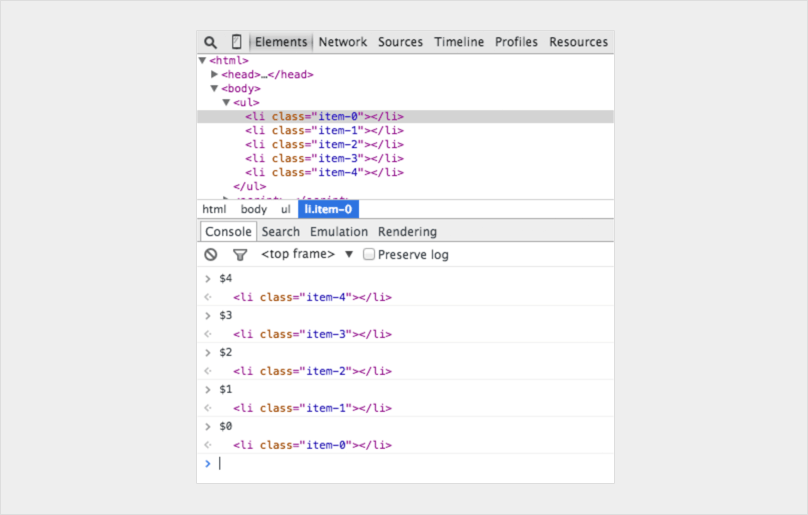
You can identify a DOM element in the elements panel and use it in your console. The last five elements will be kept alive by Chrome with marked element display identified with $0, the second to last marked element $1 and it goes on. Although you can mark following items in order ‘item-4′, ‘item-3’, ‘item-2’, ‘item-1’, ‘item-0’ then you can access the DOM nodes like this in the console:
10. Stack trace for a function
This method will displays a trace that show how the code ended at a certain point. console.traceenable a programmer to debug JavaScript, like for eample if you want to see the entire stack trace for the function call funcZ in the car instance on Line 33 you will follow this example:
Code:
var car;
var func1 = function() {
	func2();
}

var func2 = function() {
	func4();
}
var func3 = function() {
}

var func4 = function() {
	car = new Car();
	car.funcX();
}
var Car = function() {
	this.brand = ‘volvo’;
	this.color = ‘red’;
	this.funcX = function() {
		this.funcY();
	}

	this.funcY = function() {
		this.funcZ();
	}

	this.funcZ = function() {
		console.trace(‘trace car’)
	}
}
func1();
var car;
var func1 = function() {
	func2();
}
var func2 = function() {
	func4();
}
var func3 = function() {
}
var func4 = function() {
	car = new Car();
	car.funcX();
}
var Car = function() {
	this.brand = ‘volvo’;
	this.color = ‘red’;
	this.funcX = function() {
		this.funcY();
	}
	this.funcY = function() {
		this.funcZ();
	}
 	this.funcZ = function() {
		console.trace(‘trace car’)
	}
}
func1();
11. Debug() on a function
Set, unset or query the debugging on a function. The text and condition arguments will be the same, this can be accessed by the user once the browser has been entered, and it allow users to identify which breakpoint has been activated.
Code:
debug(fun, text = "", condition = NULL, signature = NULL)
debugonce(fun, text = "", condition = NULL, signature = NULL)
undebug(fun, signature = NULL)
isdebugged(fun, signature = NULL)
debuggingState(on = NULL)
Its important to note that as soon as a function is flagged for debugging is entered, normal execution is suspended and the body of function is executed one statement at a time.
12. Monitor() on a function
The monitor() on a function method allows the programmer to listen for calls on a specific function:
Code:
// Define a sample function
function myFn() { }
// Monitor it
monitor(myFn)

// Usage 1: Basic call
myFn()
// function myFn called

// Usage 2: Arguments
myFn(1)
// function myFn called with arguments: 1
Browsers' Debugging Tools
With most browsers having built-in debugging tools, you only need to activate the debuggibg in your browser by pressing "F12" and select Console. Or else follow the steps described below:
Chrome
- Open the browser.
- From the menu, select "More tools".
- From tools, choose "Developer tools".
- Select Console.
Firefox
- Open the browser.
- From the menu, select "Web Developer".
- Select "Web Console".
Edge
- Open the browser.
- From the menu, select "Developer Tools".
- Select "Console".
Opera
- Open the browser.
- From the menu, select "Developer".
- From "Developer", select "Developer tools".
- Select "Console".
Safari
- Go to Safari, Preferences, Advanced in the main menu.
- Check "Enable Show Develop menu in menu bar".
- "Develop" will appear in the menu
- Select "Show Error Console".